I have multiple values series I would like to draw on the same plot but the information on which serie the values is from is in a line.
My input data are the following format :
Probe
Param A
Param B
Time
Probes state
2
0
0
0
0
2
5.587641994
0.676904557
0.5
0
2
2.201407269
0.312587442
1
0
2
0.456207061
0.101925172
1.5
0
3
0
0
0
0
3
4.339078206
0.482884258
0.5
0
3
3.488354199
0.771082107
1
0
3
1.740710898
0.042079133
1.5
0
5
0
0
0
0
5
0.869201874
0.246838368
0.5
0
5
0.585464537
0.124907482
1
0
5
2.22687224
0.081106812
1.5
0
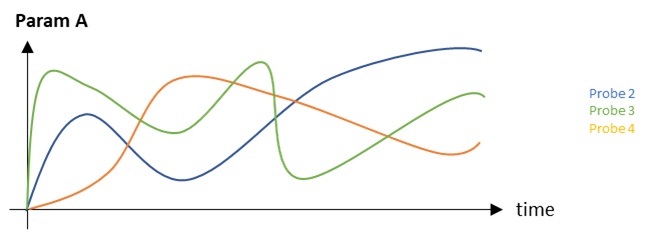
Here is what I want to obtain, for each probe the values of Param 2 vs time :
There is an additional difficulty as the number of probes is not set and may vary based on the input database.
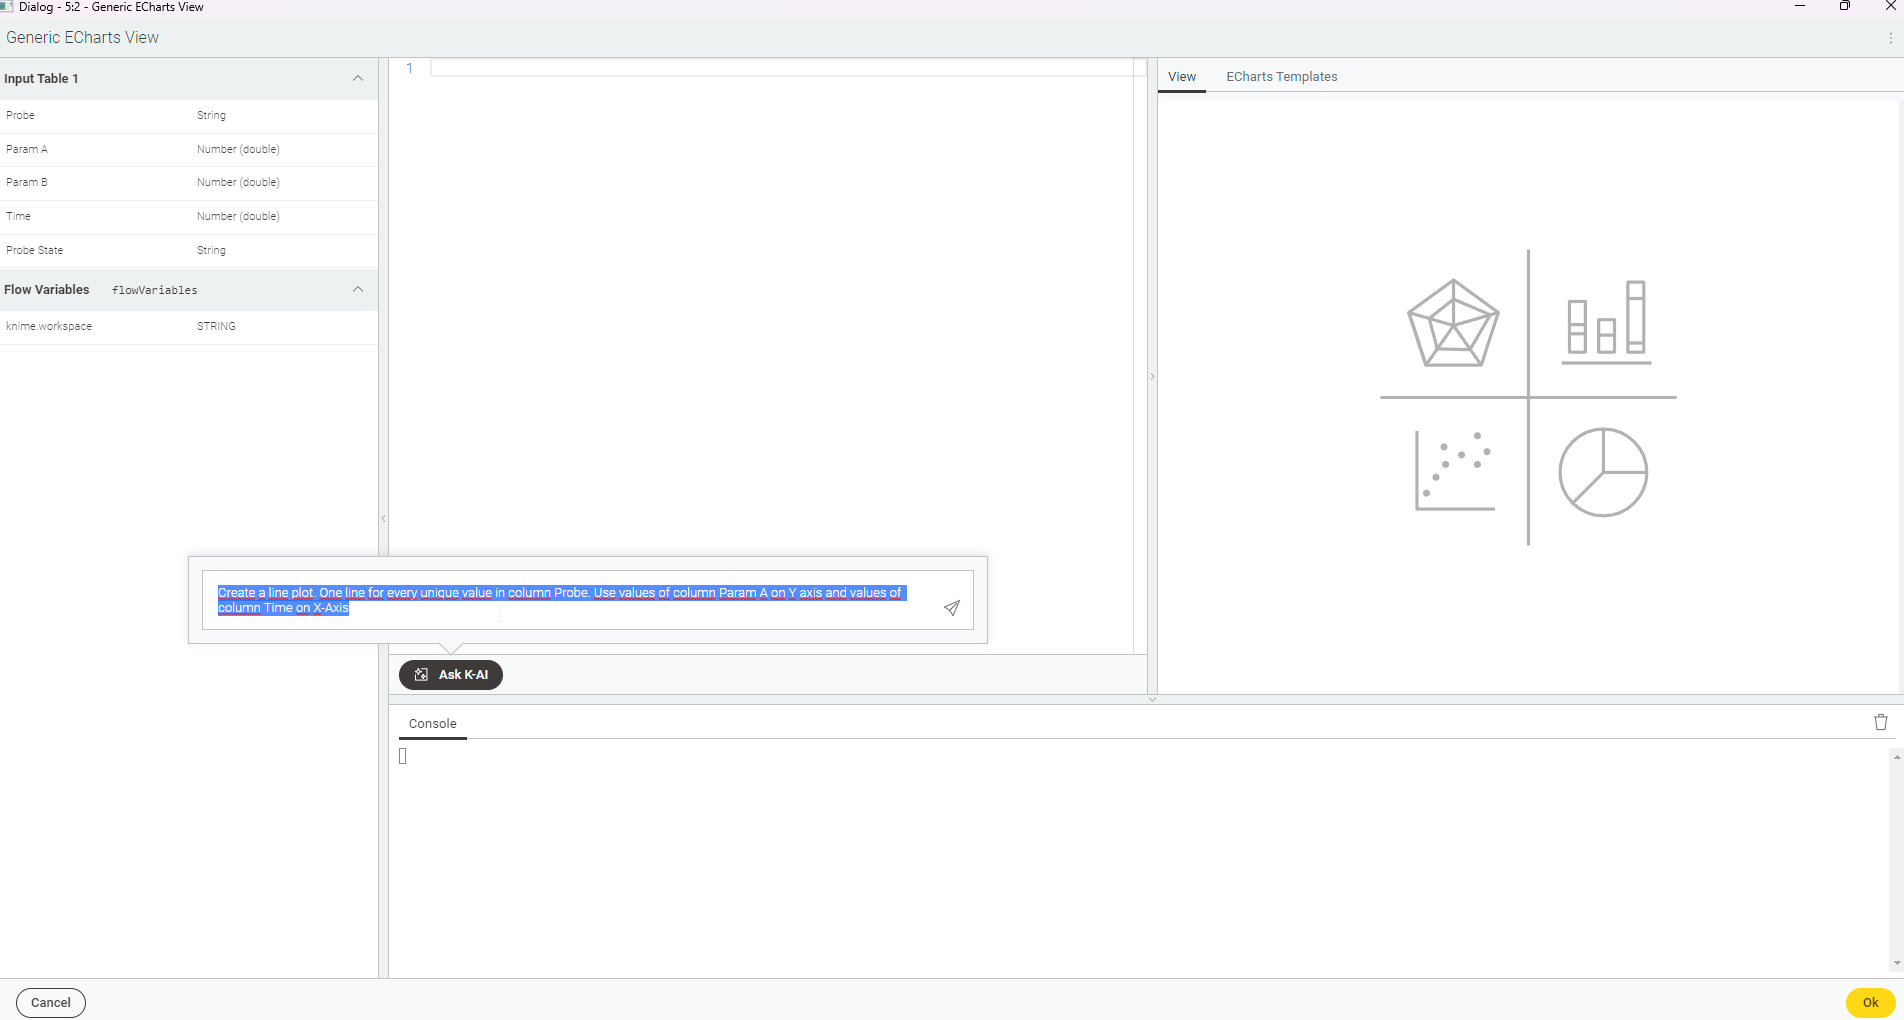
I tried with “transpose” and “sortby” to create new columns for Param A for each probe for the “Line Plot” module (I think I already saw something like this work) but the data transformation wasn’t successfull.
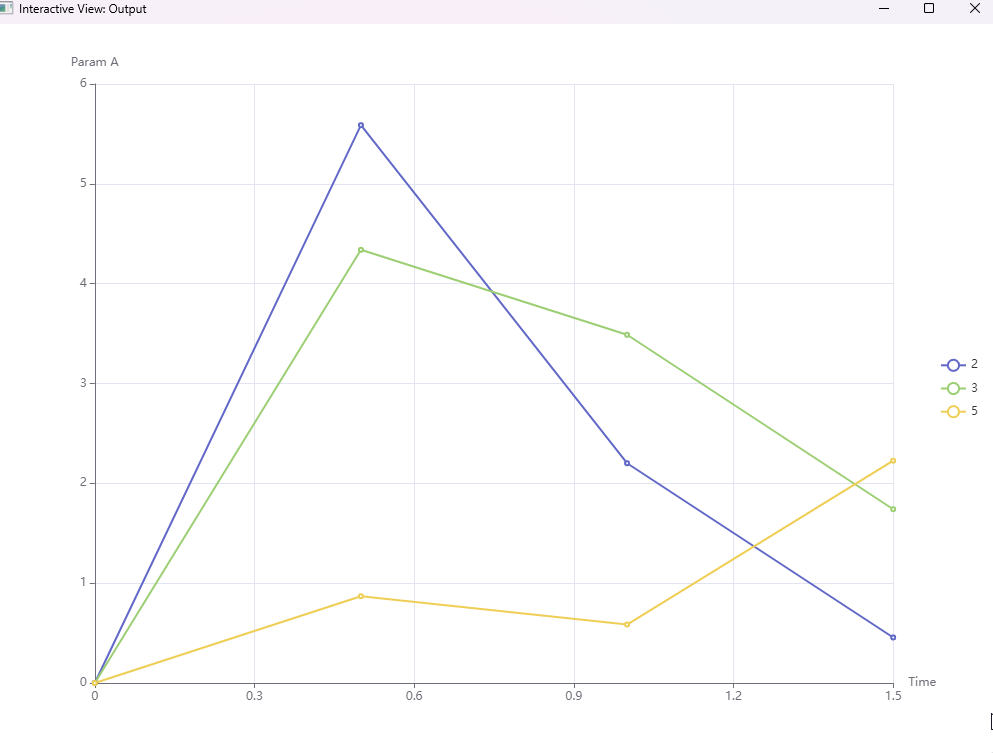
Wow, that’s fantastic, thanks.
I did some tries and it works really well. But I did not find how to export the image or insert it in a report like a traditional Line Plot. Do you know if it is possible to do it ?
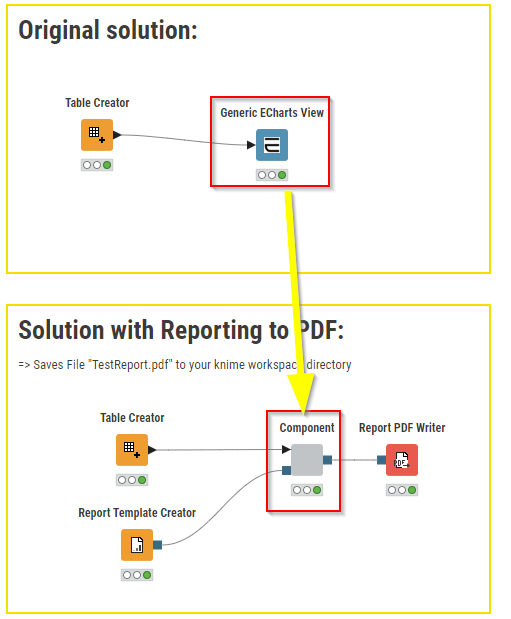
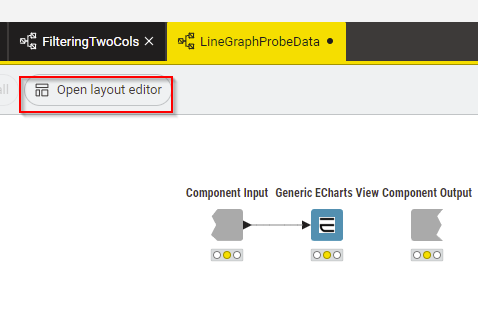
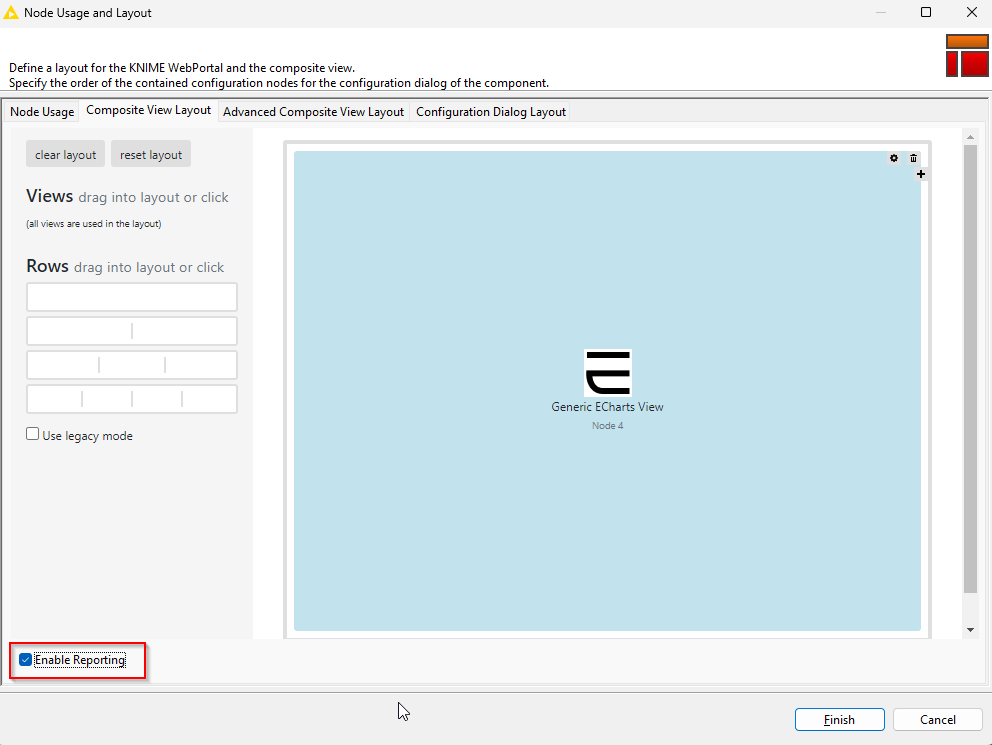
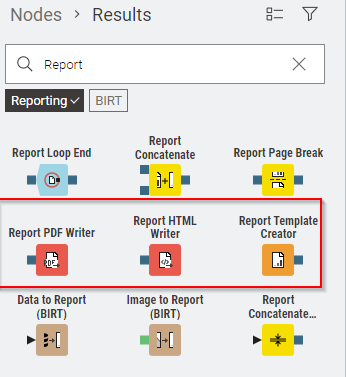
connect the Report Template Creator to the Component Input and either the Report HTML or PDF Writer to the output node and edit the configuration to define where the file is to be saved to: