I have created line charts for multiple features using JavaScript.
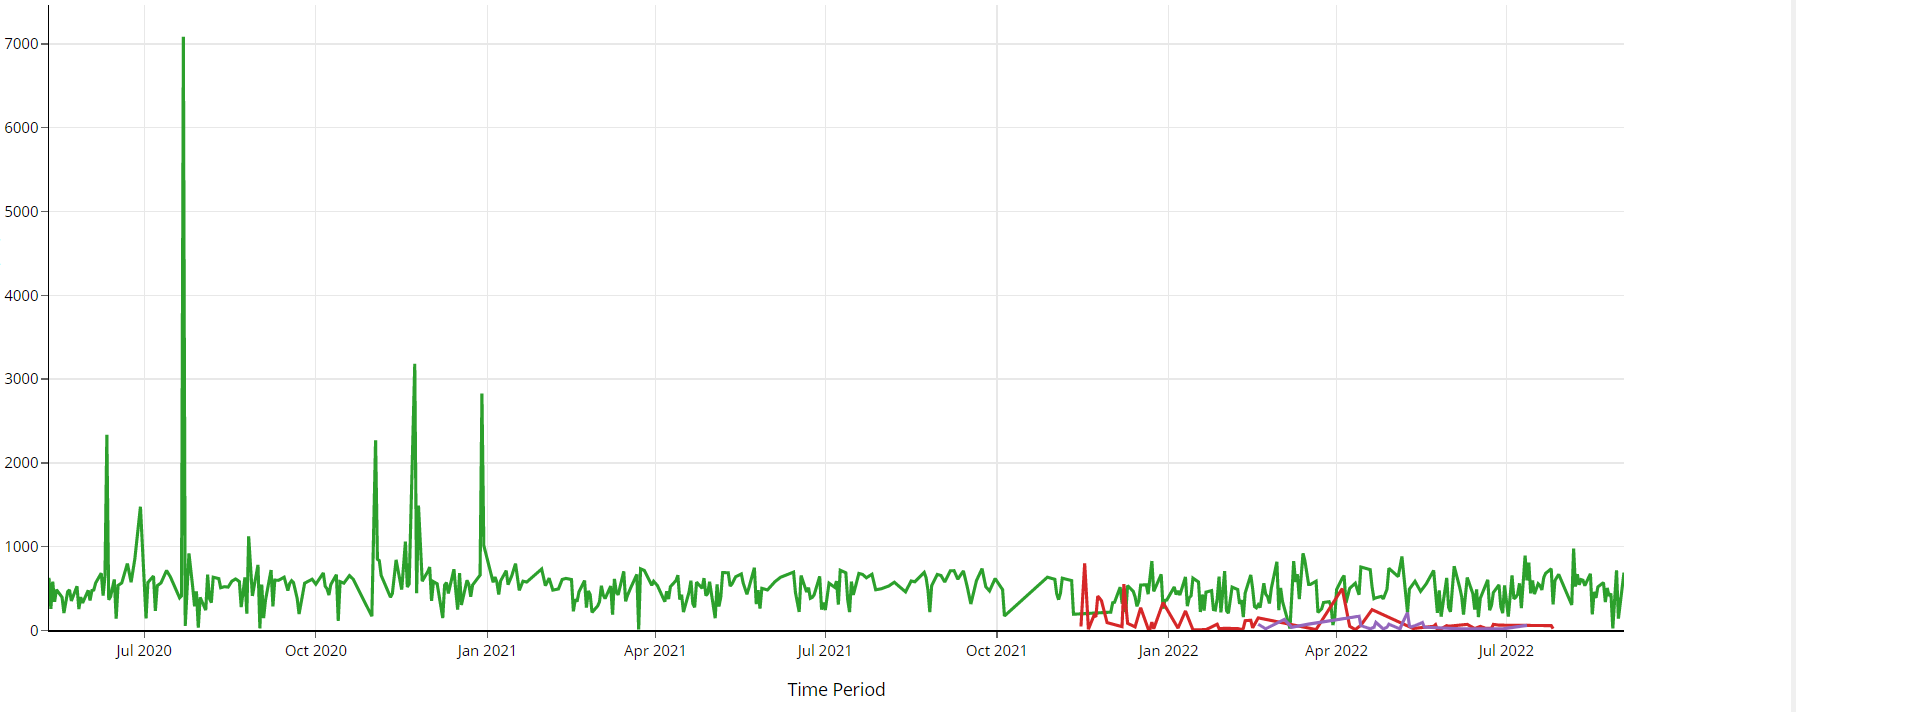
All feature lines work fine when selected individually.
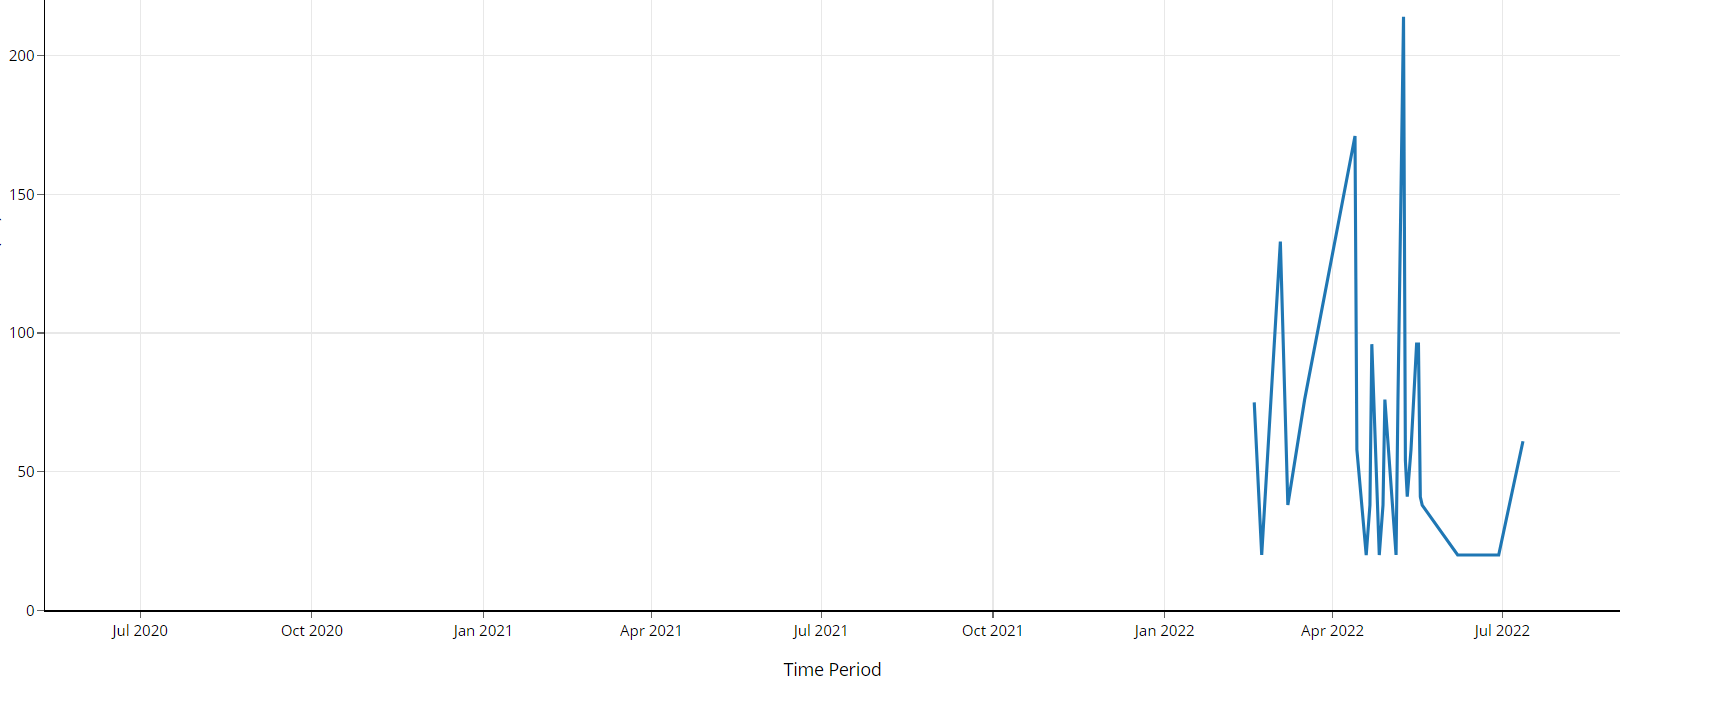
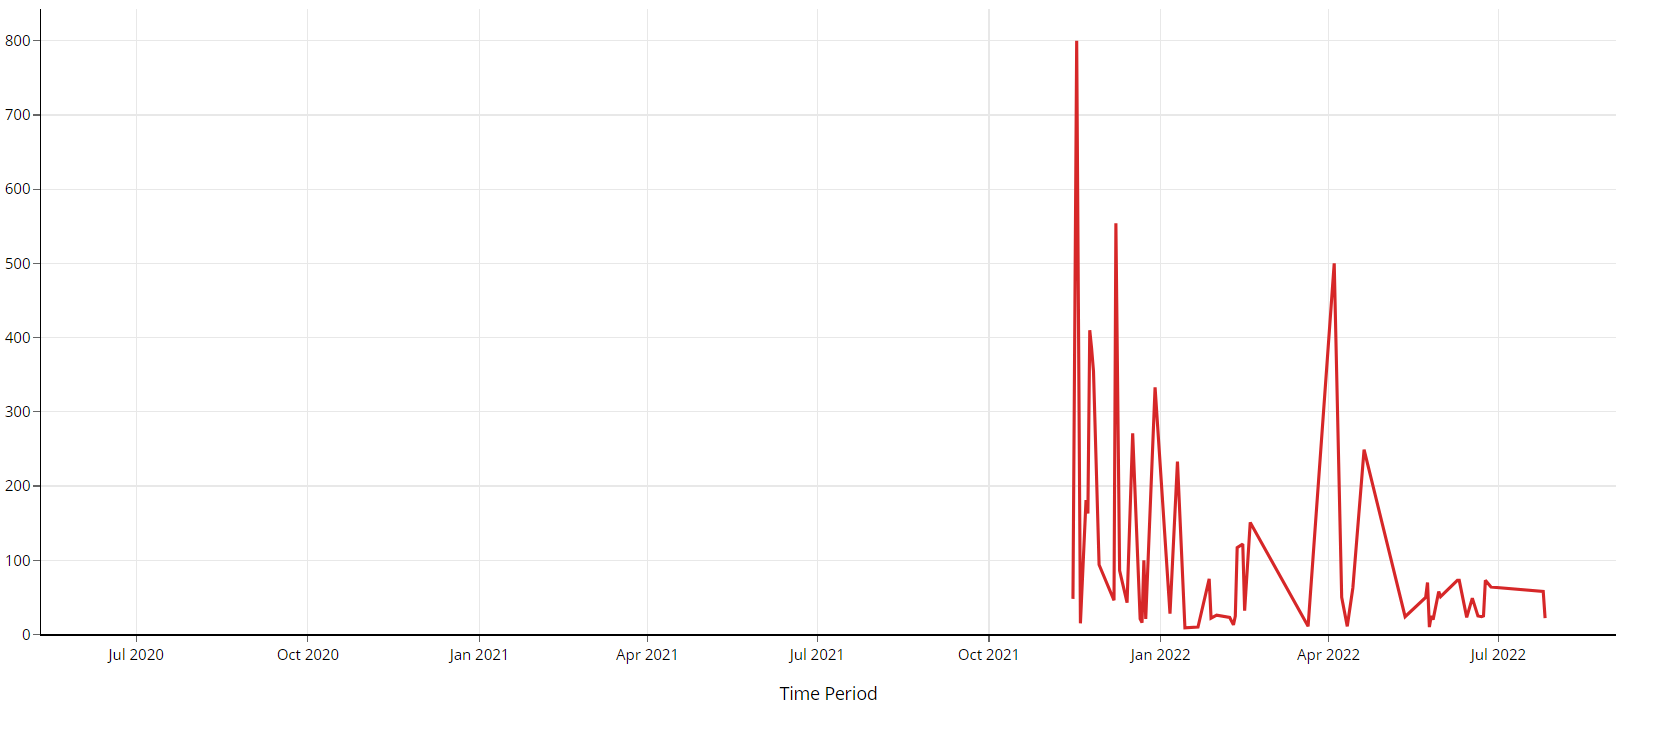
The challenge, however, is with the last two features (red and blue) that do not grow to occupy the entire chart area when selected.
I have tried with;
xaxis : {
autorange : true,
rangemode : 'tozero',
autoshift: true,
constrain: 'domain',
fixedrange: false,
automargin=true,
autosize: true,
},
Observation
The red and blue charts have missing numbers(no data) all through to Nov 15, 2022 and Feb 18, 2022 respectively.
Can I get some ideas on how to make each of the charts to fill the plot area.
Thank you.