Hi @najath_ambalakk,
glad to hear we are heading into the right direction. About the date transformation / extraction issue. That is happening because the pattern does not match. It has been an inconveniency for me quite aa long time but one I knew and how to handle. I took a few minutes to raise a feature request. Maybe you upvote it?
Back to the wrong values. Try this RegEx ^[^T]+T(\d+\W\d+)(\W\d+)?$ which made the second optional.
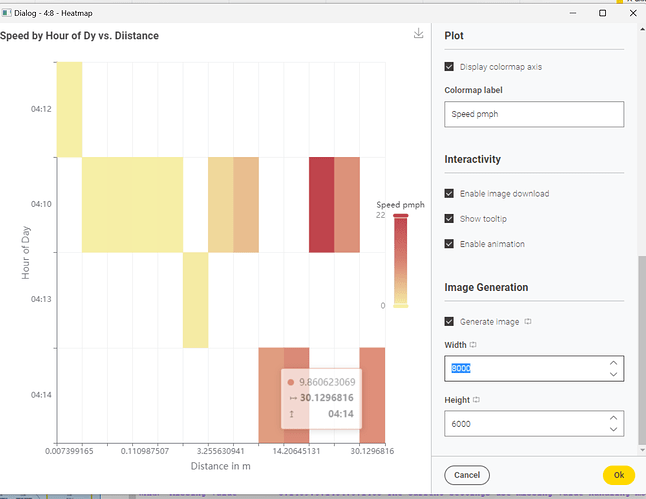
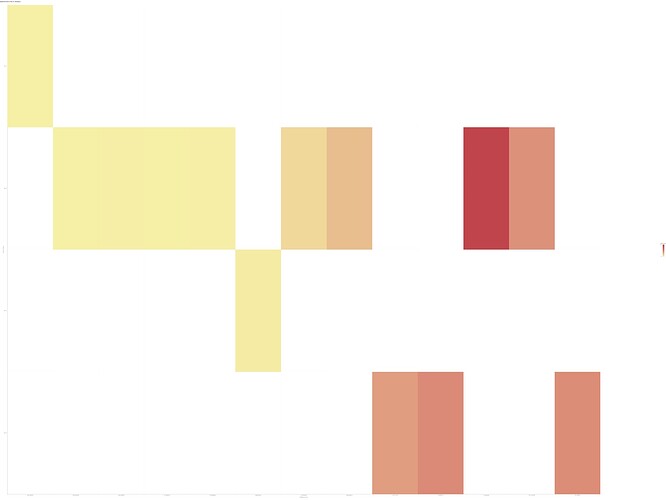
High-Res Image
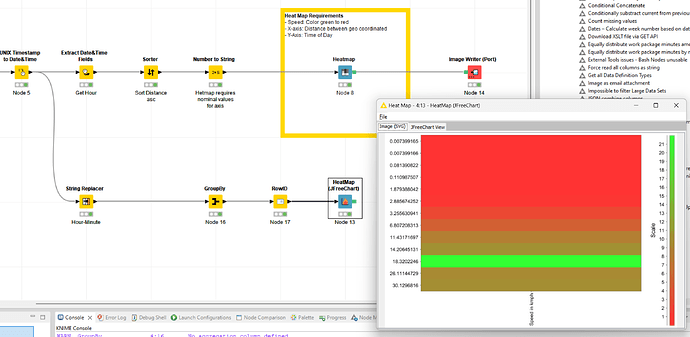
Either you enable image generation at the very bottom of the config and crank up the resolution (less advisable due to processing bottle necks) or try using the JFreeChart HeatMap as it is able to generate SVG (Vector based images). Though, I haven’t figure out the correct settings yet.
Note: There seems to be a rendering bottle neck when previewing the generated image. I have a fairly decent system but the image rendering was stuttering. There are also font sizing issues as they do not scale but seem to be set in pixel.
Also worth pointing out the other feature request of mine to enable SVG generation in the new nodes ![]()
Here two bugs I reported which would love to see your vote too:
About the large heat map. You might want to cluster by hour of day as a minute wise representation does add little insights. Using the already present Extract Date&Time Fields node is then the best choice.
PS: I updated the workflow in the Hub. With more sample data I could have engineered is in such aa fashion that each column represents aa bus line which is what I believe you aim for. Though, you might give it a shot figuring that out yourself ![]()
Best
Mike


