I’ve spotted an issue when using the Scatter Plot node that if I set the Axes ranges to use domain information in the Axis Configuration tab. It plots out OK but data points at the top and bottom of the ranges are plotted half cut off in the resulting image (see example below). This is obviously not ideal and a shame when this feature is actually really useful to ensuring your axes scales are all the same across several plots.
Can this be fixed to allow enough space on the axes beyond that min or max for the data points to fully fit on?
Alternatively or additionally could we have the option to set the axes ranges ourselves in this node?
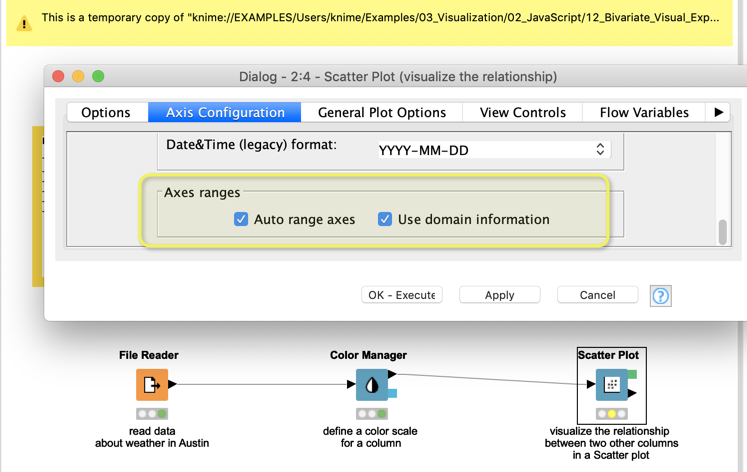
Question is to which Scatter Plot node you are referring to? In the example below, you could use the “Auto range axes” and “Use domain information” to adapt the axes.
If this does not help could you provide a minimal workflow that reproduces the problem?
We have a ticket in our system to incorporate custom axis ranges in the Line Plot node, and it makes sense to do this for the Scatter Plot node as well. I don’t have an ETA for you on when that might happen, but it’s definitely something we’re thinking about.
Thanks for the feedback - it helps us prioritize fixes and features better!
Thanks for the responses. It’s this scatter plot node that I’m referring to =>
If I use the Auto range axes then the ranges are different between plots.
Checking the Use domain information box does give the same ranges between plots which is great BUT at the expense of the fact the data points at the edges of the ranges are physically plotted half off the image as illustrated in the plot I included above. Adding some extra room to the ranges would overcome this and make the plots look just that bit better and more professional.
Great to hear that custom axes are coming this will be big jump in functionality.

 could we have the option to set the axes ranges ourselves in this node?