Problem to insert a node R-View (Table) in a dashboard KNIME

Good morning,
I have some difficulty to add a node R View Table on a KNIME dashboard via the “Node” usage and Layout.
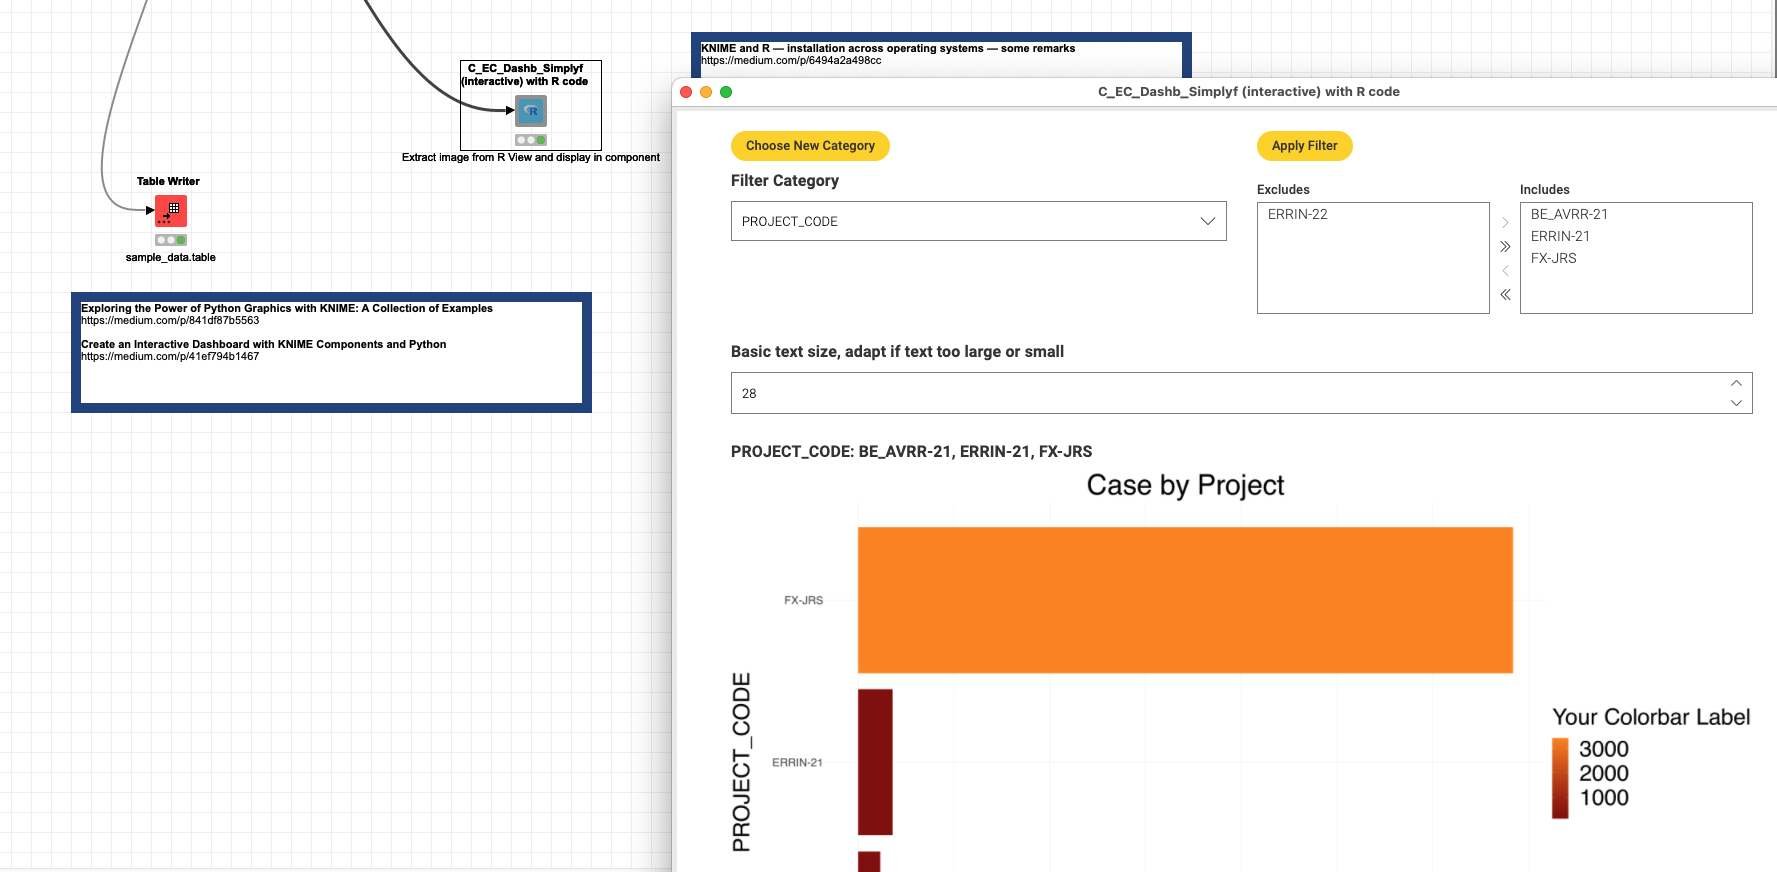
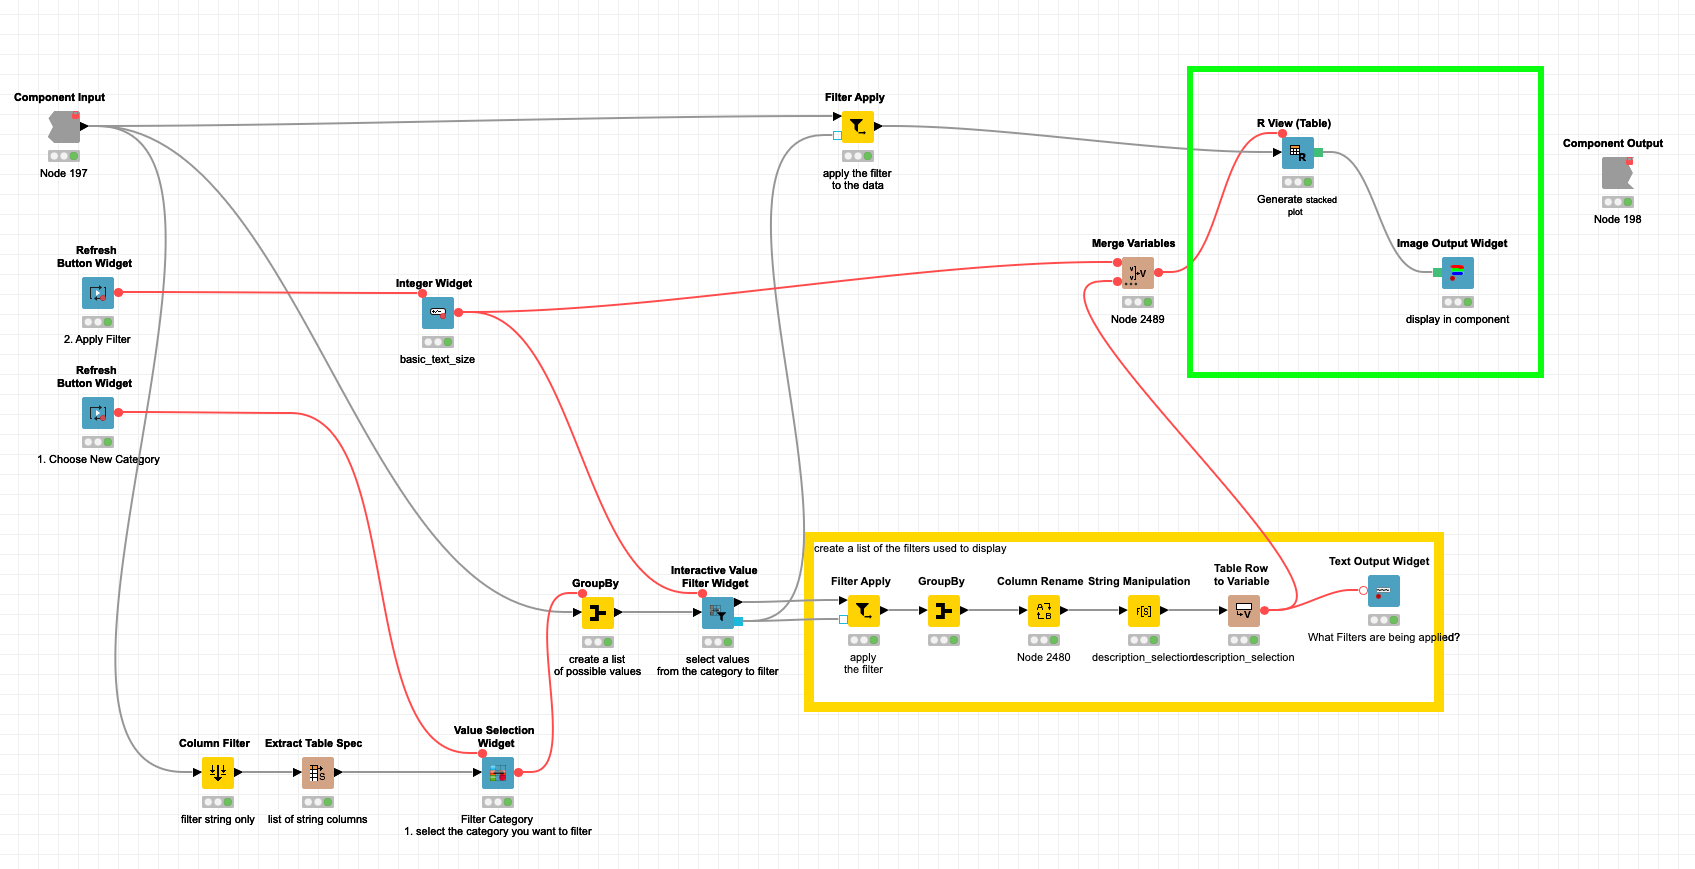
As you see here we be into the component created for the dashboard where we have all the chart nodes that have to appears:

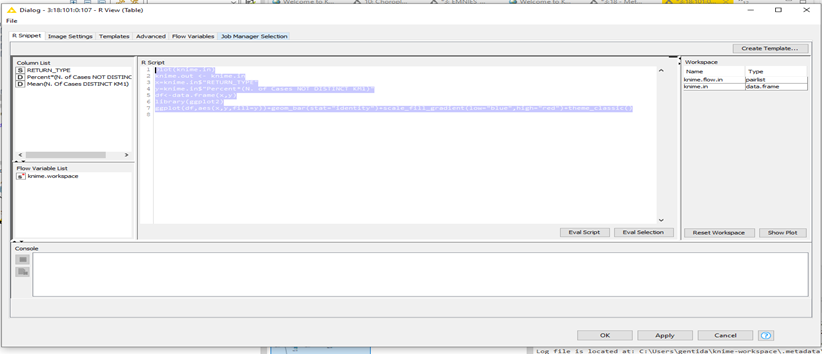
The result of the R view (Table) Node is the following:
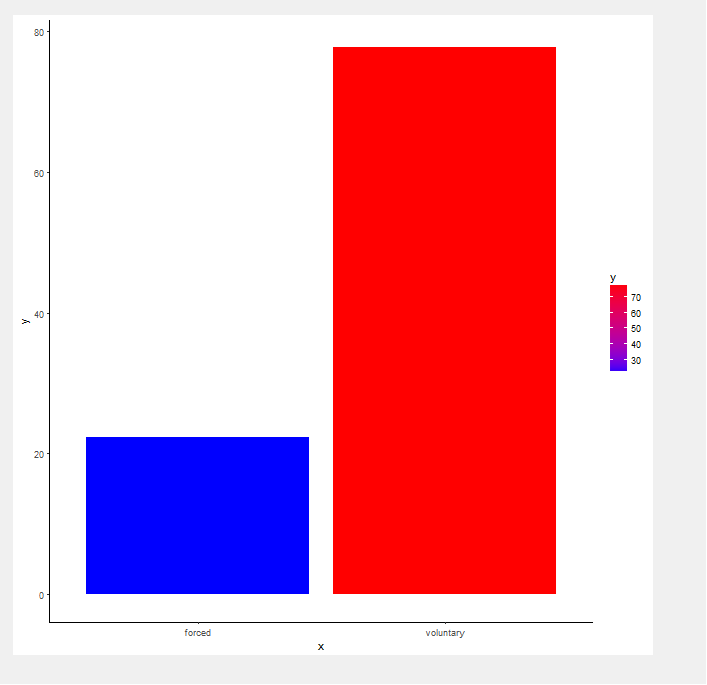
With this code:

plot(knime.in)

knime.out ← knime.in

x = knime.in$“RETURN_TYPE”

y = knime.in$“Percent*(N. of Cases NOT DISTINCT KM1)”

df ← data.frame(x,y)

library(ggplot2)

ggplot(df,aes(x,y,fill=y))+ geom_bar(stat=“identity”) + scale_fill_gradient(low=“blue”,high=“red”) + theme_classic()

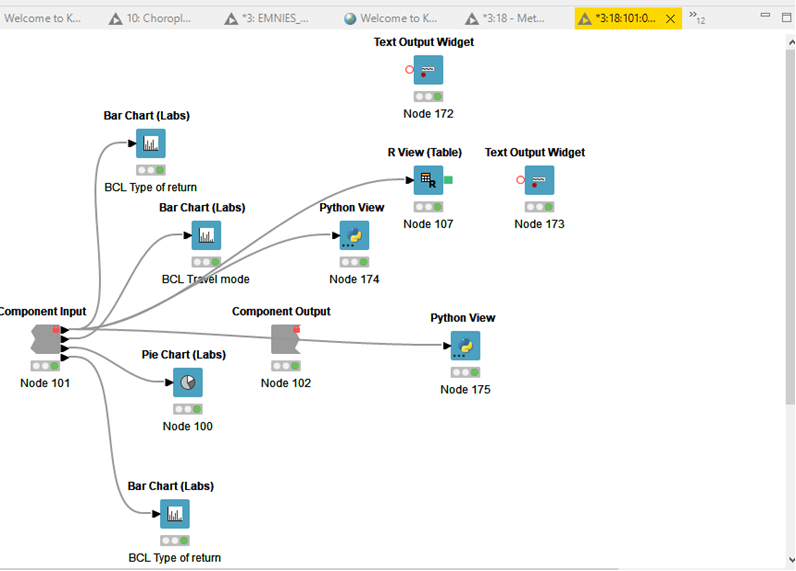
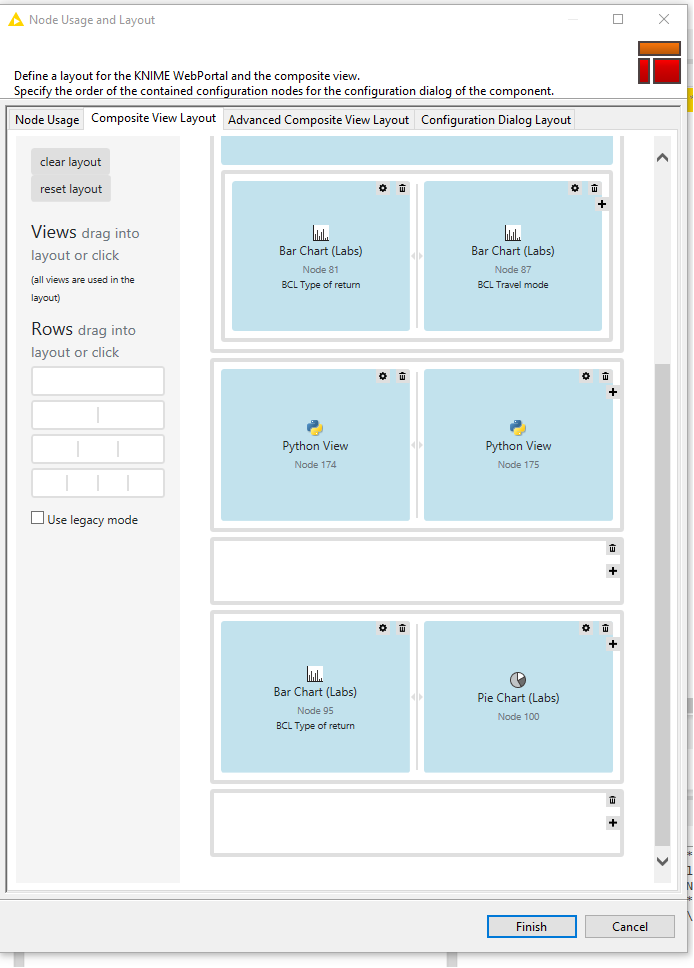
When I open the node usage and layout, where we build the dashboard ,
As you see, R View (Table) should be appear on the left for after moving it on the right , but it does not appears and then I cannot add on the right for add to dashboard:

Have you had the same issue? Have you found some workaround for solving this problem?
Kind Regards

Hello DanGenEire,

Since the view resulting from the R-View (Table) node is returned in the output image port, could you please try using the Image Output Widget node, to view the image in your dashboard?

Best,
Keerthan

3 Likes

OK thank you for your suggestion, When I can I will try. I have to build a interactive dashboard in KNIME using dynamic filter, and then, I think that R-snippet with this constraints, is not the good node for this type of dashboard.

Or can we use an Image Output Widget to connect to the widget Value Selected Filter or Nominal Row Filter?

@DanGenEire I have updated the example from the other thread to also work with an R view:

This is how it does look inside the component:

kn_forum_75456_python_component_interactive_filter.knwf (296.2 KB)

1 Like

This topic was automatically closed 90 days after the last reply. New replies are no longer allowed.