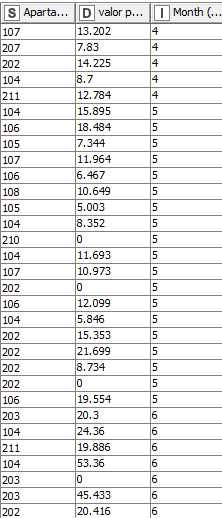
I am having a bit of a problem where im making a chart and i have 3 sets of info about a apartment complex, the number of the apartment, the price according to size and the month that it was paid (here is a simplified table)
i want the chart to look like this where the number of the room and the size are in the one under but the bar on top controls the month that is being paid
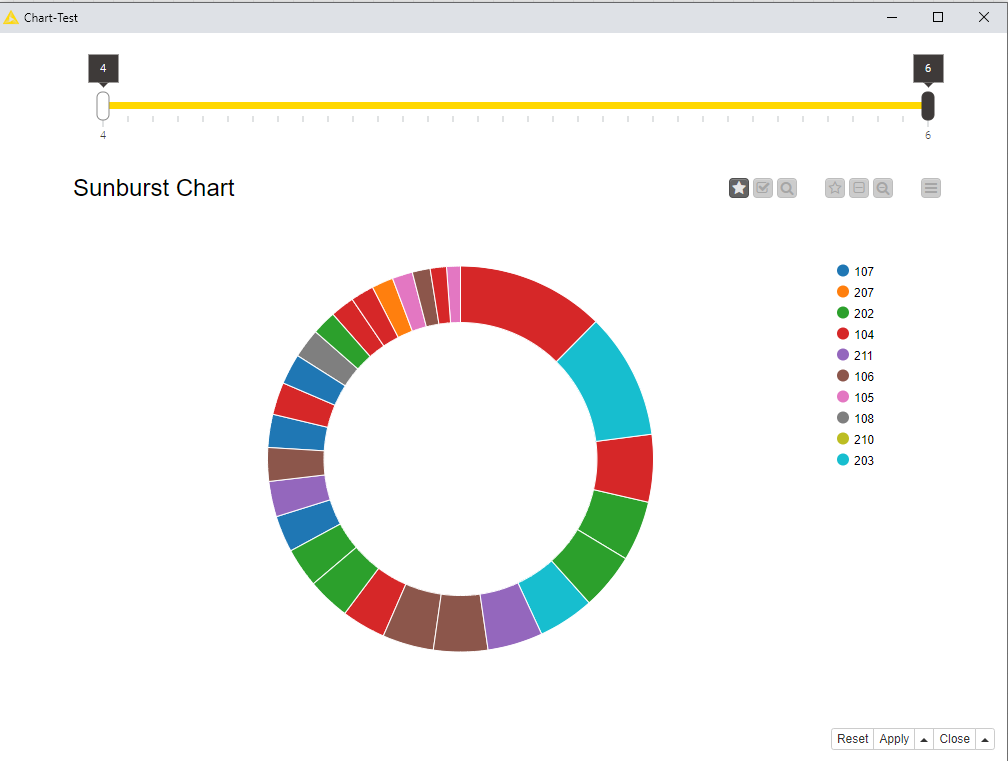
but unfortunately the bar does not connect to the chart no matter what i do