Hi all,
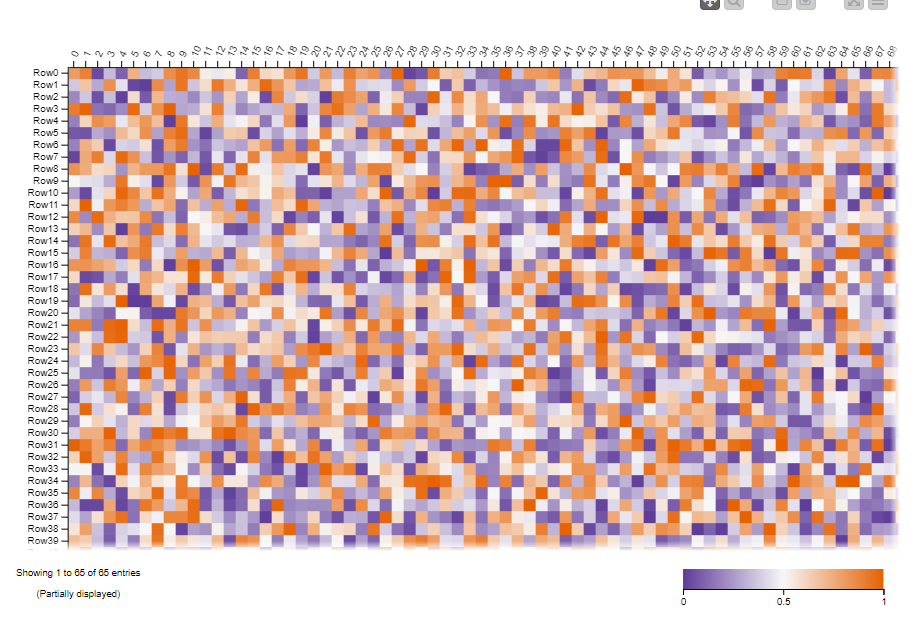
I am trying to visualize a dataset with a JS-Heatmap (/Views/JavaScript/Heatmap, using Knime AP v4.5.2). The dataset has a size of 65 rows x 167 columns. I tried different settings, but I can’t get the view to display the entire dataset. The view of the heatmap is truncated at the ~68th column and I need to pan the map in order to see the other columns.
Is there any way to adjust the settings in a way, that the heatmap for the entire dataset is shown at once (ideally also in a shared component, in which I want to embed the heatmap-node)?
Hi lelloba, thanks for the suggestion. But in this case, the dataset should be displayed as is (what I’ve shown in the screenshot are just dummy values, the actual look more “meaningful”), so grouping them is unfortunately not an option.
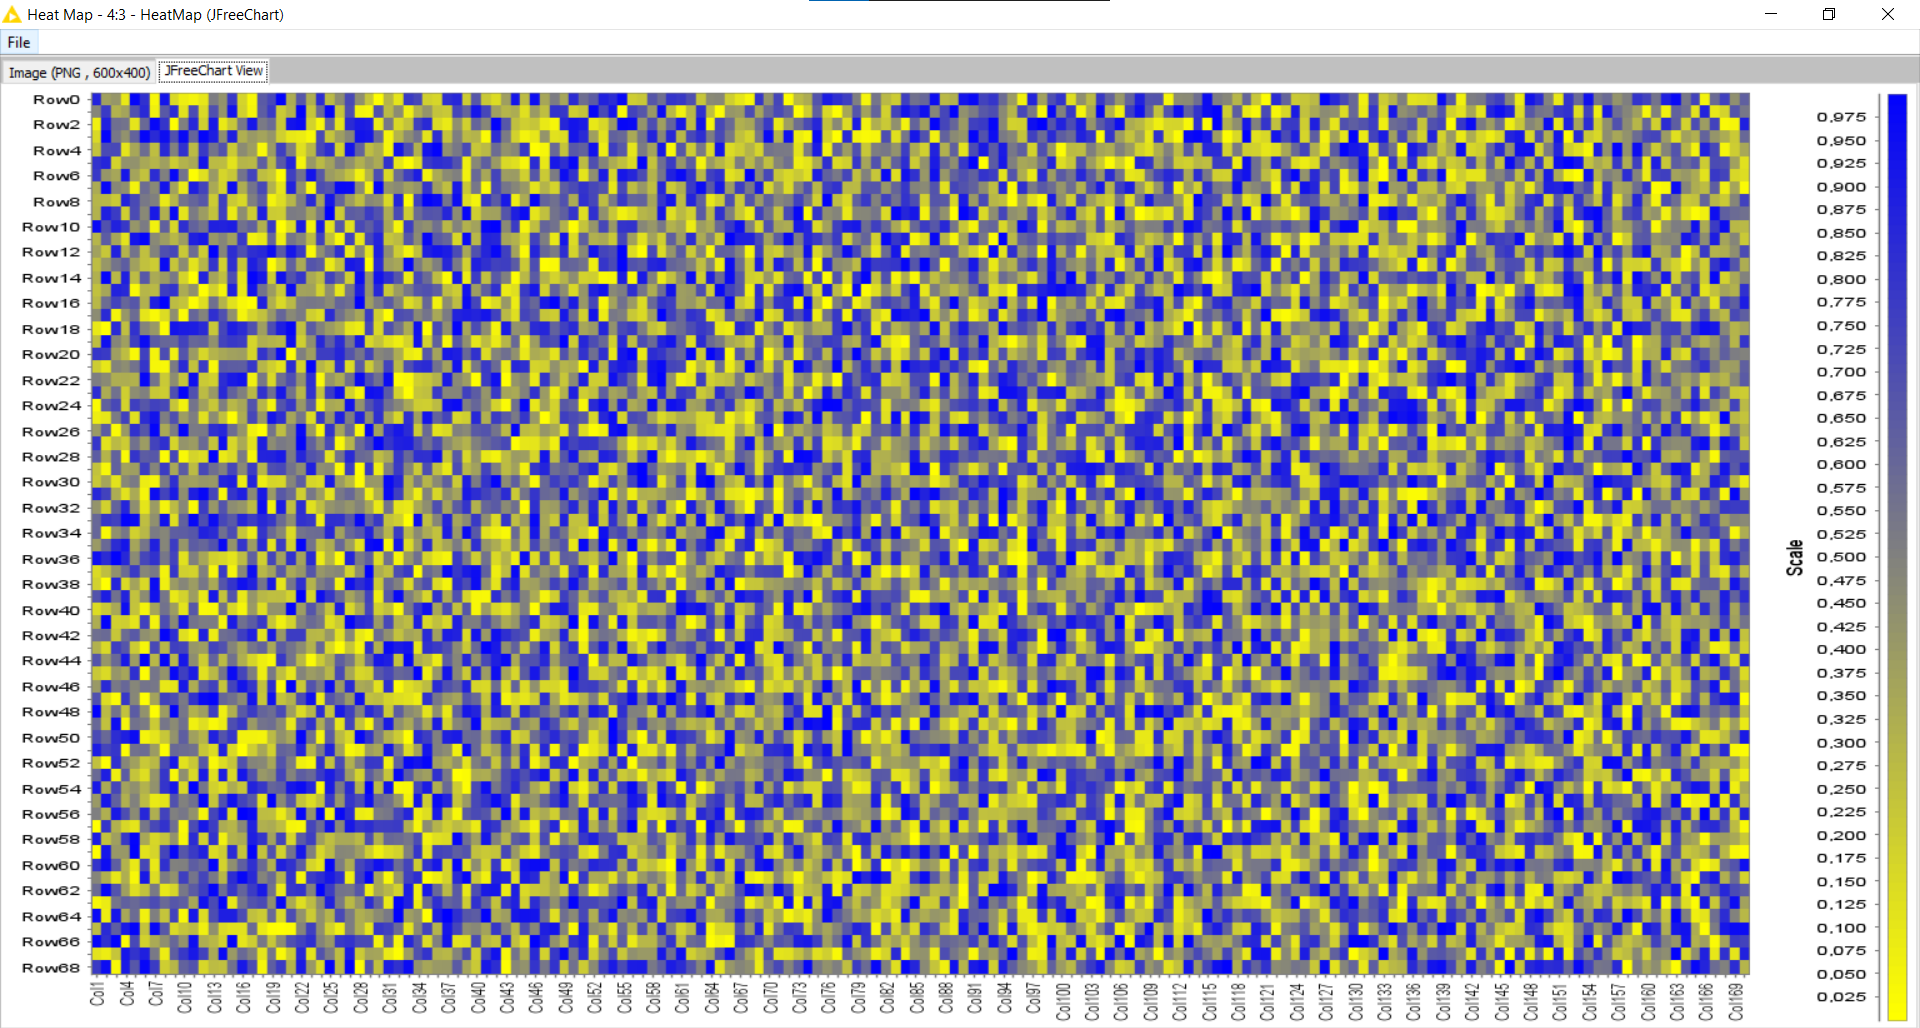
Turns out, I forgot to mention that using the heatmap interactively (i.e. with the ability to select rows) is important in this case. While the JFreeChart node is able to show the entire dataset, it seems that it lacks this capability. Anyways, thanks for taking the time to dig into this!