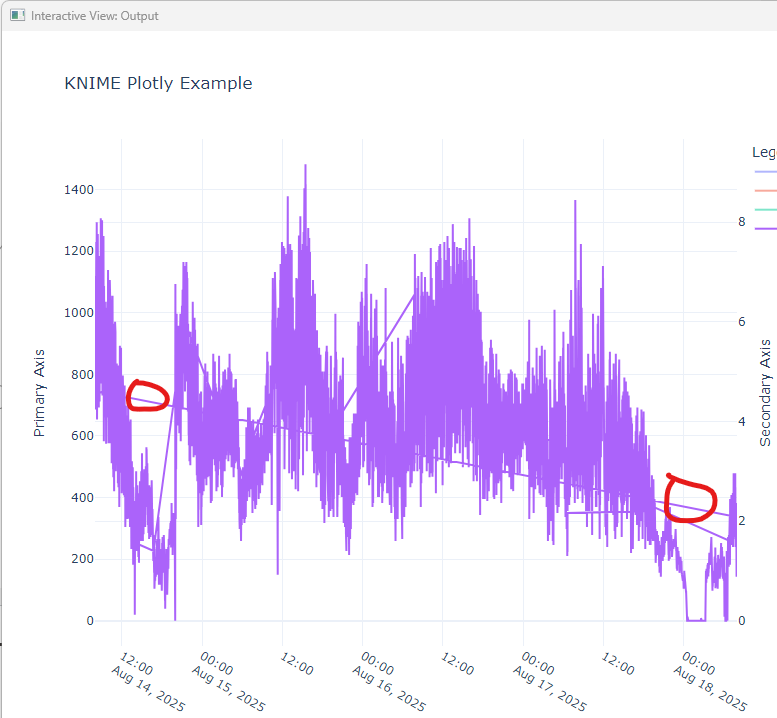
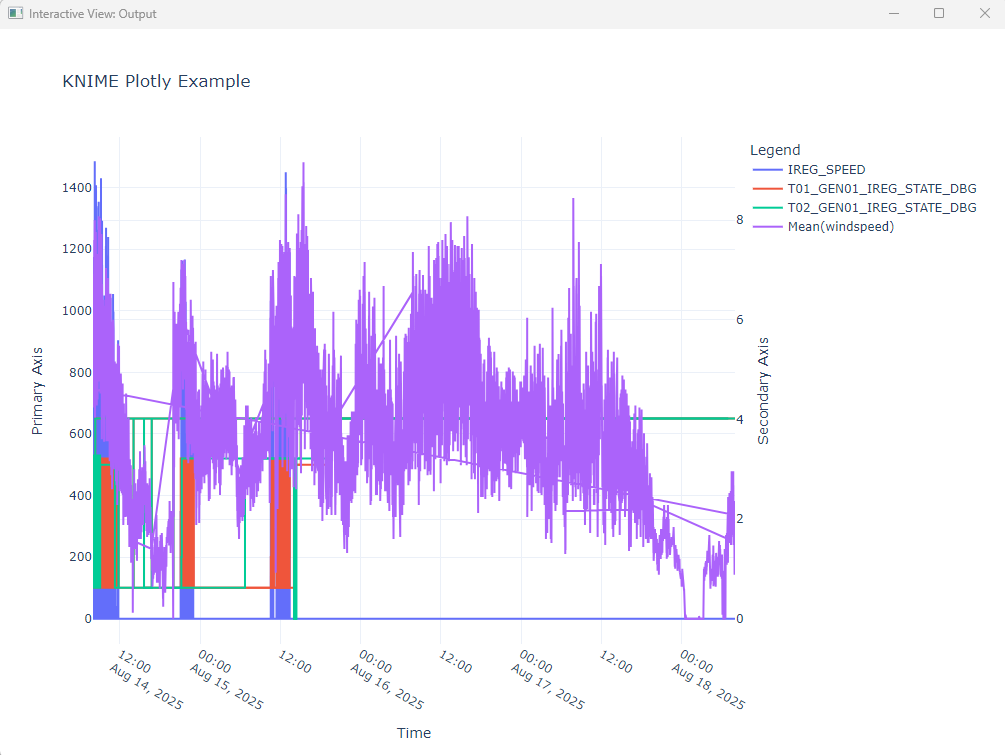
I am a student and working for a modular wind turbine company. I trying to plot multiple values on Primary and secondary y-axis and common times series x-axis using Python View Node. It is showing values correctly but some unnecessary ramps (connecti are there in the data which is useless as you can see in the attached picture. Mean (windspeed) is in float and rest of the values are integer. I used (mode=‘lines’, line_shape=‘hv’,) but it didn’t solve the problem. Please guide me.
@muzammil222 welcome to the KNIME Forum. If you use Python packages you have a lot of options how to create graphics. Best is to describe what you want to a tool like ChatGPT and then implement that into a KNIME component - like in this example:
Maybe you have some sample data and show us what you have done until now. Without spelling any secrets.
I have three different CSV files. I have to use data from three different file which has values at different seconds within the 10 second data. What I have done is floored the values using math formula node and then I joined the table to get the final table with required values combined. I also used UNIX timestap to date&time node to change the time from EPOCH to normal date and time. Eventually, I have connected the python view to see all the values. I am facing this issue. I can share futher details in Private.
Hi,
in the past I had similar “ramps” when the data was not sorted correctly. So if you are using a line plot the table must be sorted according to the x-value.
1 Like
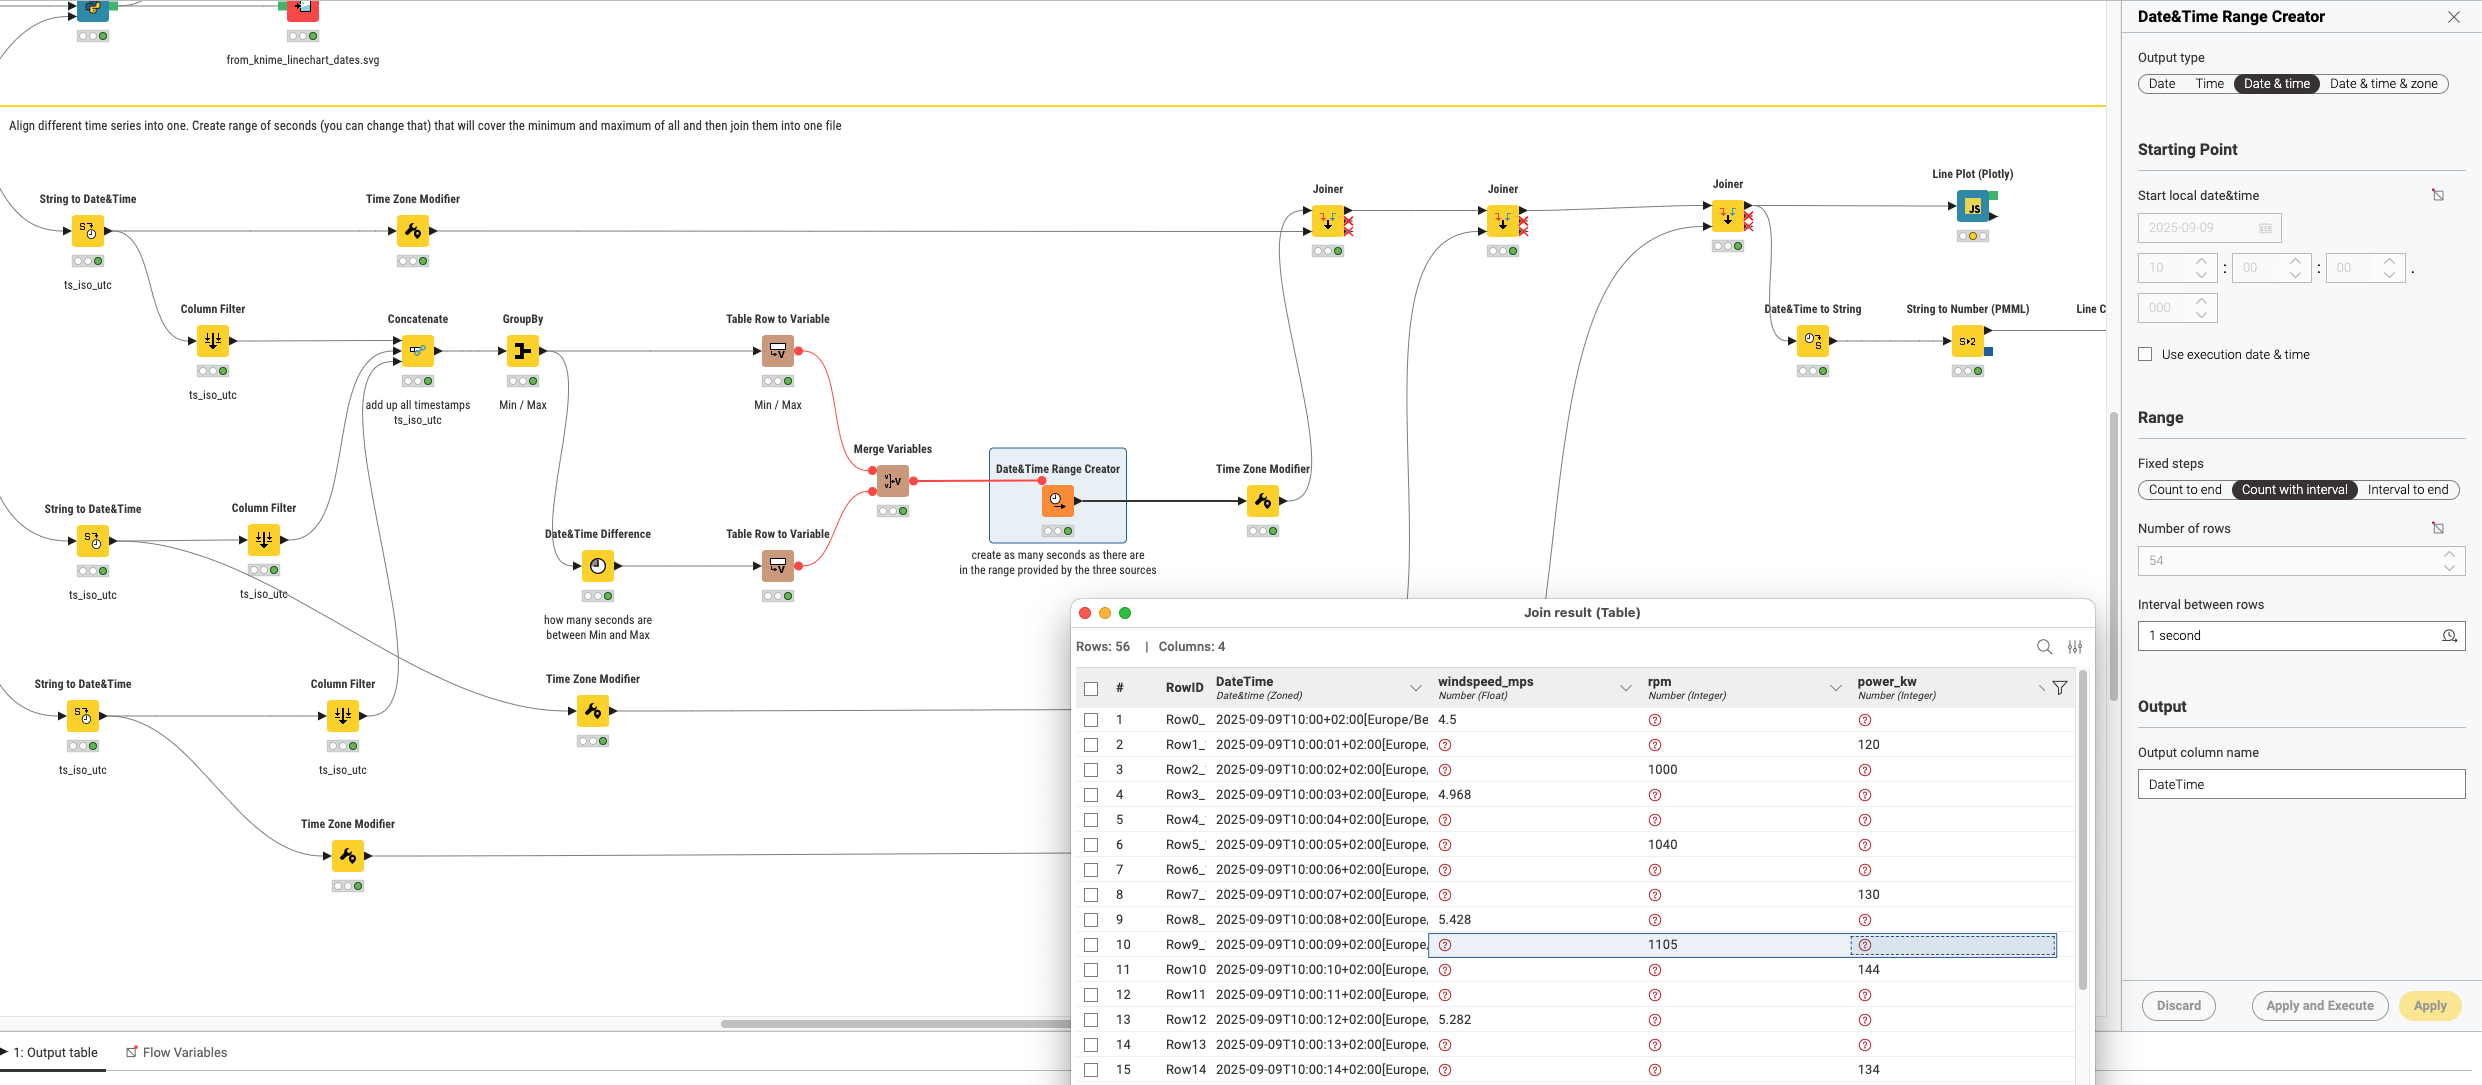
@muzammil222 you can use KNIME to create a master date range from your three (or more) date ranges and then join the dates together. You might also create a group like for 5 seconds window for example. If you want a continuous flow you can replace the missings so that for each second the ‘current’ value of the other columns is being used.
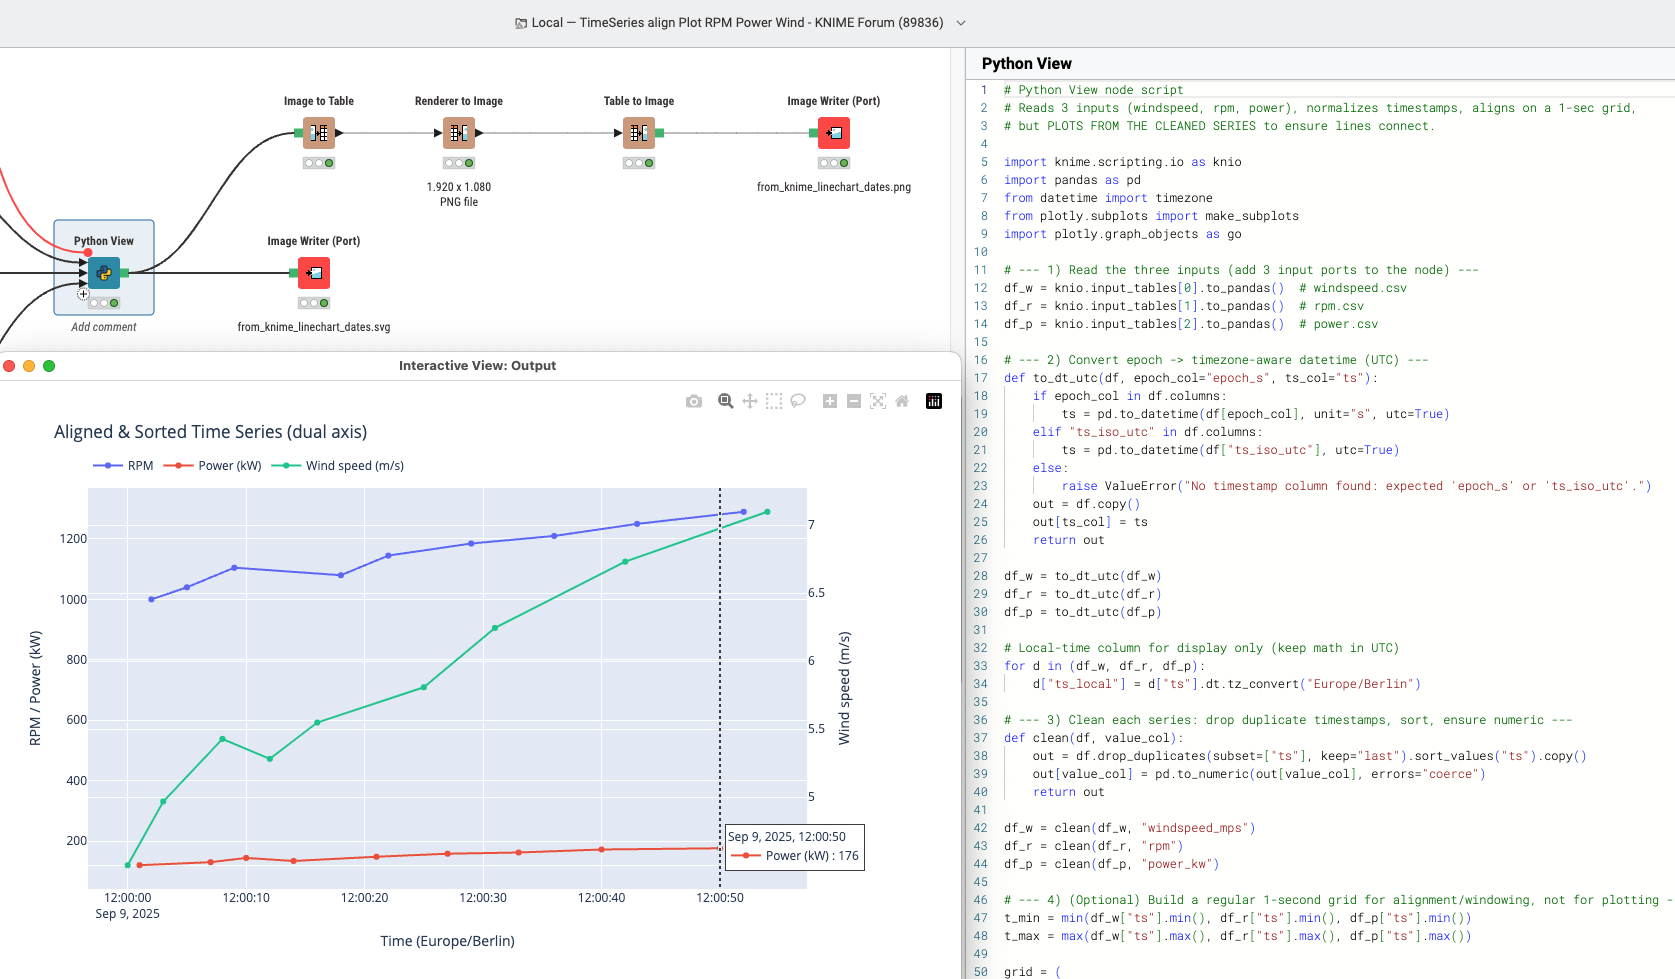
Next thing would be to just use a Python code that does everything for you. This one has been written using ChatGPT (not very creative I admit) and will align the values and convert the time stamps. You can do quite complicated graphics these days with relative ease (and hope you still understand what the code is doing)
1 Like
This was my first thought as well - likely a sorting problem. The good news is those are easily fixed (or at least checked off the first step of the troubleshooting list) ![]()
1 Like
This topic was automatically closed 90 days after the last reply. New replies are no longer allowed.