Hi everyone
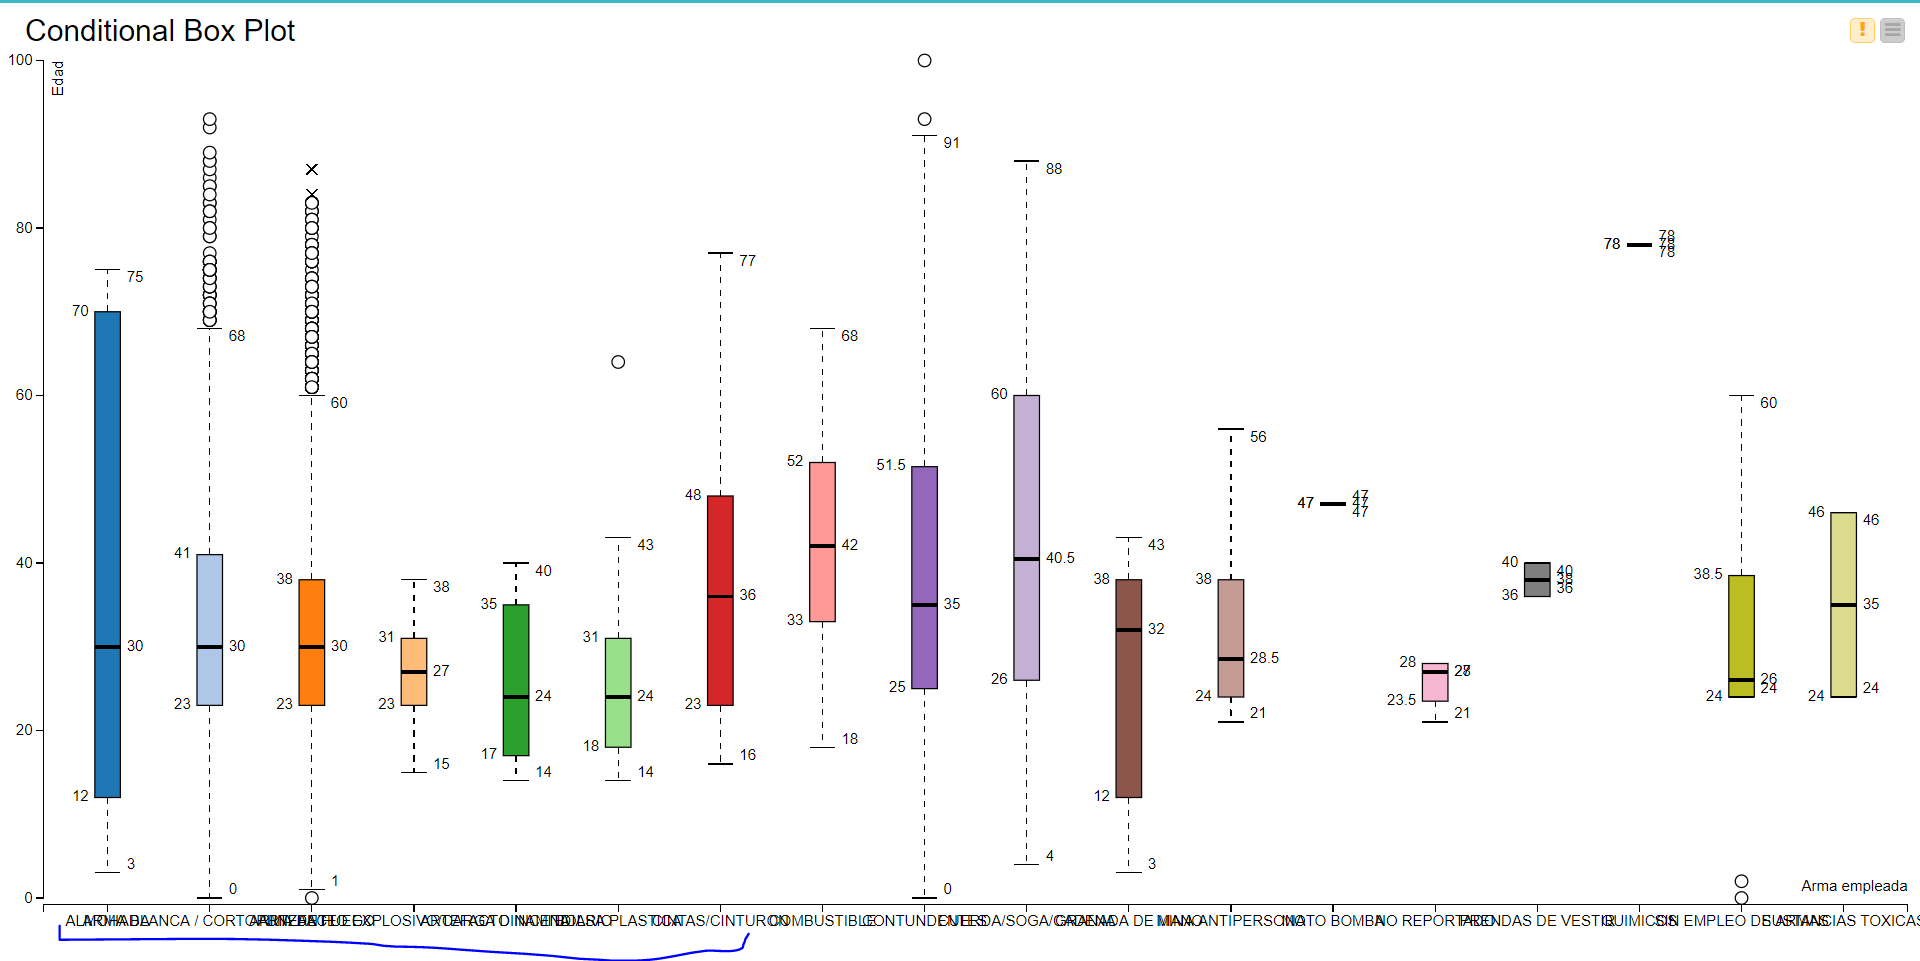
just started working in knime a few months ago, i’m using the conditional box plot over a dataset but i’m having a problem and is that i need to show several categories there and when i see the image that it generates i can’t read the categories. is there any way to fix this ? or to show the categories better ?
here’s a screenshot of the boxplot generated
thanks in advance !