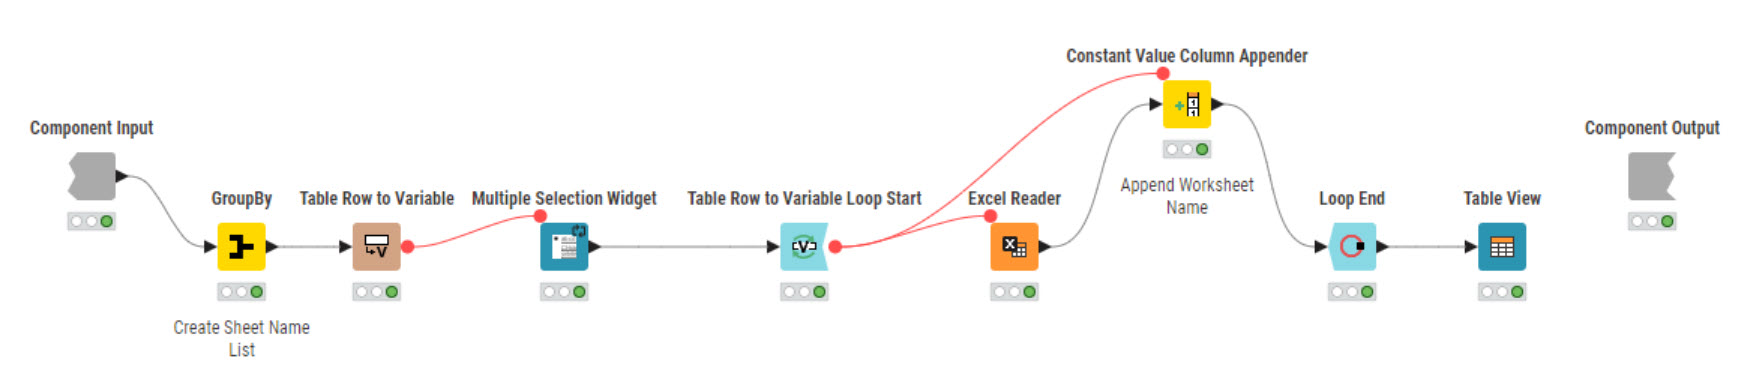
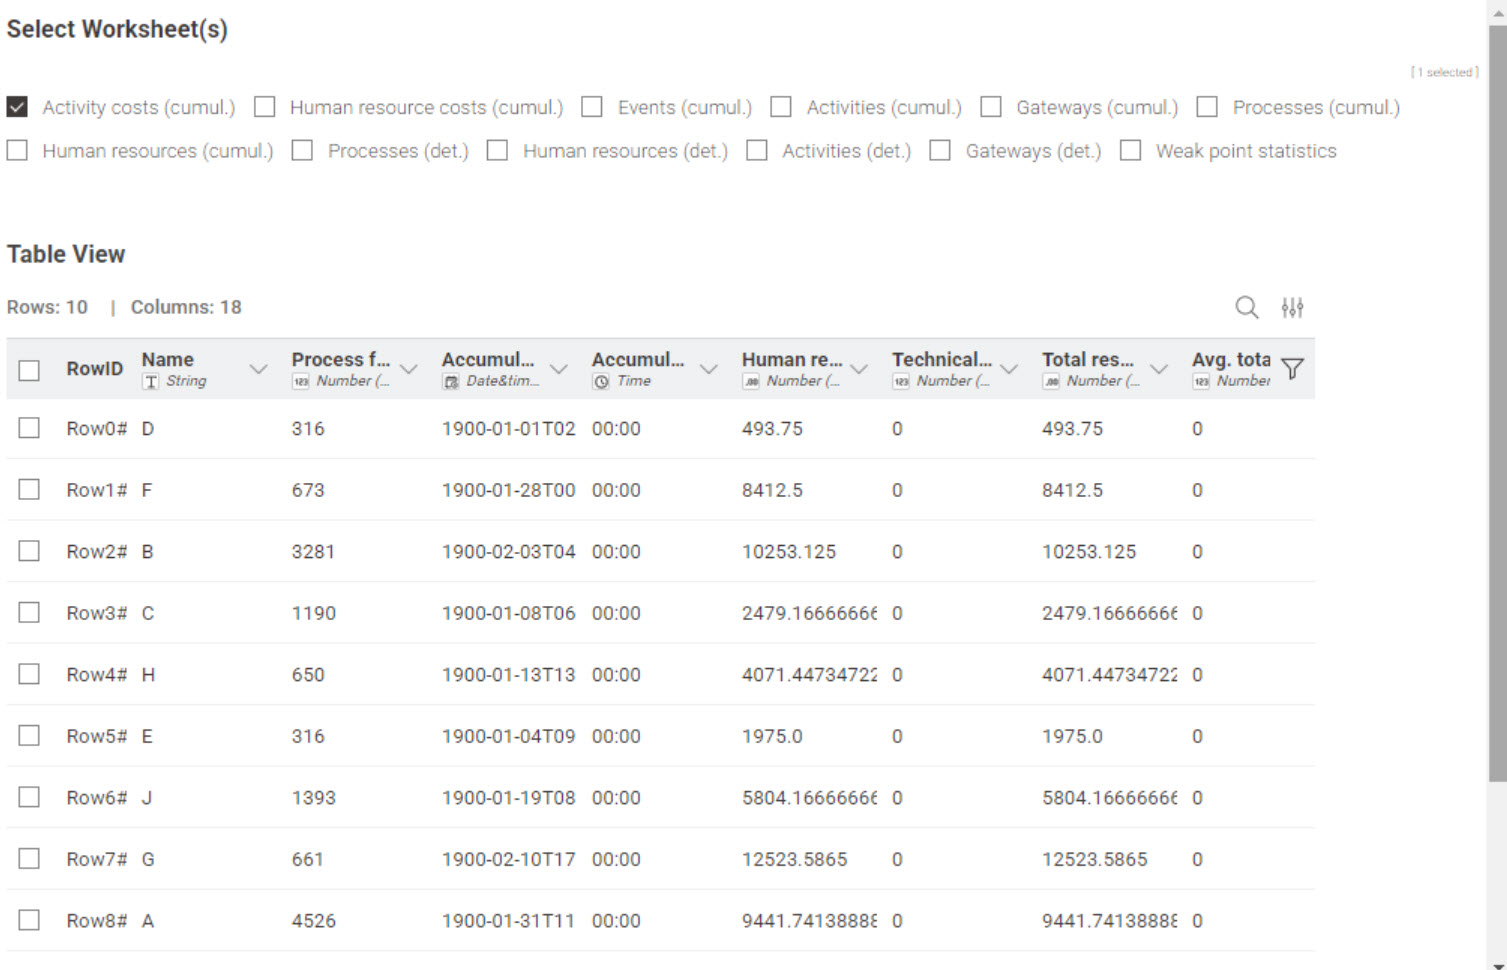
I have the results from a process simulation in an Excel file with multiple tabs (attached) and can load them into KNIME following these instructions: Knime 4.5.1 how to read all sheet in excel - #6 .
However, it now lists all records in one table and I like to do different calculations where I need different infos from one or more tabs. My question now is how I can add the tab name to the results table, so that I can do a simple row filter and have only the content of one tab in a table.
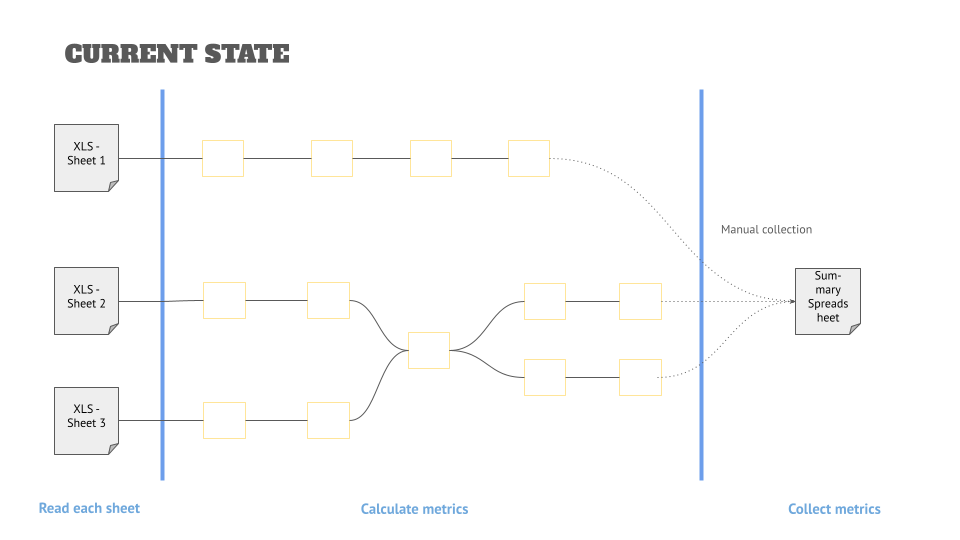
In the past, I did these calculations by using different Excel readers that pointed to the same file but different tabs, but that is inconvenient for a user. It would be better to just ask them to select one file, and it would then split this into multiple tables (and then apply the calculations from there).
an Excel file is called a workbook. and what you call “tabs” are actually worksheets. just adding this to reduce future confusion.
second:
in more or less all cases of input or configuration fields, you have the option to use an existing variable (Flow Variable) or to create a new one by providing a name for it. In the modern UI typically, those flow variables can be accessed by hovering over the config field or by right-clicking the node (at least the last time I used the modern UI, i am still sticking with the now legacy UI).
in the legacy UI, you have a separate tab for flow variables to manage within each node.
the variable itself can then be used e.g. with a constant value node to be added to the table.
Thanks for the prompt reply. Let me give you a bit more (business) background:
I am working in the BPM space, and one of the interesting things—besides process mining—from a data perspective is to do simulation. There are tools out there that will give you spreadsheets like the above, but they are not very user-friendly.
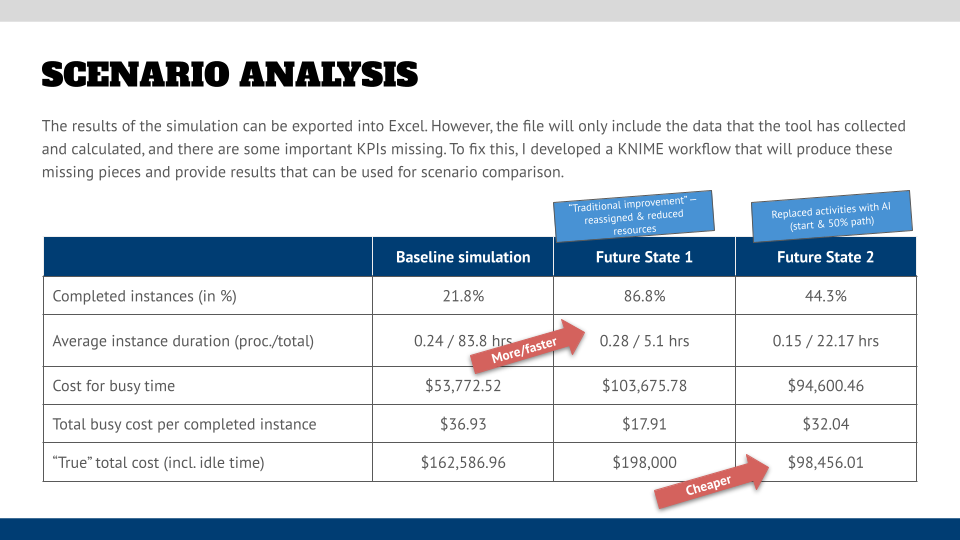
My idea is to take common metrics (some here: Simulation metrics - Google Docs) and calculate them in a KNIME workflow so that the users don’t have to “hunt for themselves,” but things are standardized and easy to use.
The final objective is to create a scenario comparison like the one shown in the graphic below or show the metrics in a dashboard, but for now a simple spreadsheet as the result of the KNIME magic is fine.
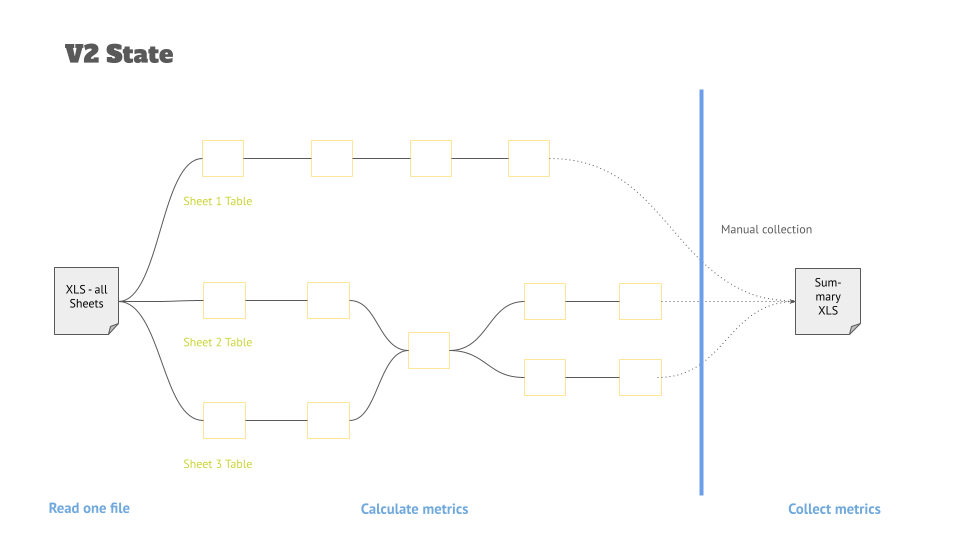
The idea for v2 (and my question above) is to have only one XLS to be connected and then filter by source tab information so that I keep the current calculations but avoid having to select the same file over and over and make mistakes when selecting the sheet in the Excel Reader dialog.