I have already build a workflow that meets my needs, however I’m searching for more elegant solution now.
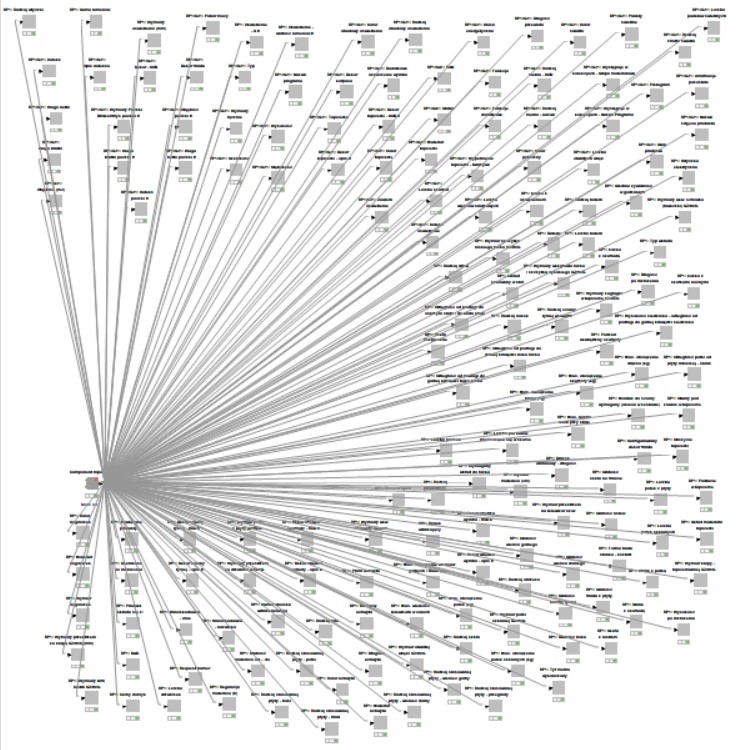
My current workflow contains 200+ such components with identical structure:
There are 200+ product attributes columns among above mentioned 600+ columns.
There is 1 component per each product attribute.
Each component generates report containing selected rows (not important in this description) and a couple of columns with product attributes data (this is important).
List of columns (product attributes) changes for each product attribute.
Number of column in the outcome is dynamic (it means – it varies depending on product attribute specified before)
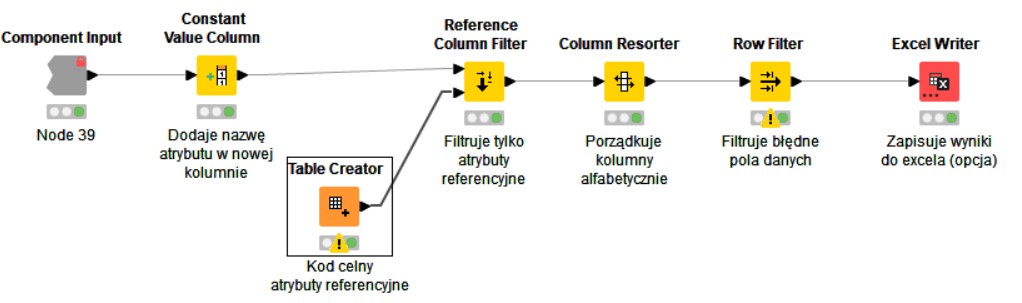
Key functionalities:
Constant Value Column node contains name of attribute the outcome is prepared for.
Table Creator contains list of columns (product attributes) to be used for attribute specified in Constant Value Column.
Question: is there a solution that could:
Let user specify input product attribute (selection from drop-down menu would be the best) as an equivalent of the current Constant Value Creator.
Use a table like this as reference table (200+ product attributes with various composition of columns for each product attribute)?
Simply: instead of 200+ components (portion visible below) I would prefer to have an elegant solution with short workflow covering all dependencies between product attributes and reference columns.
@Kazimierz you could organize your column and data selection maybe with a component. I have an article and video about how to do visualization with python but you can modify this to be used with other output as well. Also check out the additional links at the end.
Also think about using the result from one component as input for the next.
Then you might want to create a sample workflow that would represent your challenge without spelling any secrets. That way the community might be able to solve the core of your problem. Also demonstrate what a desired outcome would be.
Thank you for your prompt response.
It seems I described my goal unclearly. So, let me explain it once again.
First of all, my ‘output’ is 1 data table for each product attribute. Output data contains identified false data fields and all product attributes that are necessary to identify root-cause for false data fields. Output data requires human intervention in the next step. Thus, no special visualization is required.
In the very beginning, I was working with Excel. At that time, scrolling right and left to find appropriate columns, hiding unwanted columns and unhiding wanted ones, and re-doing all these again and again was a nightmare.
Currently, I’m using 1 component per each single product attribute I need to focus on. This gives me 200+ components, what is manageable, however could be improved.
In the future, I would like to use short workflow which interacts with the user (to grab product attribute for which the output should be prepared) and bases on a reference containing list of all product attributes and all those columns that are necessary to prepare the output for each product attribute.
In other words:
There is ‘big’ data table as the input.
There is ‘small’ data table as the output. However, user specifies which product attribute should be showed in output data table, while KNIME ‘knows’ (form reference table) which columns should be associated with product attribute specified by user.
I could use Column Selection Widget to let user select the name of product attribute.
Then I need a multi-line reference table to specify columns that are associated with all available product attributes. Now, I’m using Table Creator to specify columns associated with 1 product attribute, but don’t know how to apply this multi-line concept.
Hey @Kazimierz,
this sounds very interesting, though I am not 100% sure I get what you are trying to do. Could you maybe provide a minimal example with dummy data to show what you try to achieve? Going with the column selection widget to create only the relevant tables sounds like a good idea.
Perhaps incorporate the item code into the associated column names, then select specific items via a widget, then filter the column names by a Regex match with the associated item code? You could also rename the column names to remove the item code before export to clean up the export table presentation.
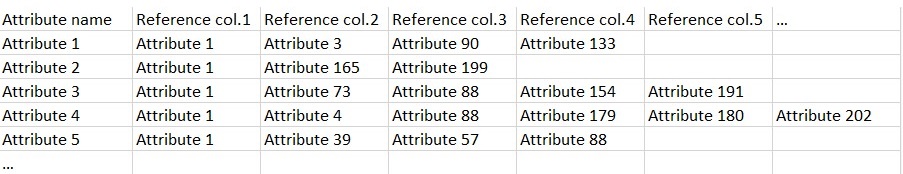
‘Attribute name’ column refers to the product attribute selected by the user (or item selected from the 1st Excel drop-down menu).
‘Reference col.#’ is the set of reference columns for each product attribute. ‘Reference col.1’ is the same for all product attributes in my example as it would contain ID.
Number of reference columns vary per each product attribute.
Mix of reference columns vary per each product attribute.
Currently, my workflow follows such a concept:
if product attribute = x then
apply Column Reference Filter x (with associated Table Creator x).
This means, I’m using 200+ such combinations of nodes, which is not very convenient, but works properly.
@Kazimierz I think such a construct would be possible. Can you provide data that would represent your task so one might build a sample workflow? Best to make the sample so that it would contain the possible quirks that you expect to encounter.
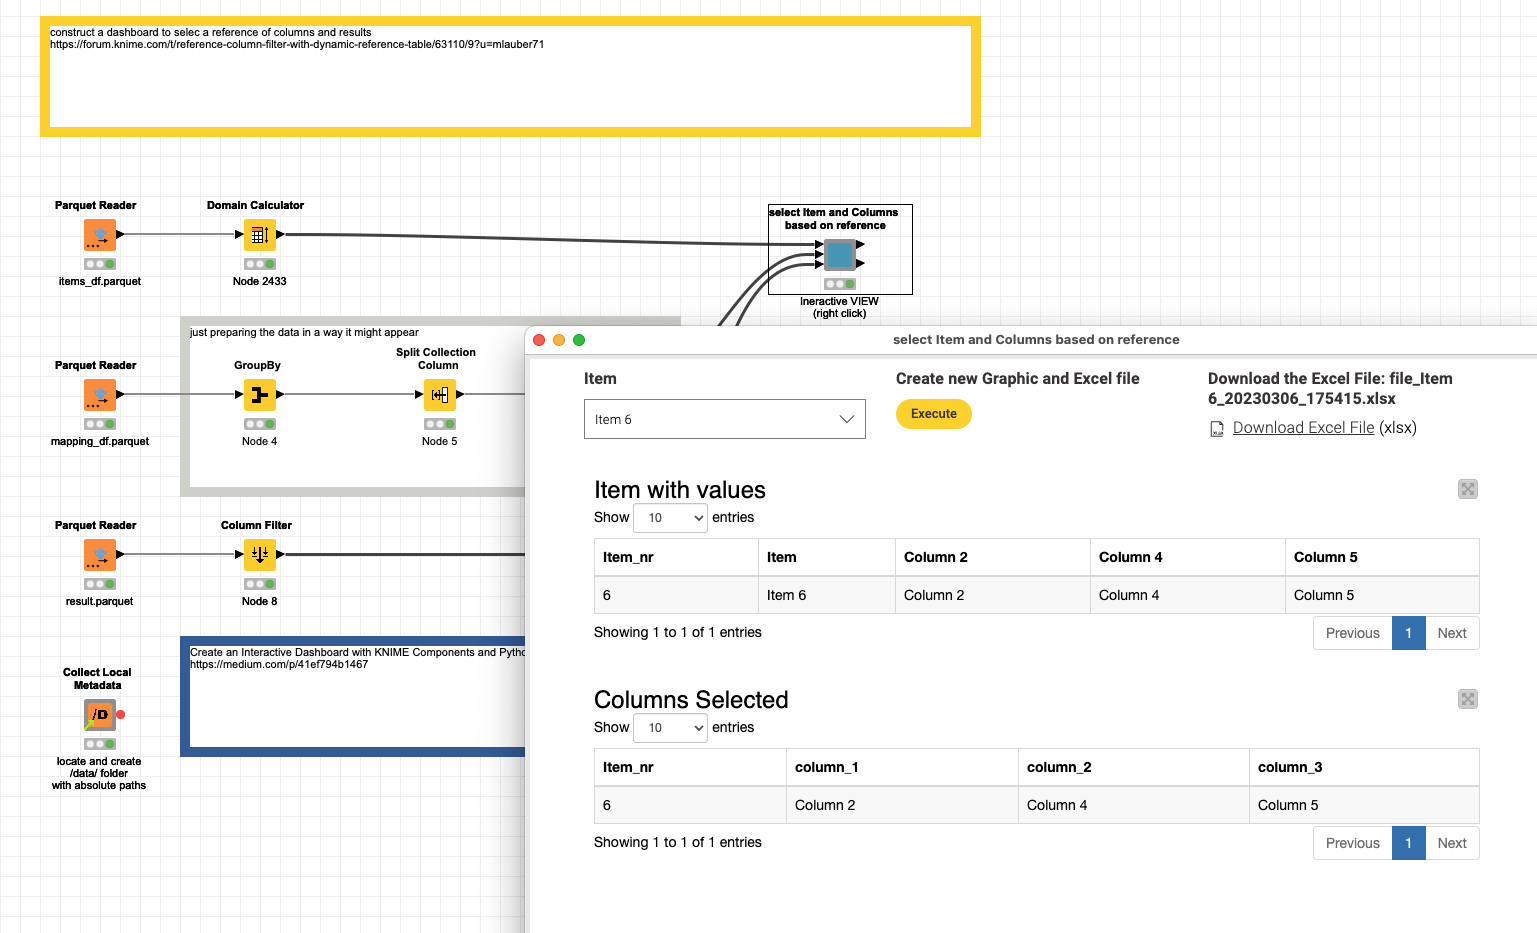
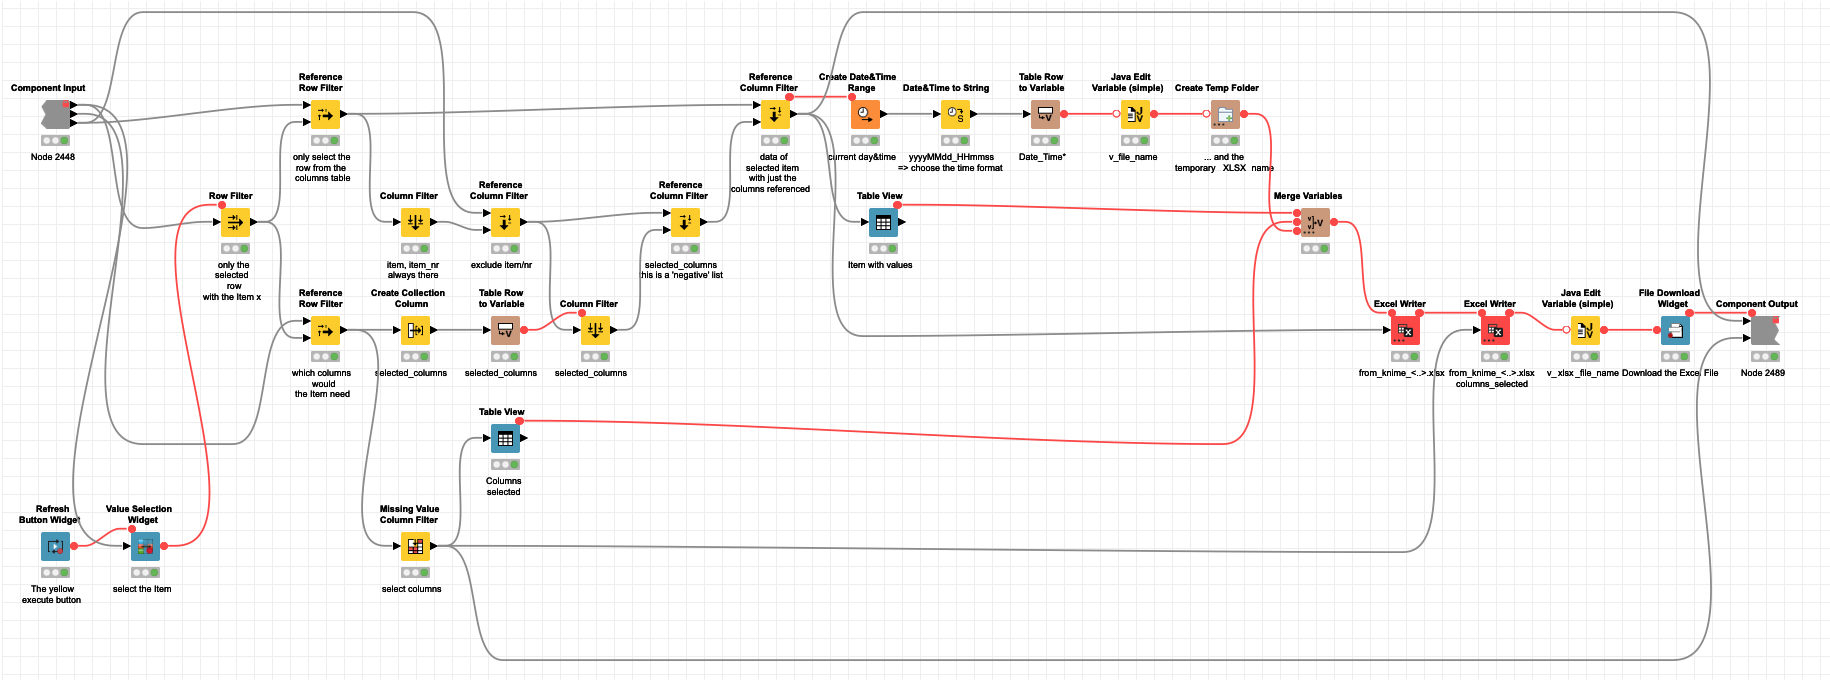
the list of columns belonging to the item are dynamically selected
the basic table is filtered by the Item and only the referenced columns are being selected
When you press the Execute button the select would happen. And an Excel file with the data and the selected columns would be prepared. Also the results will be available further down the stream.
is quite intuitive, even if some nodes are new to me
works
provides the output I was expecting.
The only think I’m not sure how to proceed with is Collect Local Metadata component. It generates links to your local space, dropbox, workspace and forum. How could I updated all those links to my workspace?
Glad you like the workflow. The component can be reset and will then provide a link to the absolute path where the workflow is. You can ignore it if you have other paths.
@mlauber71 One more question: is there any risk connected with replacing parquet inout files with Excel files?
I’ve already read items_df.xlsx (instead of items_df.parquet) and no errors reported. However, I’d prefer to be sure .xlsx will work fine before moving forward with other modifications.
@Kazimierz I only use parquet to transfer data between Python/Jupyter and KNIME - I employed ChatGPT to create the sample data since I was too lazy to do it on my own. The notebook still is in the /data/ folder if you want to check.
Once the data is safely in KNIME (the black triangle ports) it does not matter what import you used. Excel though quite common is also sometimes not the best format to store data