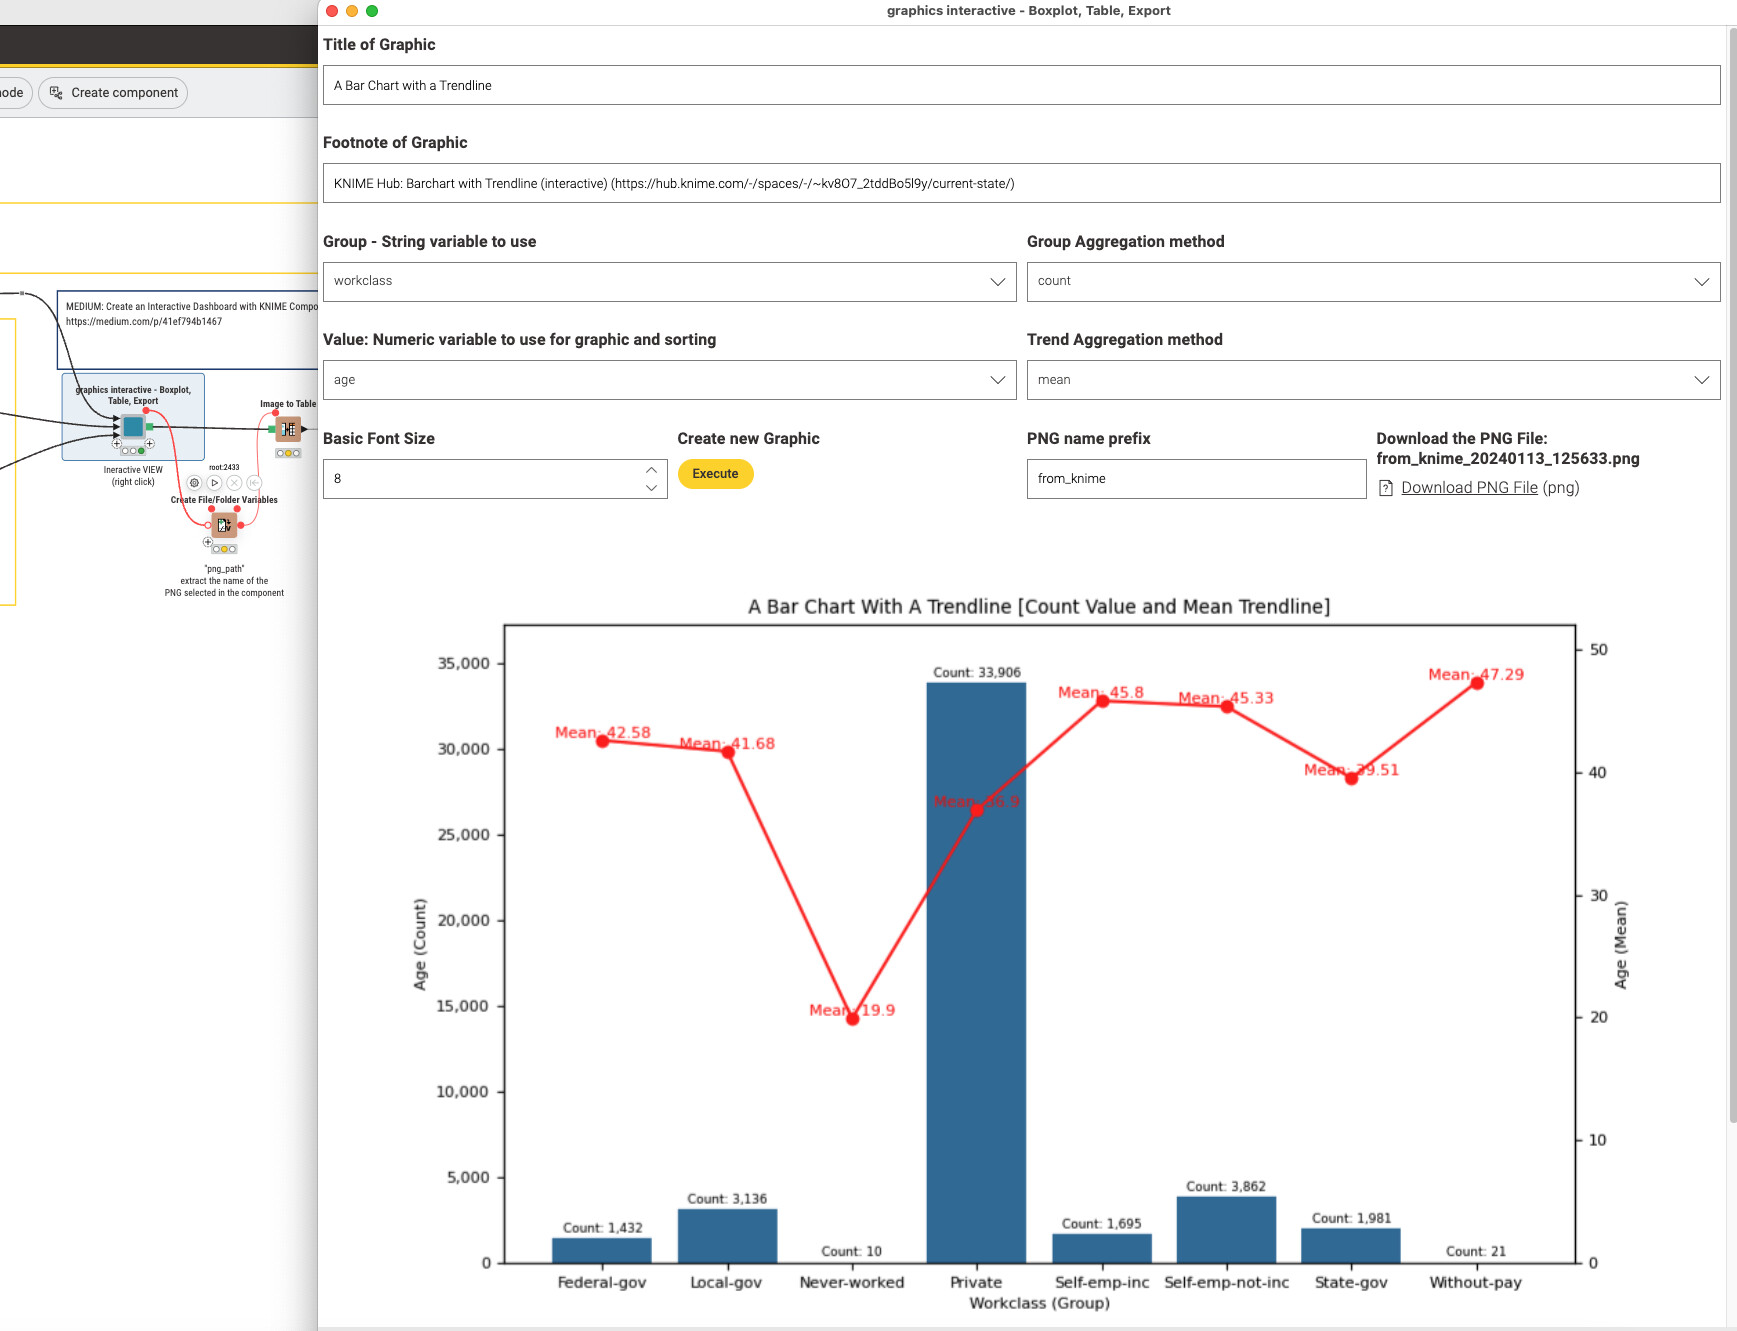
@olambert I use ChatGPT and KNIME Components to create an interactive tool to present a numeric value on two different axis split by a categorical one. The results will be displayed and can also be saved as PNG files.
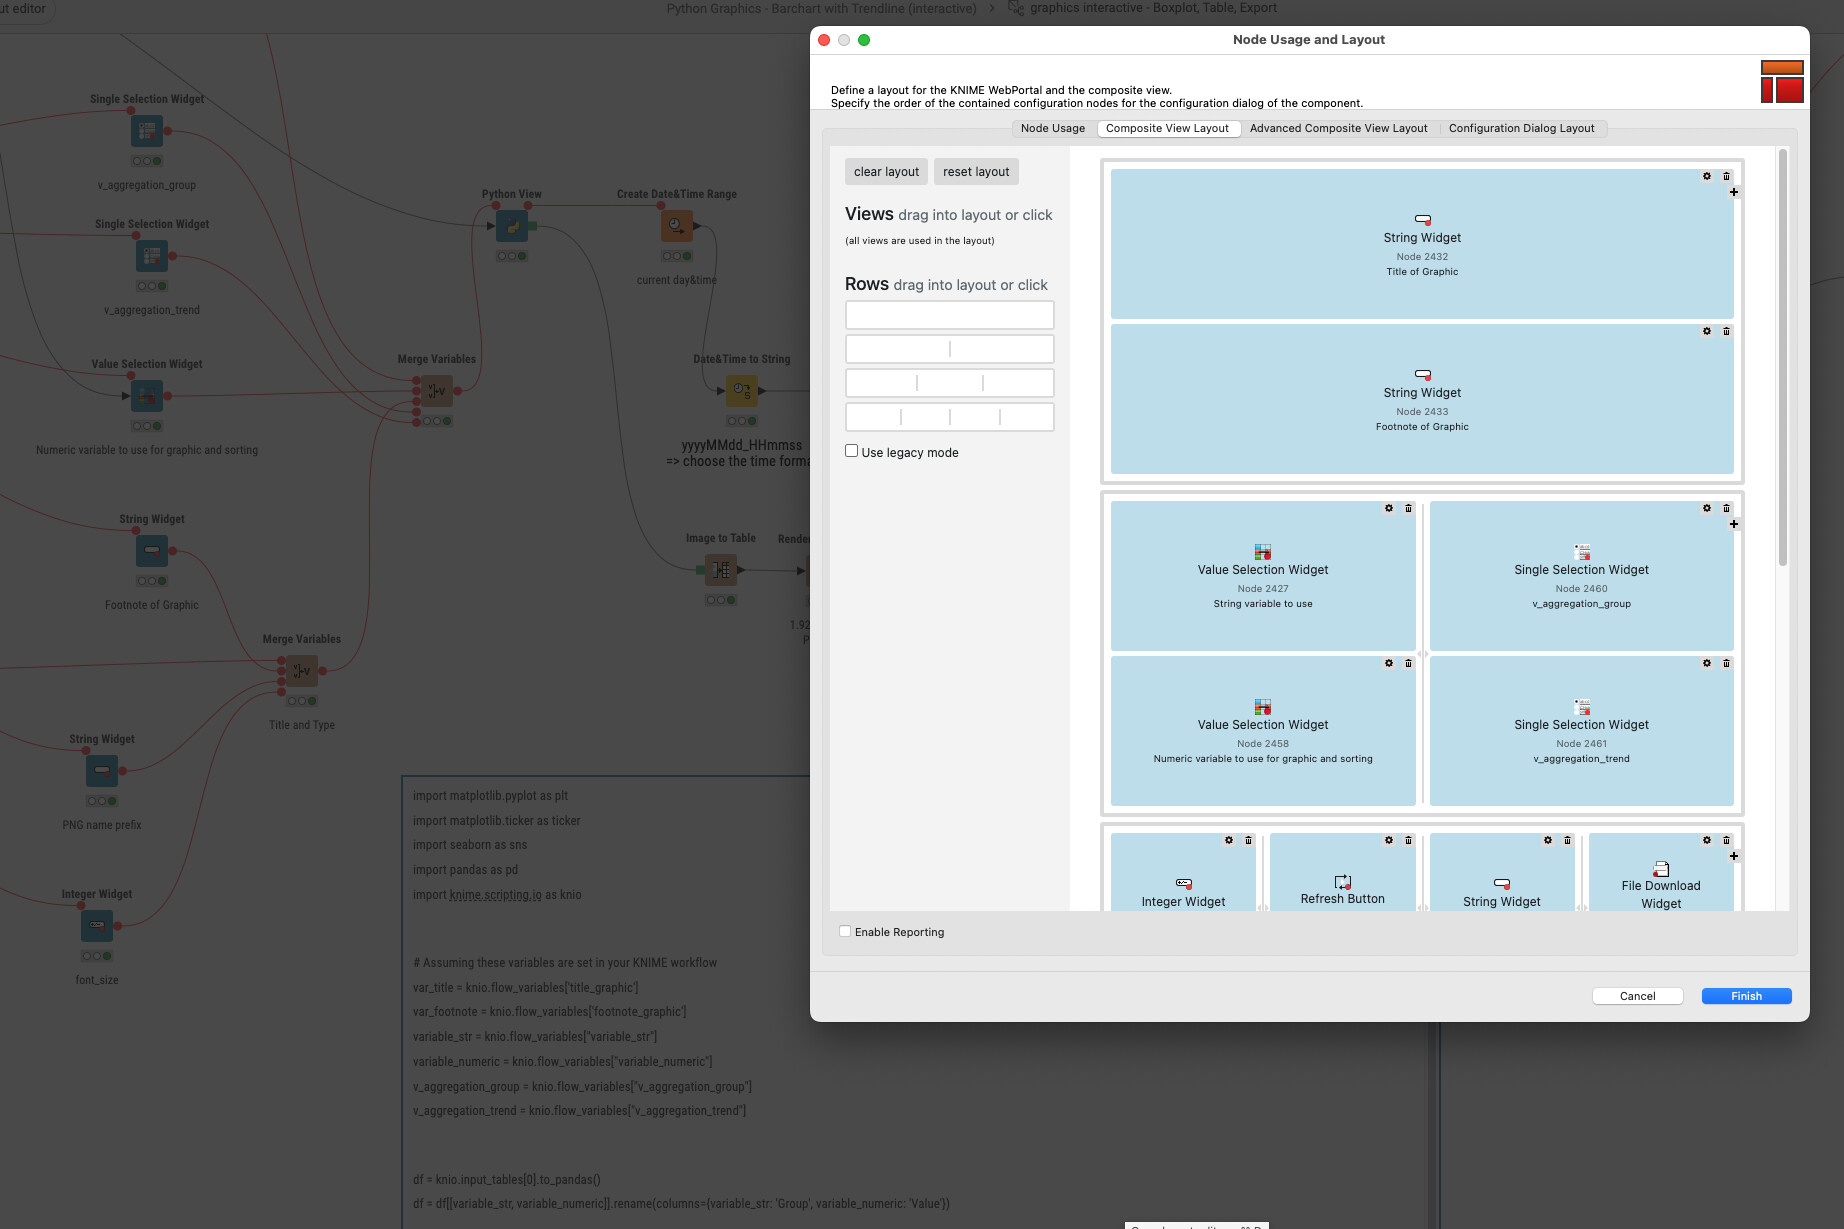
The Python View node is configured with Widgets and the Refresh Button allows for interactive use.
Python Graphics - Barchart with Trendline (interactive).knwf (594.3 KB)