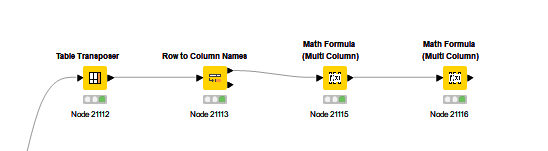
I’ve tried various loops and row filters, including rule based, and just cannot get this to work.
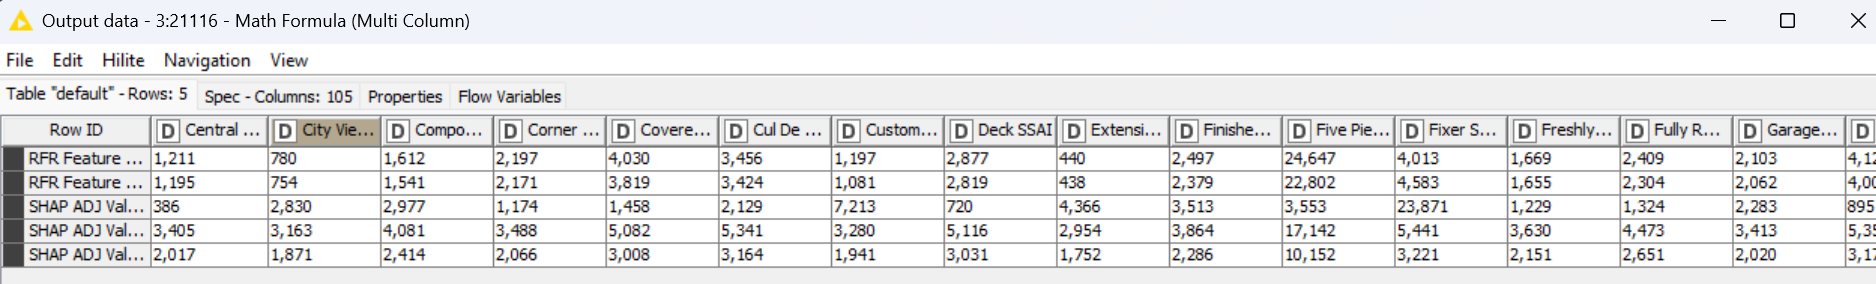
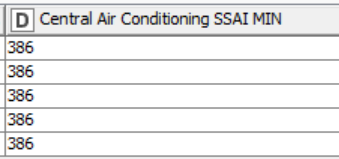
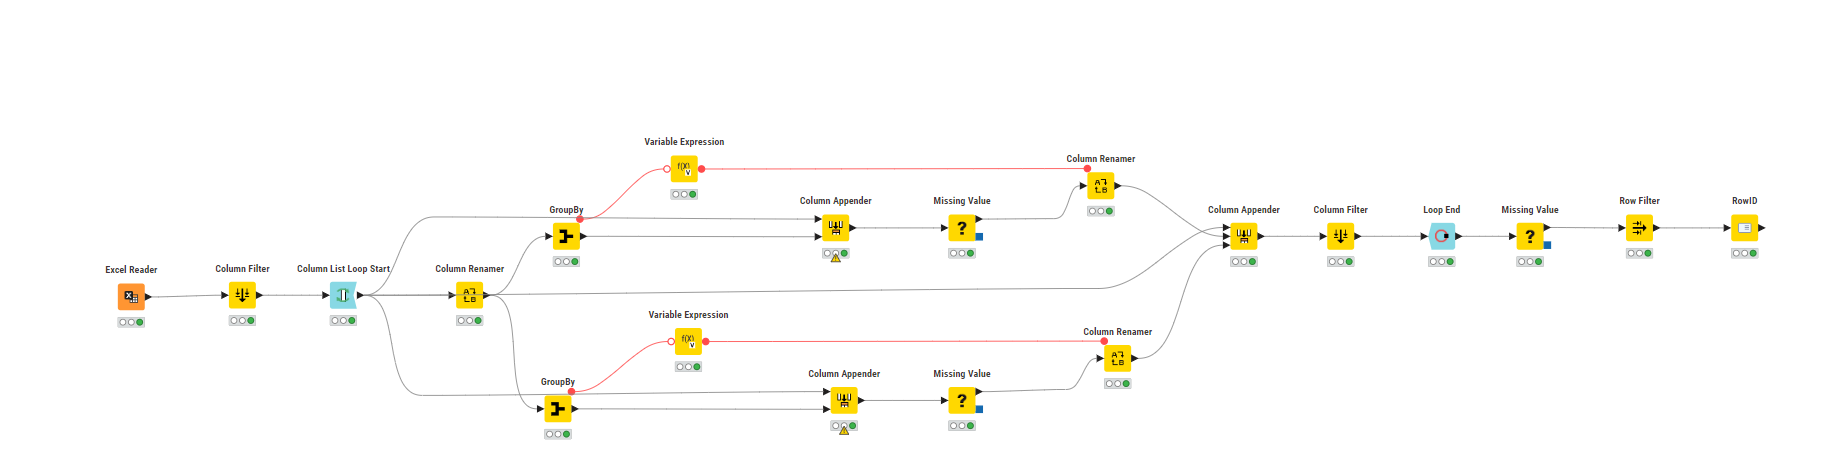
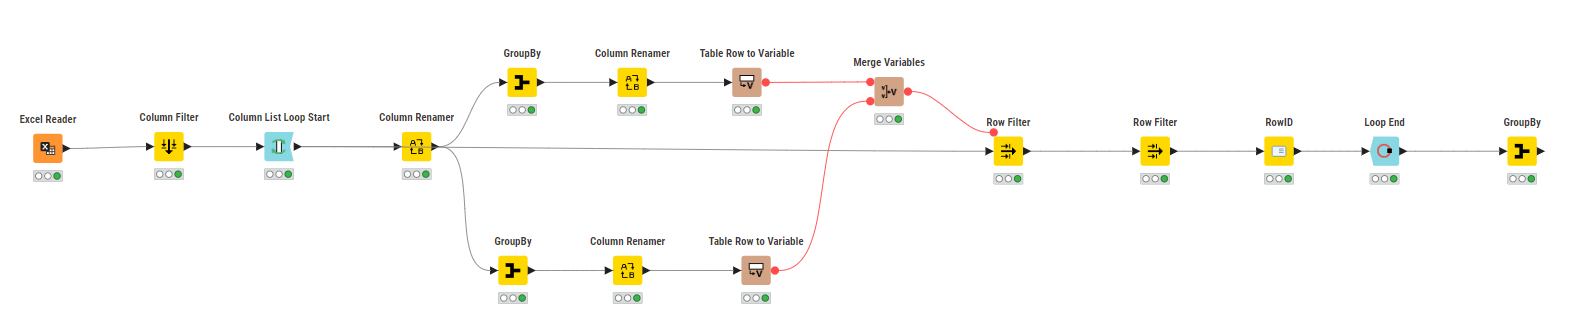
I have a series of columns, each with five values in rows, and wish to remove the MIN and MAX value rows within each column. I thought Group Loop would do it (as each column has separate MIN MAX values), and this works with Math Formula to derive the MIN MAX, but I can’t make the Rule Base Row Filter to remove the MIN MAX rows within the loop.
Then I want to match up to the primary column the MIN and MAX derived values and remove those rows–I’m assuming within a loop, as every primary column has completely different MIN MAX values.
Attached is the data in excel format prior to the MIN MAX calculations. temp.xlsx (5.2 KB)
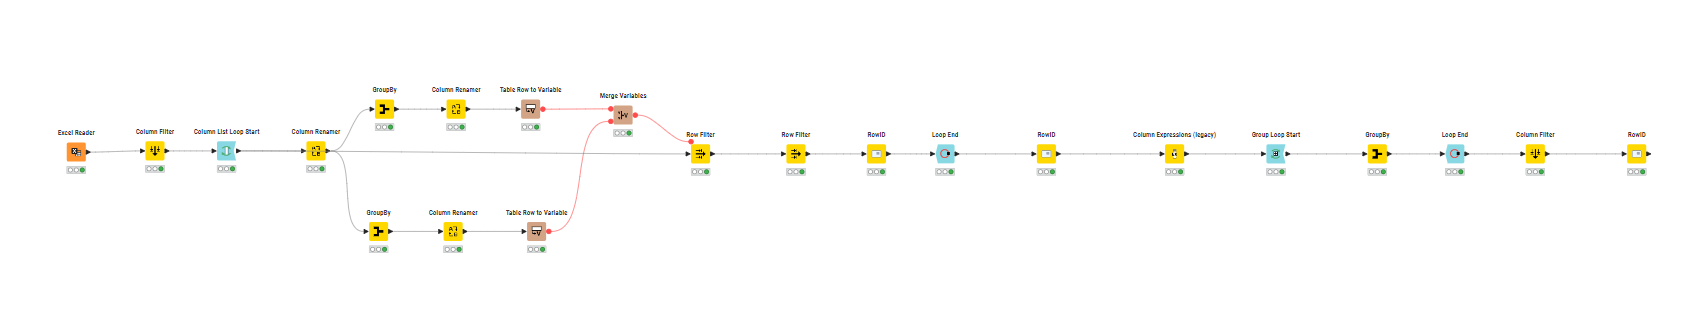
@prashant7526 I easily got your workflow to run, but I was hoping to remove the MIN and MAX rows within each primary column.
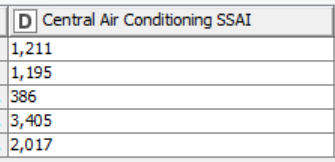
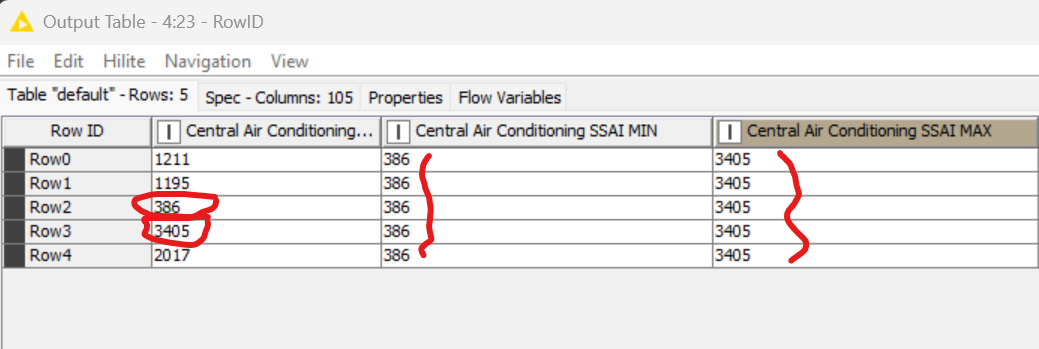
i.e.: So, after deriving the 386 MIN and the 3405 MAX I would remove those two rows in the first (primary) column. Then continue to do so using this system for every primary column.
@creedssmith Maybe you might wanna inform @prashant7526 which column(s) is/are “primary” and which aren’t so they can help you better.
Also, if you’re using the min and max as some kind of range boundaries in order to keep only row values that fit into that range, the approach might be way simpler than you’d imagine.
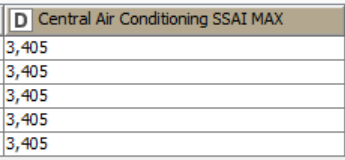
@badger101@prashant7526 “Primary” are the columns not designated as either MIN or Max in the header, (ie: Central Air Conditioning vs Central Air Conditioning MIN, Central Air Conditioning MAX.
As far as purpose, I wish to remove the MIN MAX rows (outliers) then derive the MEAN of the column with the remaining data rows. Of the five rows within each column, I’ve notice no pattern as to which typically hold the MIN MAX values. So any kind of simple row filter won’t work, and again, I’m thinking some kind of loop is needed to compare the three columns, then move to the next series for the same analysis. Thanks!