After upgrading to KNIME Analytics Platform 4 (currently 4.0.2) I started experiencing an AWT deadlock that is reported to the log with thread dump following it.
2019-11-26 13:58:10,236 DEBUG MemoryAlertSystem Memory threshold of 87% exceeded
2019-11-26 13:58:10,251 DEBUG MemoryAlertSystem 0/0 listeners have been removed, 0 are remaining
2019-11-26 13:59:11,852 DEBUG MemoryAlertSystem Estimated tenured gen heap space usage below threshold (87%), currently 78% (3.11GB/4.00GB)
2019-11-26 14:01:55,860 DEBUG MemoryAlertSystem Memory threshold of 87% exceeded
2019-11-26 14:01:55,930 DEBUG MemoryAlertSystem 0/0 listeners have been removed, 0 are remaining
2019-11-26 14:01:56,219 DEBUG KNIMEApplication$4 Potential deadlock in AWT Event Queue detected. Full thread dump will follow as debug output.
2019-11-26 14:01:56,219 DEBUG KNIMEApplication$4 onditionObject@59d93b26
This usually occurs while a workflow is processing larger tables of about a few million on lower tens of million records. Please note I didn’t configure my nodes with “keep tables in memory” option and I even configured my KNIME with -Dknime.table.cache=SMALL added to the knime.ini file. Xmx option is set to 4G.
I run my workflows on MacBook with 16GB RAM but I’ve experienced the same behaviour on Windows 10 laptop with 8GB RAM too. KNIME consumes about 5,5GB RAM while running the workflow. IDE is responsive on Mac whereas often or fully irresponsive on Windows.
When this happens, what do you see happening in the UI? (I see you say generally responsive on macOS, so no spinning beachball and continued repainting and response to mouse movements? On Windows, does the application stop repainting, or ?)
Also, i noticed the detection of deadlocks coincided with GC - how much RAM are you allotting to KNIME? As a one off experiment, what happens if you increase that by several GB and run KNIME again - do you still get the deadlock warnings?
Hi @quaeler, thanks for your reply.
Well, it differs. I’d like to correct what I wrote about Mac. Sometimes I experience everything OK just a bit slower on mac, Sometimes it got stuck. Those running indicators close to active nodes stop moving, for instance, I can see the rotating ball, but the OS doesn’t complain about the application doesn’t respond. Windows, on the other hand, complains immediately the app appears irresponsive.
I’m running KNIME with 4GB RAM. I will try increasing it and will get back to you.
What really scares me is that I keep experiencing this, including Java heap space Out Of Memory Error in the end, while KNIME is processing nodes configured with “write data to disk”. Right now I have CASE Switch Data (End) node with one active and one inactive input branches, processing 27M-rows table. The node’s memory policy is “wirte data to disk” and I can’t get over the node. So is that true memory consumption and thus a likelihood of an Out of Memory Error while nodes like this are being processed is in direct proportion to the size of the table?
I tried increasing RAM using Xmx=6G in knime.ini. Of course, KNIME has been restarted subsequently.
The workflow has been running at night. I found it failed in the morning. I could see Java Heap Space error in the CASE Switch Data (End) which has been processing 27M rows table at the time it failed. I’m attaching my log. KNIME_AWT_EQ_DeadLock.2.log.zip (191.5 KB)
Hmm… well, if there’s any helpful news to be found, it’s that the deadlocks in that log also appear to be coinciding with GC. My bailiwick isn’t the modern-time changes to the way memory is handled with the tables - i’ll see if i can get someone who was to chime in here :- /
I think what’s going on is that memory becomes increasingly scarce and your JVM is spending more and more CPU cycles on garbage collection and less and less cycles on doing actual work. Based on your log, at some point, memory becomes low enough such that the (usually concurrent) garbage collector decides to do full stop-the-world garbage collects. This leads to freezes in the UI of KNIME Analytics Platform and can lead to the debug message “Potential deadlock in AWT Event Queue detected”, which you are experiencing.
Apart from table caching, the reason for high memory usage can come from the utilized nodes themselves. In particular, the Reference Row Filter, Reference Row Splitter, and Joiner nodes that all appear in your log shortly before the OutOfMemoryError, can all have a very high memory footprint (even if you’ve configured them to “Write tables to disc”).
Since you have added the line -Dknime.table.cache=SMALL to your knime.ini, table caching in KNIME 4.0 should behave similar to KNIME 3.7 and earlier. If anything, it’ll use less memory, since, if nodes are configured to “keep only small tables in memory”, it’ll by default only keep tables with 5,000 cells in memory, whereas previously it kept tables with 100,000 cells in memory. In your log, I see some message “Writing 376061 rows in order to free memory”, which certainly shouldn’t happen if you’ve set your table caching strategy to SMALL and the node configuration to “keep only small tables in memory” or “write tables to disk”. Did you by any chance put some line starting with “-Dorg.knime.container.cellsinmemory=”
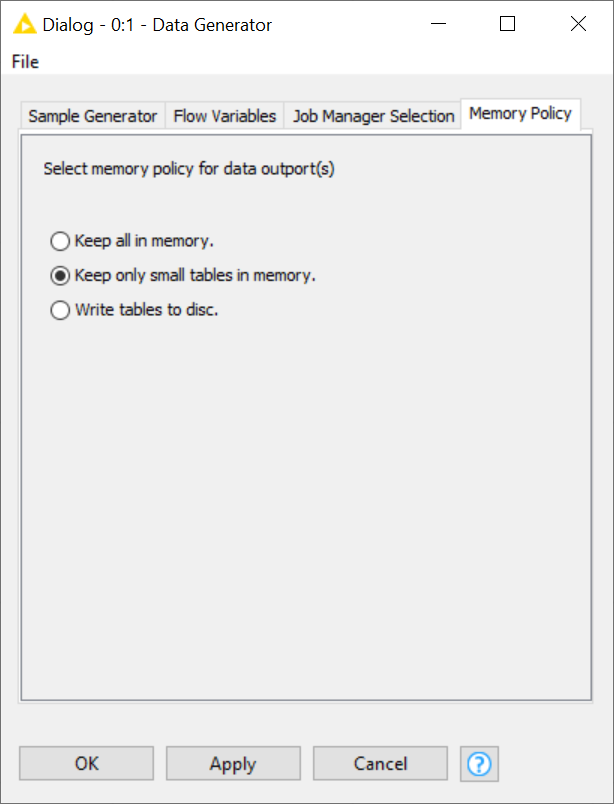
into your knime.ini? If not, can you confirm that (1) you’re memory policy dialog in the node configutation looks like the one below and you haven’t set any node to “keep all in memory”?
Can you also confirm again that you’ve run the workflow on KNIME 4.0.2? The reason why I’m asking is that from the log I see that you’re using the Reference Row Filter and Reference Row Splitter nodes. Both these nodes assemble the reference to filter against in memory. This set grows with the size of the reference table and can cause an OutOfMemoryError. KNIME 4.0.2 introduced a fix such that these nodes are able to flush their reference to disk if memory gets low.
Yes, your explanation of what’s going on makes sense. As a Java programmer, I’m aware of the stuff about the garbage collector and you’re right this is the way JVM behaves when the GC cycle release insufficient amount of memory.
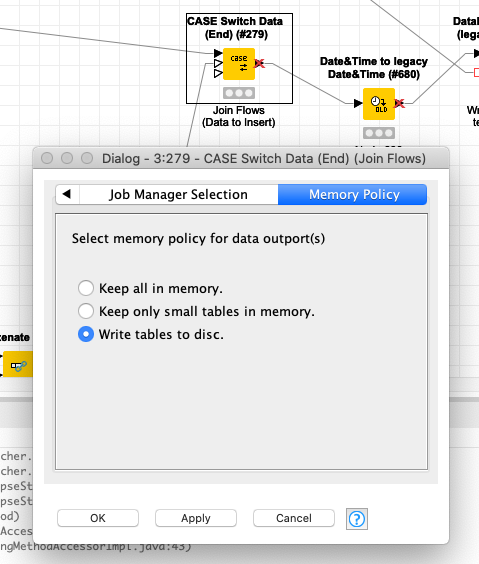
Well, we’re talking about CASE Switch Data (End) 0:279. I’ve checked its Memory Policy. It’s set to Write table to disc.
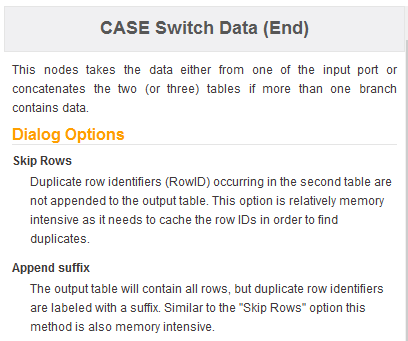
It turns out the Case Switch Data (END) node is also one of the few nodes that, for large input tables, require a considerable amount of main memory (more precisely, required memory is linear to the size of input data). The node configuration already hints at that:
To detect duplicate row keys among the tables at its input ports, which it attempts to append, it maintains a set of row keys which it has already encountered. The size of this set in memory increases with the length of the input tables and the length of the row keys. Unfortunately, setting the node to “Write tables to disk” has no effect here, since this setting only affects the memory policy for the tables generated at the node’s output ports.
The reason you’re seeing an OutOfMemoryError now whereas previously you wouldn’t could be that KNIME 4.0 allocates more of its available memory to cached tables (at the output ports of other nodes). What I can tell you is that the upcoming minor release of KNIME Analytics Platform will improve upon that by allowing the garbage collector to collect tables earlier and more aggressively should memory become scarce.
Independently of that, I think we should improve the Case Switch Data (END) node in two ways:
It should simply forward its input if only one of its three inputs contains data.
If memory becomes scarce while the node is assembling the set of row keys, it should make use of some fallback strategy with a non-linear memory footprint.
I’ve created tickets for these improvements in our internal ticketing system.