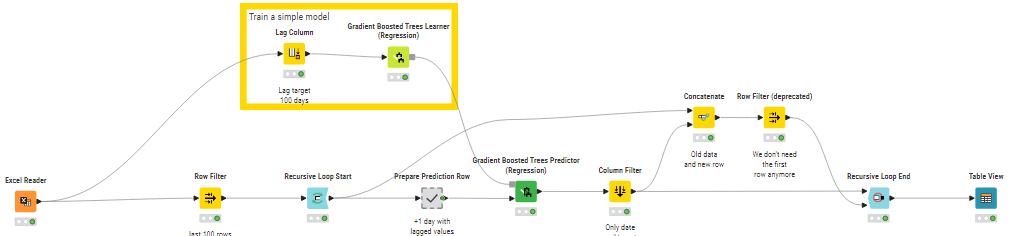
Thanks to @alexanderfillbrunnRolling Time Series Predictions workflow, I was able to predict new values based on past values.I have also slightly adjusted the workflow to use Gradient Boost predicition (regression) instead of polynomial.
However,
My current use case : finding out future Mbps values based on past values for different cell IDs.
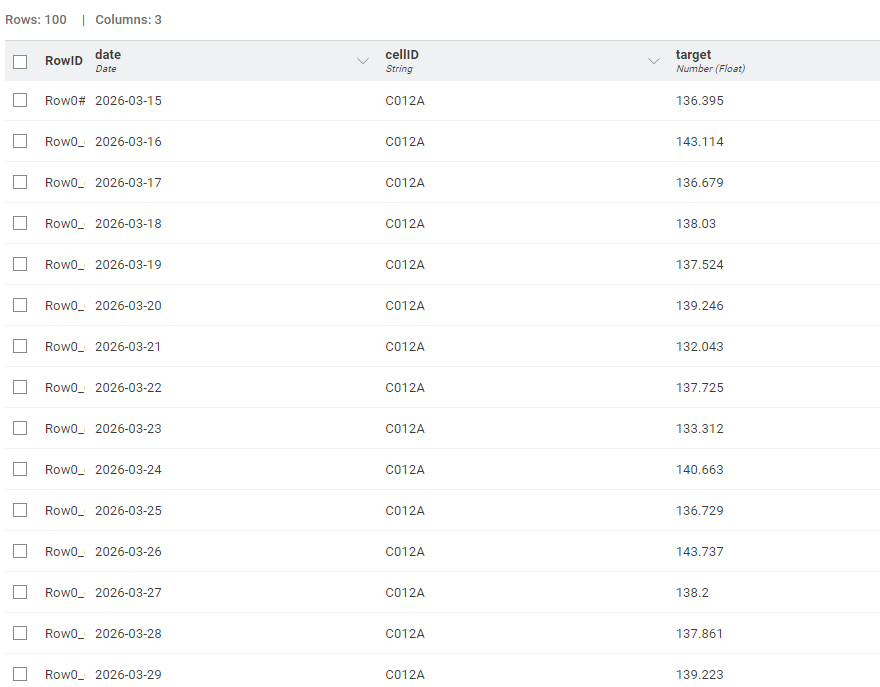
Problem: no matter how long I put the lag, I’m still getting the predicition for the last cellID i have in my input excel sheet.
Attached is the a snapshot of output i’m recieving plus my workflow.
I think I understand your problem now. As-is, the workflow does not take into account your cell IDs at all. It just takes the whole table and treats it as one big time series. What you actually want is to treat every set of rows with the same cell ID as one time series, and train a model to predict the next values for each cell ID individually. Is that right?
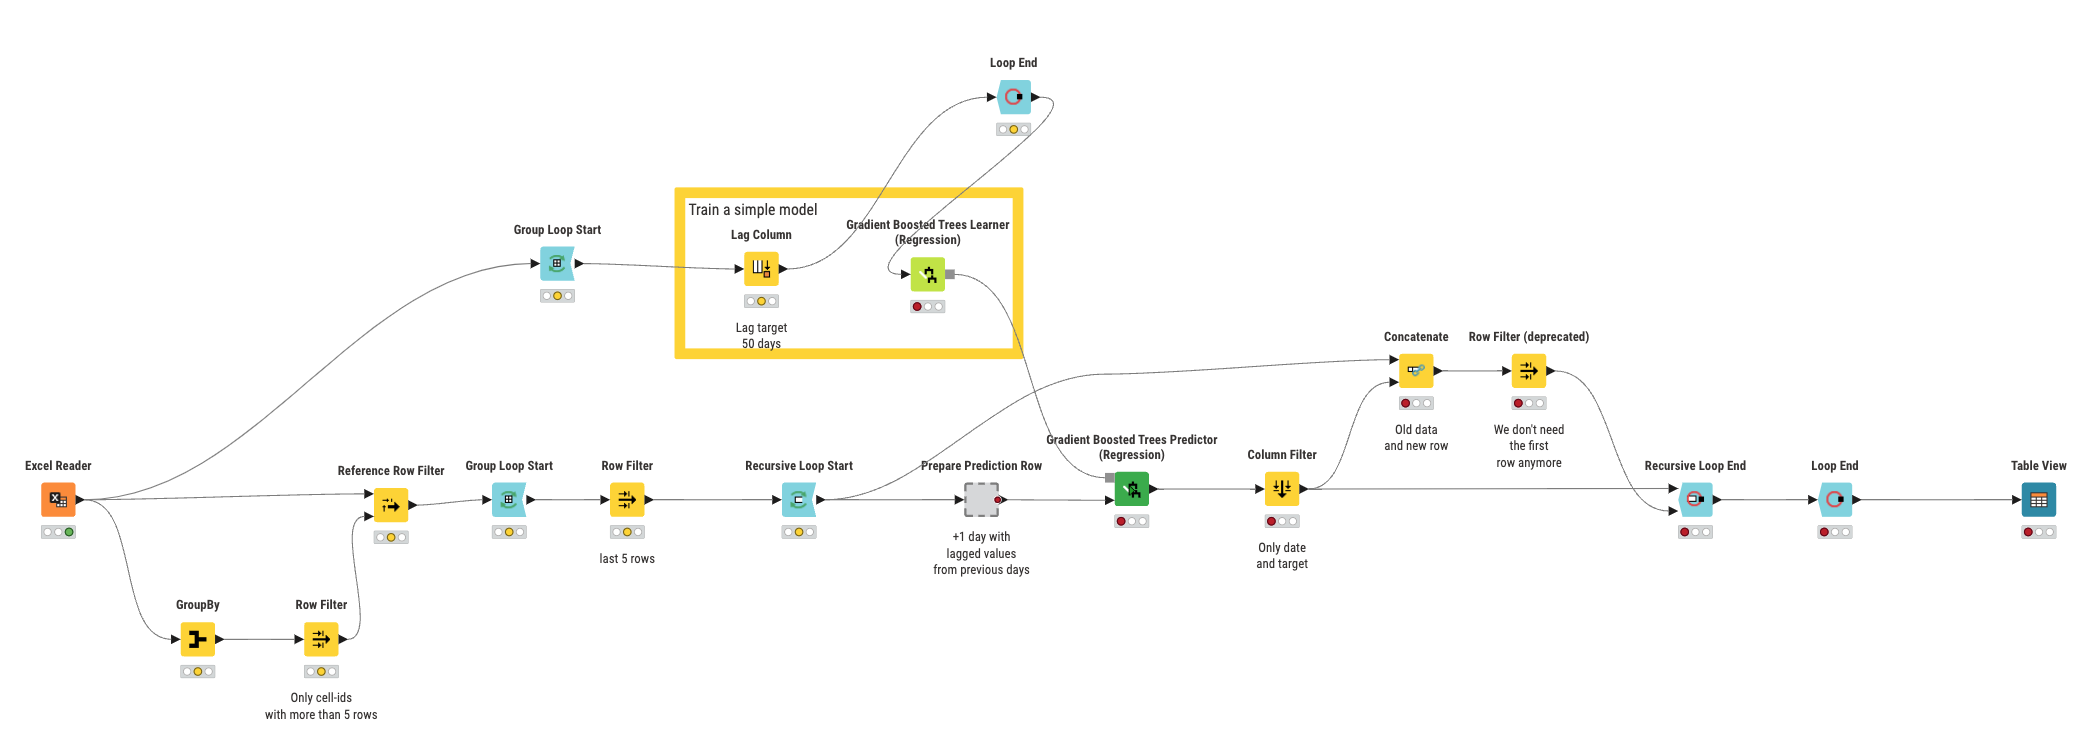
Right now, your workflow does not take into account the cell ID. This is why you only get the last one. Please have a look at the attached workflow. I changed the window size to 5 instead of 50, because any cell ID with fewer values than the window size cannot be processed. Even with a value of 5, some cell IDs have too few values and I filtered them out at the beginning.
I use a Group Loop to generate the lag per cell ID before training the model so there is no “bleed over” between cell IDs. Then I also have a Group Loop for the actual prediction so I can predict per cell ID.
Many thanks Alexander, it surely worked! Sorry for the late reply as i’m still doing some troubleshooting to the workflow.
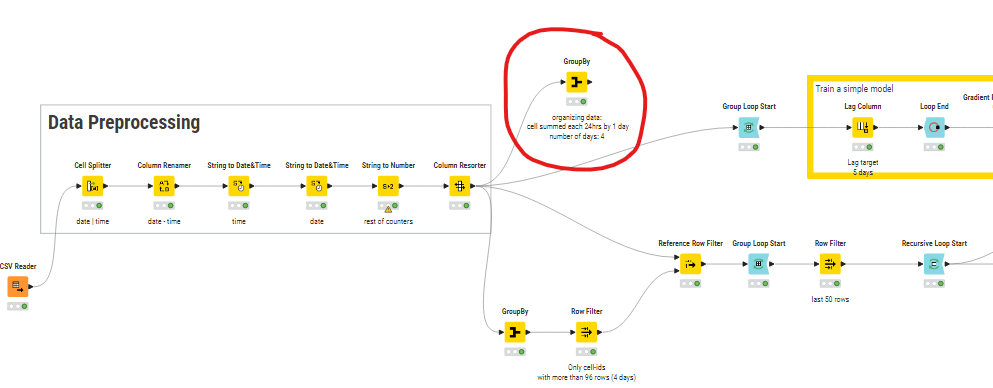
I’m missing the following: the several rows of each cell_ID in my case are hours, this means each 24 rows make a day.
I have data for 4 days , so what i’ve done is making the window size 96 (24 hours x 4 days) instead of 5, filtering out cell_IDs less than the window size.
I predicted 5 days, but the predicted values are not convincing. Am I missing something here? Maybe sum rows per day before processing them?
Here’s the workflow I’m working on, the data file should also be there. Thanks again!
I think I found the solution, we have to sum each 24 rows (hours) per day for each cell_ID before sending the table to the training model just like the snapshot below.
However, the numbers don’t match, to clarify:
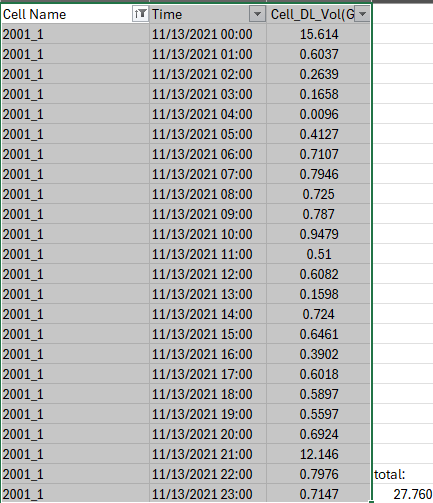
cell_ID 2001_1 has 24 rows per day –> by using GrouBy node to sum up the targeted values , it gave me 126,738 for 2021-11-13 (snapshot below)
this number is different from when you sum them in the original input folder.