Hi y’all,
I have a question about the following case! About my knowledge.
I am a Knime beginner.
I have already come a long way with a workflow but am now faced with a problem. The goal of my workflow is to display a price trend for certain products in a product group based on sales figures for a year.
To do this, I need to add a row filter, but I’m just not getting anywhere. The current table already shows the product, product group, month and year correctly.
Now I want to add a filter that only shows the products that were purchased in each month or at least in 9 out of 12 months.
How can I do this?
Thanks for any help!
René
Hey Rene,
In general this sounds like a task that should be solvable in different ways in KNIME.
If your column with dates is of type Local Date e.g. using this node should make it fairly easy:
Is it possible to provide some made up example data that still reflects your data structure? With that more specific help can be given 
1 Like
Hey Martin,
thanks for your support!
Please find attached a screenshot of the example datas. As you can see, some of these products have been bought only in January but others are bought in January and February or January, February and March.
I only need the products that have been bought at least in two months.
Thanks again!
All the best
René
I see.
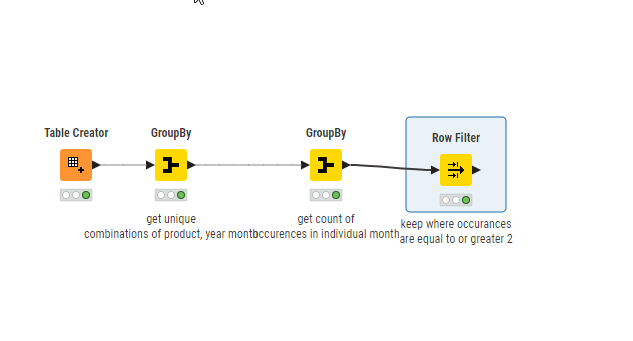
In that case you want to use e.g. Group By node:
First get individual combinations of product, year, month
Then add another group by group year and product and count the individual month
Then use row filter for equal or greater than two:
Workflow with some dummy data to illustrate the concept
grpbyproducts.knwf (77.8 KB)
:
1 Like
