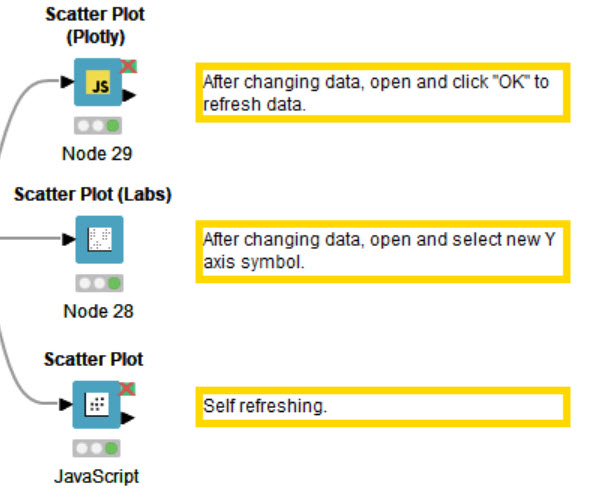
I’ve built a workflow which retrieves data from FRED (St. Louis Fed Federal Reserve Eonomic Data.) The end product is a scatter plot of the data. The workflow executes fine, but if I use the Plotly or Labs scatter plot nodes, both have to manually reset if I re-execute with a different data set. The JavaScript scatter plot automatically resets itself with the new data. Anyone know why this is?
Thank you so for much for posting your query here. Is there a sample workflow that you can share to investigate this issue? It is running smoothly at my end.
Also a couple of things to note:
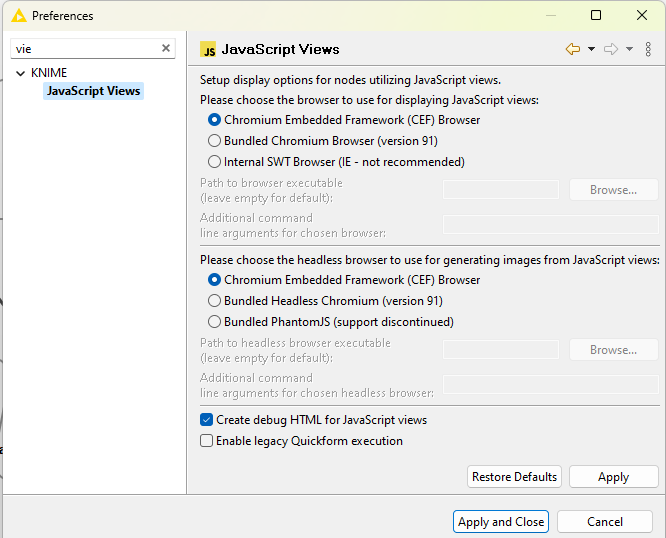
Toggling choice of browser to view the output chart can possibly solve the issue.
Also nodes in KNIME Labs are yet to be matured. What you just mentioned in your query is the kind of feedback we need to mature both Plotly and Labs node. However, a suitable workflow explaining the issue would help a lot
I have my JavaScript displays set as you suggested. The workflow is in my Public Hub folder - “FRED Data Files Public”. You’ll need to reset the file paths for it to work for you locally. Detailed instructions are included in the workflow.