Hallo everyone,
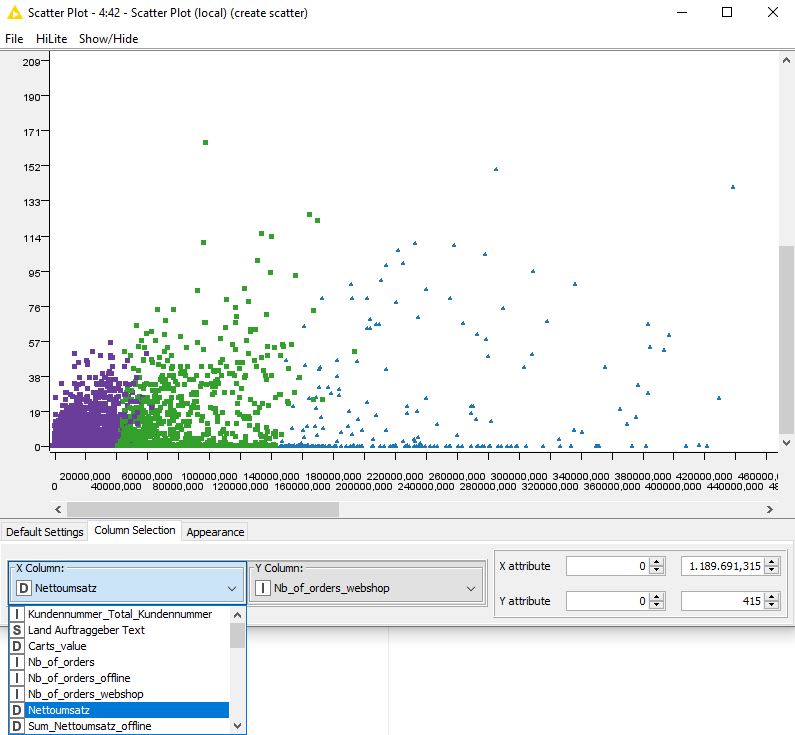
I am working with the standard Scatter Plot (local) to analyze some data. As I got a few dimensions in my data, I have several options of combinations (see screenshot)
E.g. I want to compare turnover on x with number of orders on y.
Or I want to compare number of users on x with number of service cases on y.
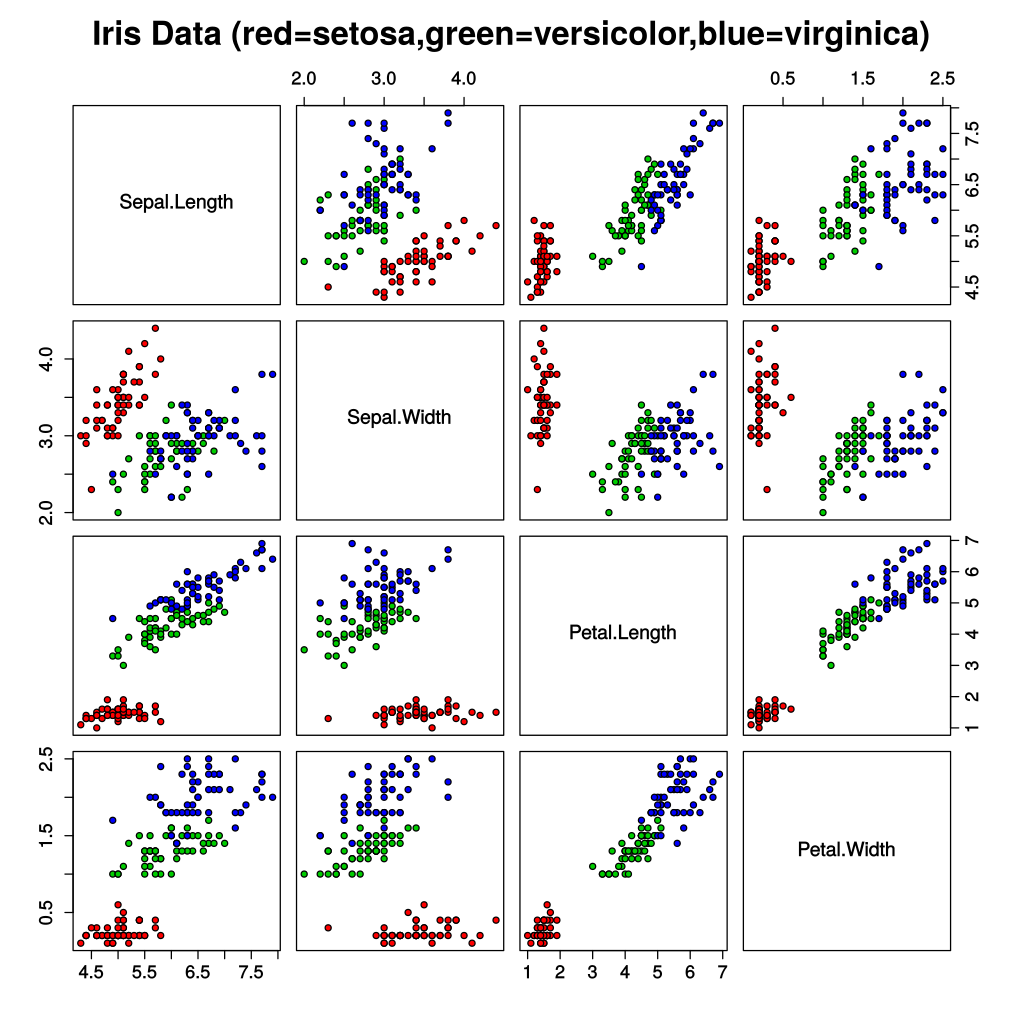
I found pictures where the tool (Might be matlab?) shows all of the possible combinations on one view (see screenshot). I would also be happy if I could print all combinations in n jpg-files and click through them.
Someone an idea how I could work smarter?
Thank you in advance and best regards
Mark
