I am trying to apply a personal scheme of colors in the Conditional Box Plot without success.
My goal is to have each box plot in the same color as my clusterized data, defined by me using RGB information on Color Manager node.
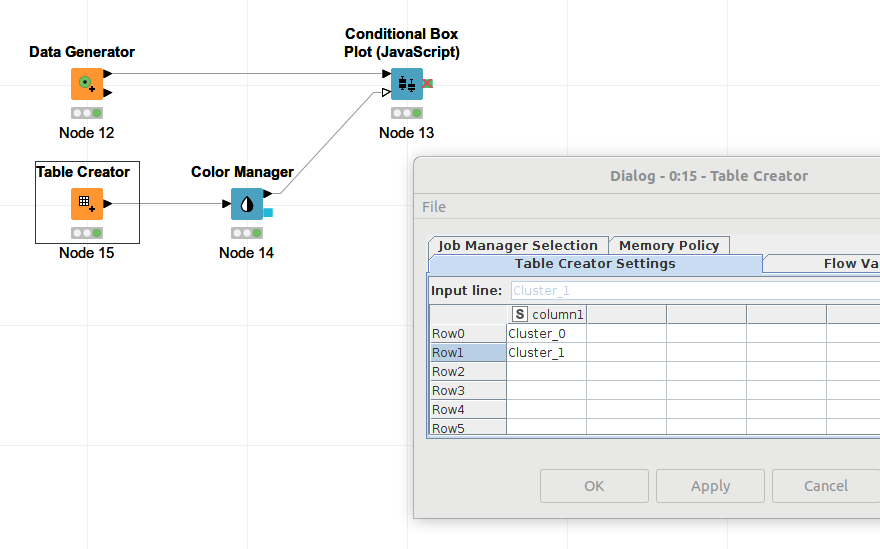
The second input port of Conditional Box Plot should accept a table containing the colors information:
“Data table containing the category names with colors applied. (optional)”
Moreover, in the dialog box there is an explanation about the color option:
Apply colors by category
Check to apply a color scheme to the boxes by category. The colors can be defined as a table with a single column which contains the category names and color settings applied accordingly.
If the table with desired color scheme is not provided, a standard color scheme will be used.
However, I could not figure out how to pass this information to the node. I tried a few of options using Extract Color / Table Creator / Color Appender but without reaching my goal.
Can anyone help me on that?
Thank you!