Hi @HenryJohns -
Have you tried using the new Plotly nodes in KNIME 4.0? The Line Plot (Plotly) node should be able to do what you describe.
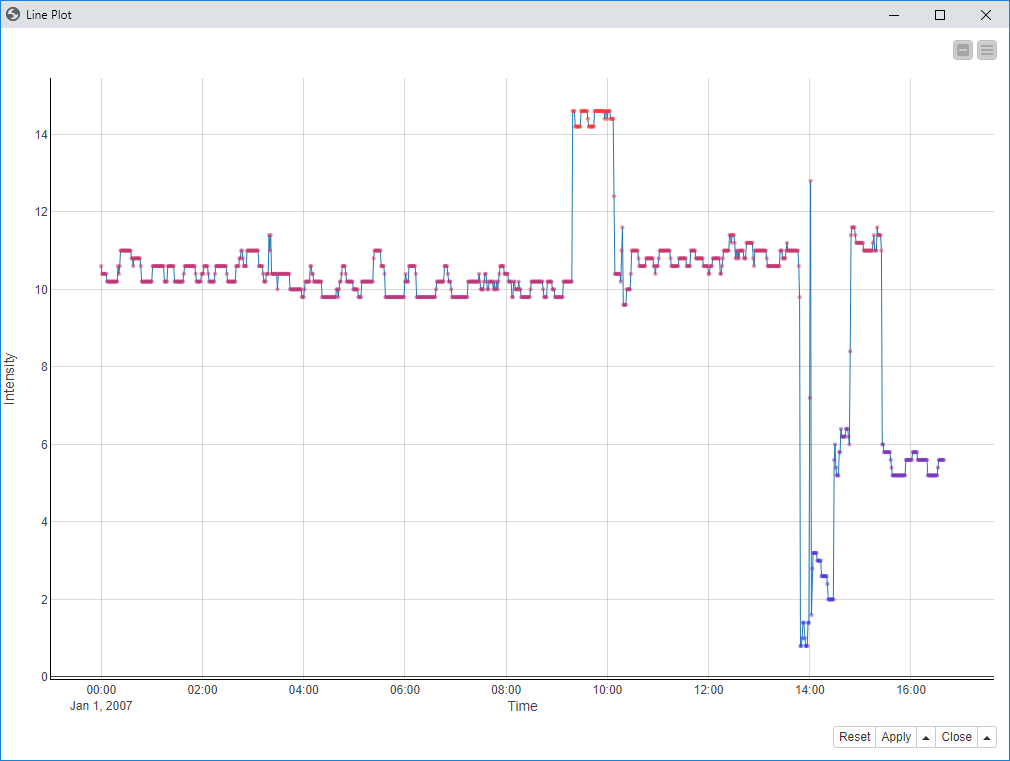
Here I generated a plot where lower values are indicated in blue, higher values in red using a preceding Color Manager node.