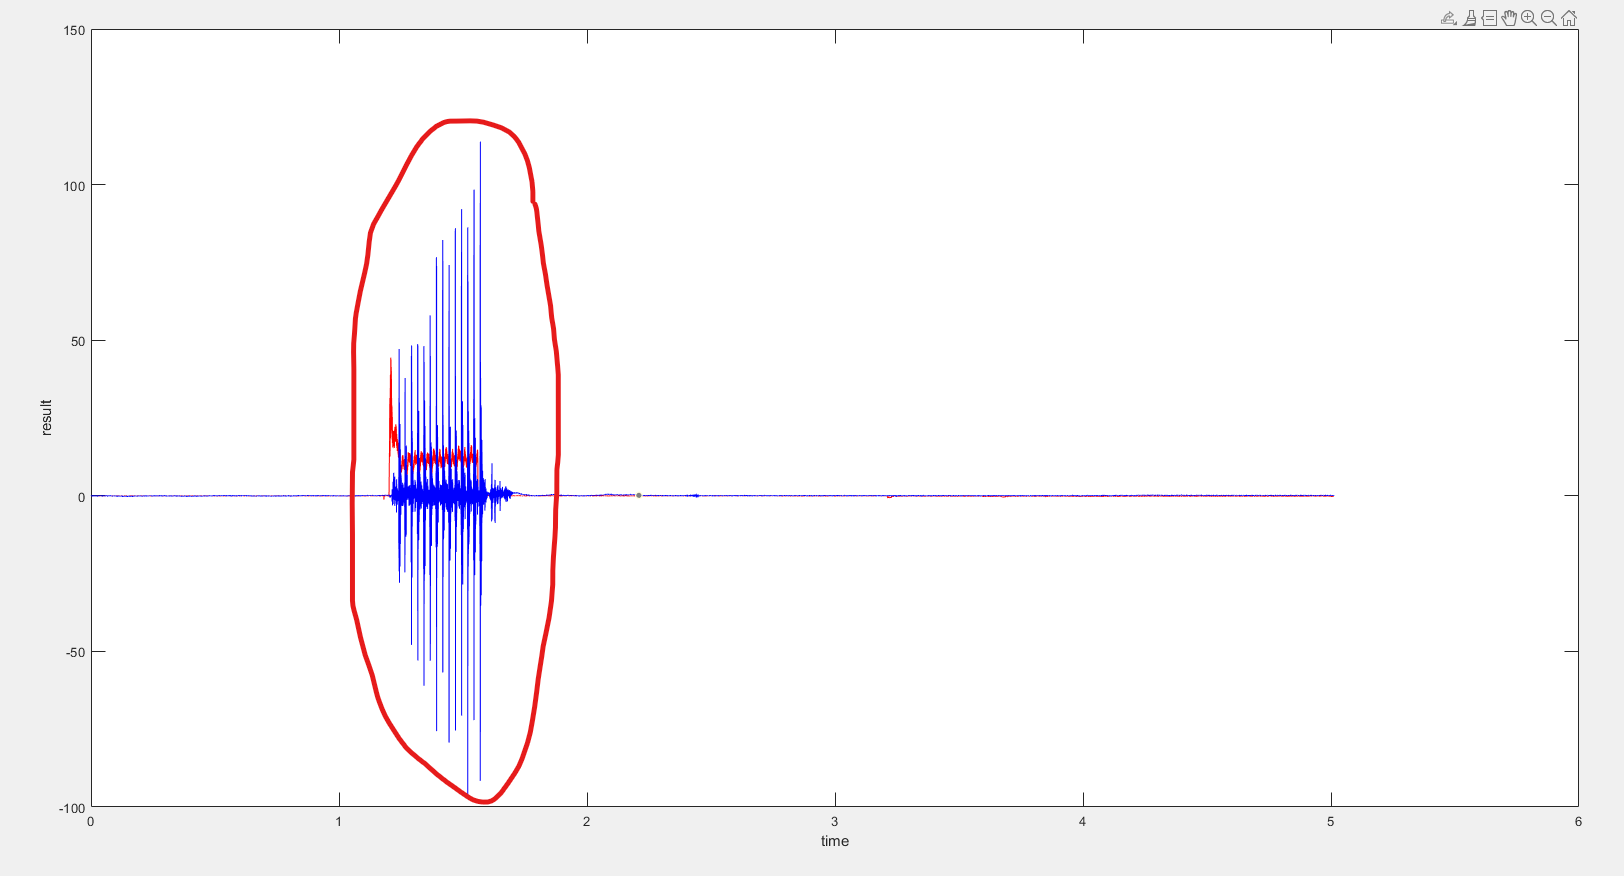
Hi, I have a signal but I just want the part that I circled in red as shown in the picture. I need to obtain some useful information from the signal such as mean, standard deviation, peak value and etc. Can I obtain the information using KNIME? Can anyone show me how to do it?
Thanks for your information. I still have questions.
I have different sets of data which is similar to this and the signal that I want which is circled in red may occur at different time interval in other sets of data. How can I remove the unwanted signal to obtain the signal in the red circle?