I have a data set that contains 100 000 rows and 120 columns. Data in the table are grouped together based on the “id”. For each group, I would like to calculate and extract the most similar results between measured and exact values (similarity should be based on two columns; “mass” and “count”. At the end I should end up with one row for each group that is the most similar to the exact data.
I tried to use the group loop following with similarity check however my results are pretty messed up.
Is there anyone who could help me out with this task? 111.xlsx (9.2 KB)
@Amanda252 to be honest I was not able to follow your description based on your example. Maybe you try again with a clear description using the exact column names in your examples and show us what the initial data is and what the expected outcome and why that is.
Sorry for my poor explanation. Every group is composed of two pairs; 'exact mass & exact count" is one pair AND “measured mass & measured count” is the second pair.
I am looking for a way to find (in each group) the most similar pair. 111.xlsx (9.5 KB)
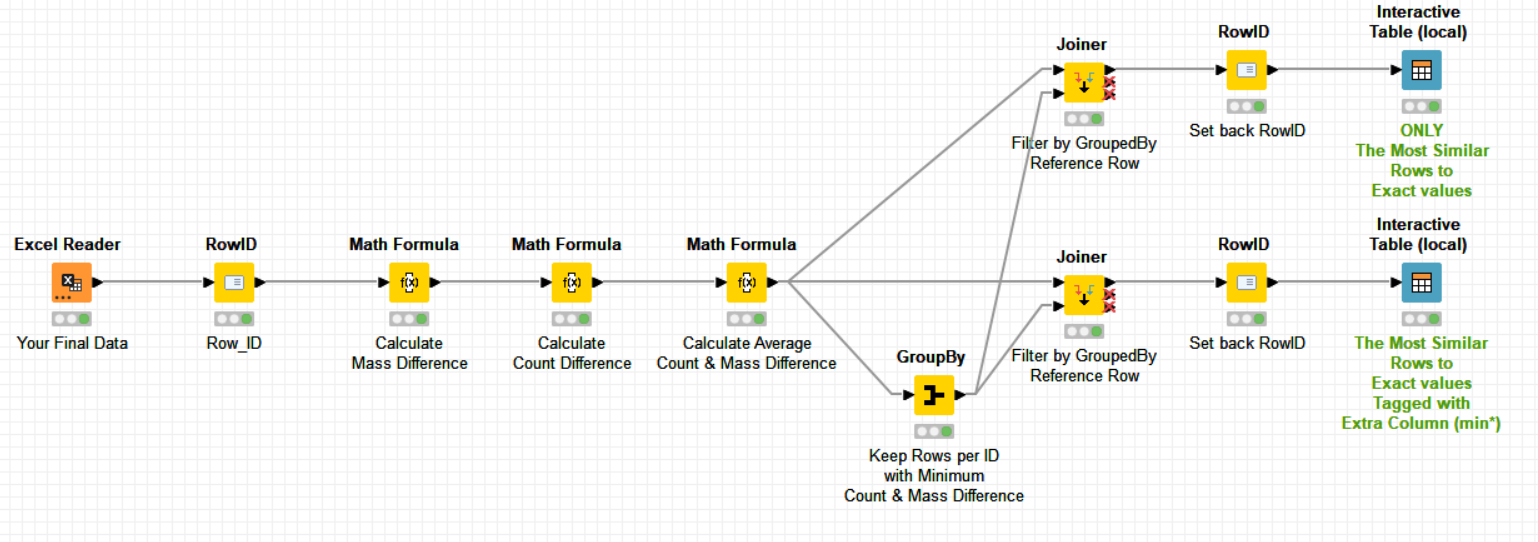
It could be solved with less nodes but I’m intentionally adding here a few more to explain in deeper detail (step by step) the whole algorithm.
The similarity I’m using is the average of the mass & count percentage similarities with respect to their exact values.
Hope it helps.
Best
Ael
PS: For info, the reason why I’m using an “average percentage similarity” is to avoid bias towards the measure with higher log10 range value, in your case the “count” measure. By normalizing them, the bias should be withdrawn and then the average similarity can be computed.