Doing statistics exercises from a book, I created a table containing ranges and two columns frequently.
(pg 30, Bussab & Morettin, 9th ed. ISBN 978-85-472-2022-8).
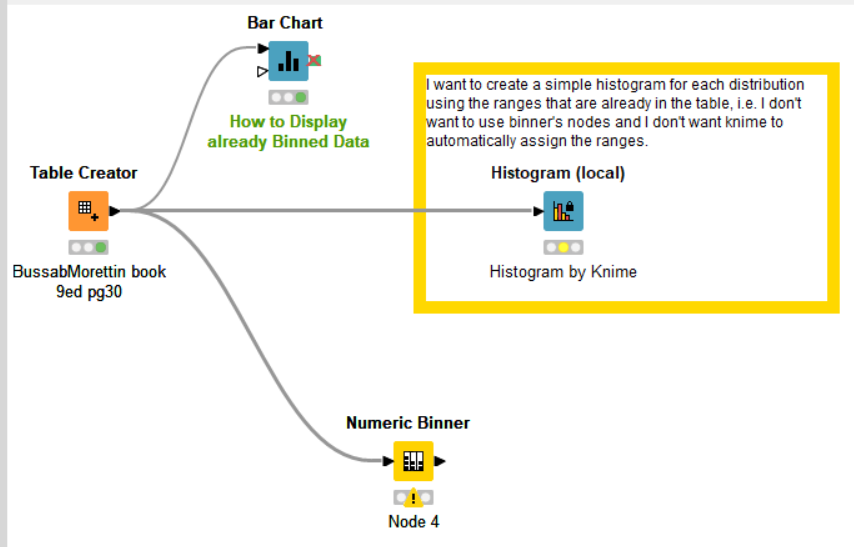
I want to create a simple histogram for each distribution using the ranges that are already in the table, i.e. I don’t want to use binner’s nodes and I don’t want knime to automatically assign the ranges.
Hola @darth_cruz y bienvenido a la comunidad del forum de KNIME
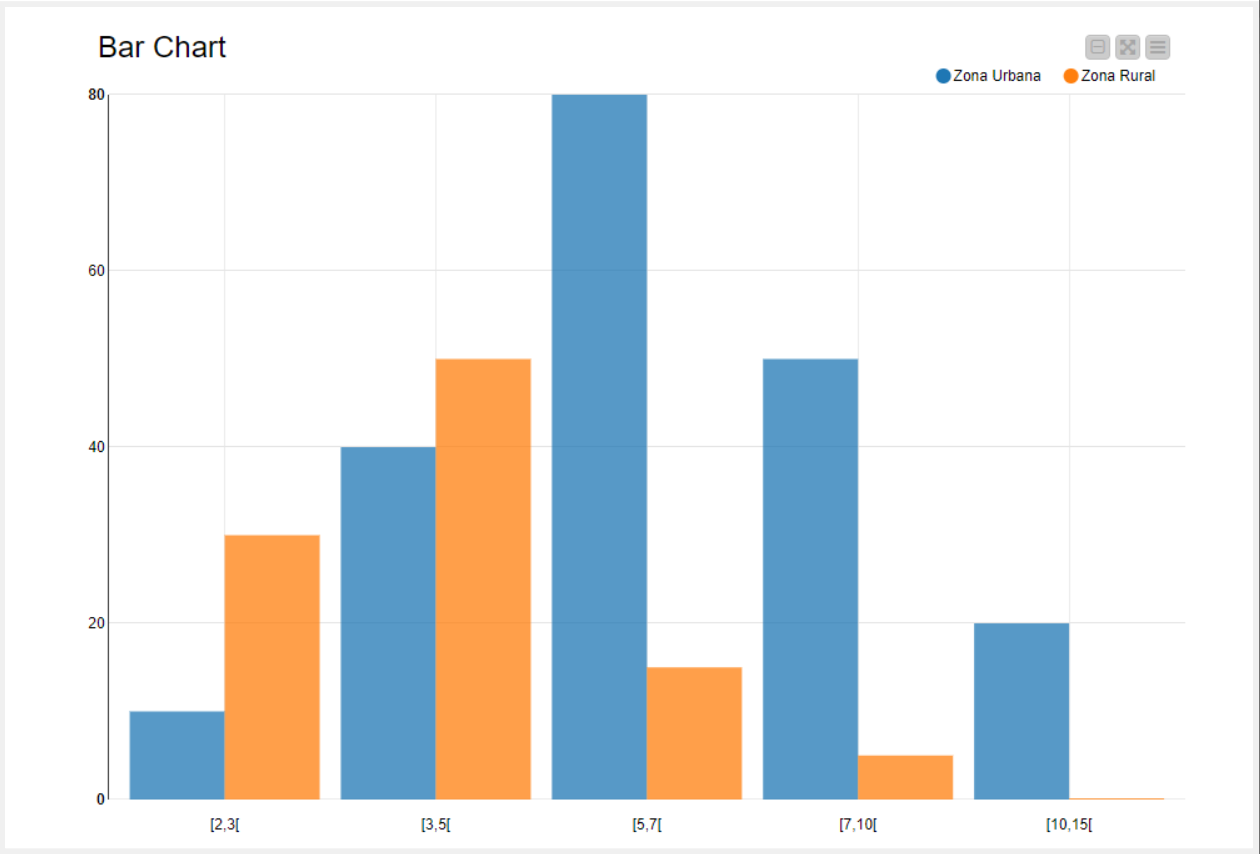
Since your table already contains binned data (predefined intervals), the type of plot you need to achieve a Histogram chart is a -Bar Chart- node. If your data were not already binned, the -Histogram- node would first do the binning and then the histogram plot.
I have added the -Bar Chart- node to your example as follows: