Hello everyone ![]()
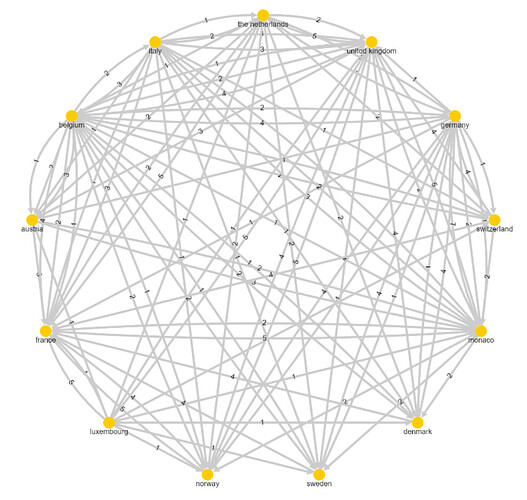
For challenge 8, I have decided to show the network in two different ways:
-
Using the -Network Creator-, -Object Inserter- and -Network Viewer- nodes:
-
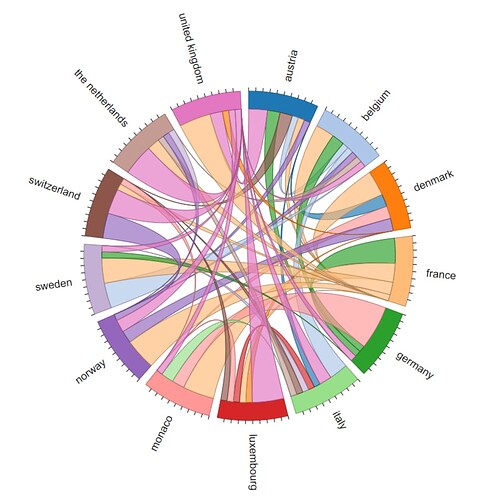
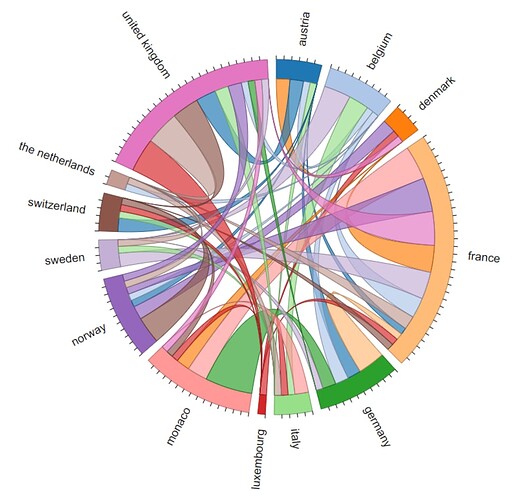
Using the -Generic JavaScript View- node to create Chord Diagrams:
Points Given By Countries:
Points Received By Countries:
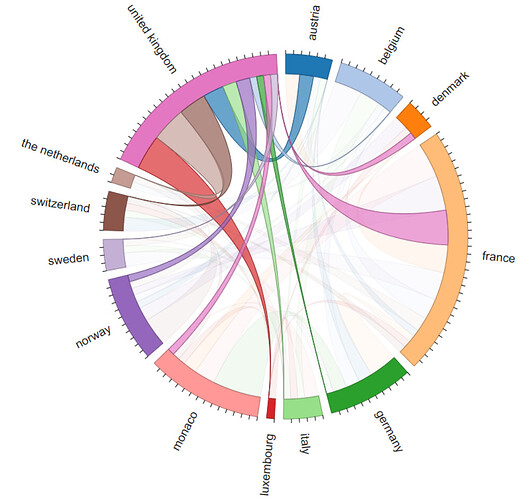
The Chord Diagram is a really useful way to create a network that shows the relationship between pairs of countries and their voting choices. You can hover over one particular country on the Chord Diagram to more easily see the network for that country:
After learning how to create a movie in the last challenge, I have decided to use the same set of nodes to create movies of the evolving points distribution over the years.
Points Given:
Points Received:
You can find my workflow on the hub here:
Hope you enjoy it ![]()
Thanks
Heather


