Hello KNIME members,
Late again with the solution to the challenge. Here is the flow JKISeason2-8 – KNIME Community Hub.
I see, someones do an elaborate solution for each year, people make a video, and others only take the last contest. For visual solutions, use Java, KNIME Labs components, R views or simple view components.
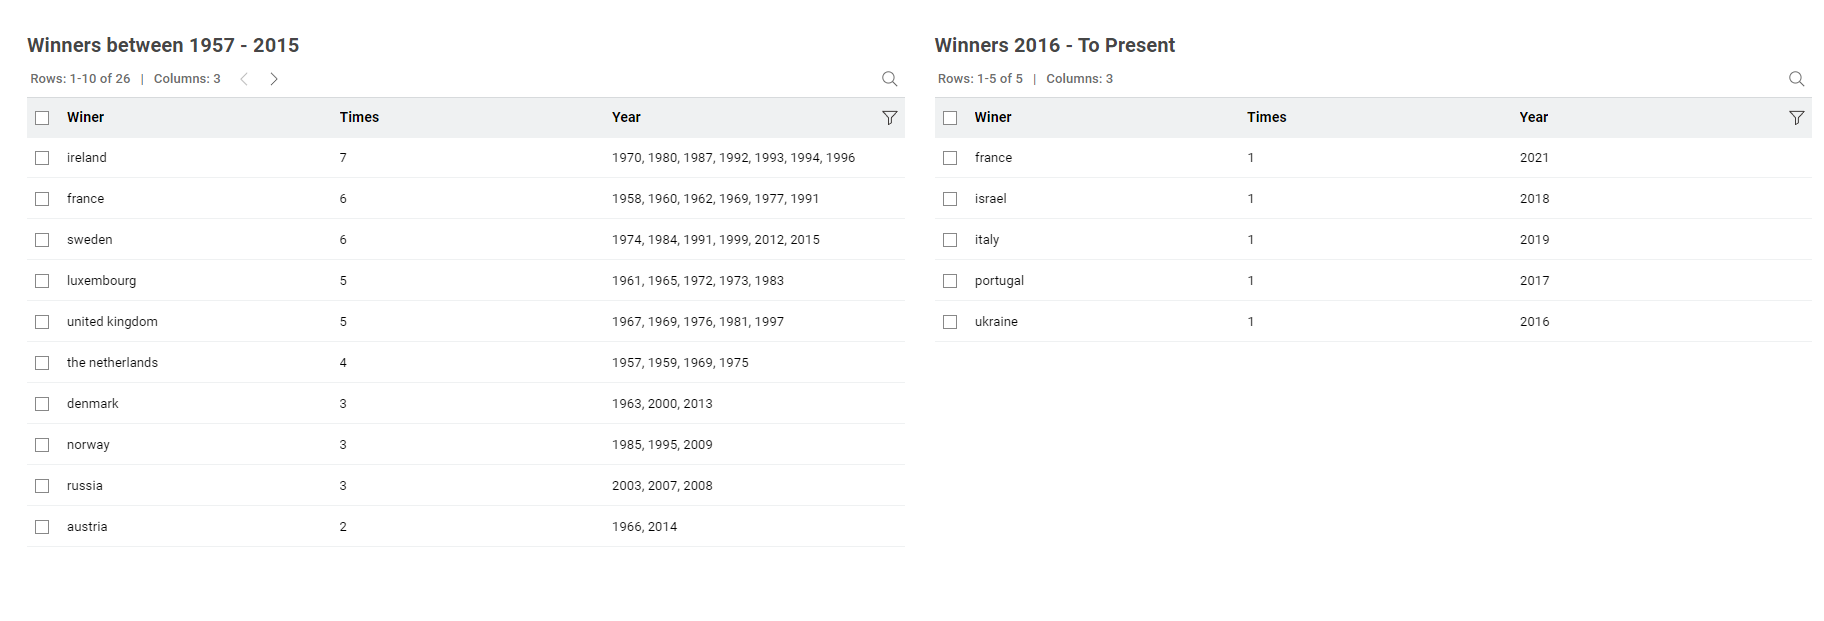
I see the competition have 2 contest regulation over time:
- a period from 1957 to 2015
- from 2016 to the present, with an exception in 2020, no exists data
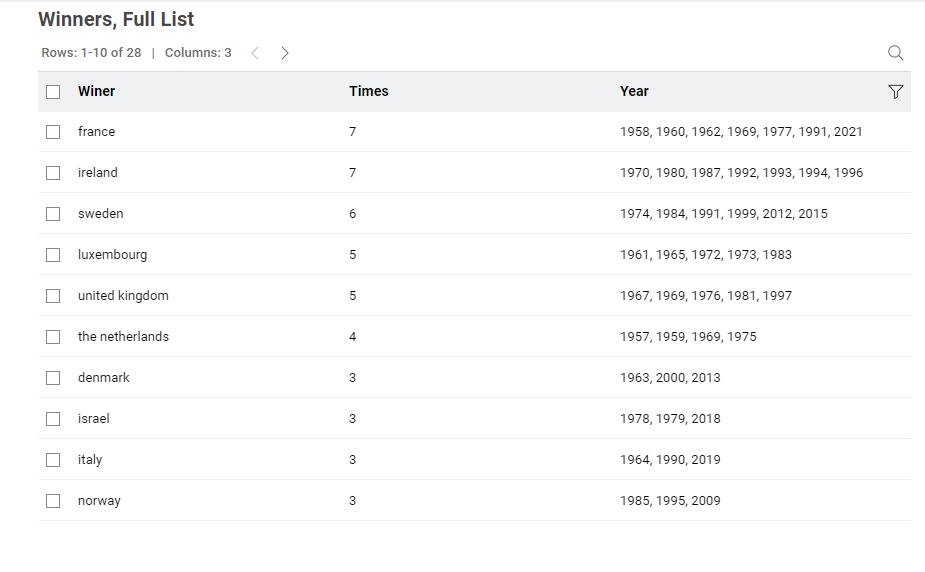
The full competition shows the winners in each year on the following results:
The boh periods then show the next results:
On the subsequent charts:
- The BLUE chart represents the effectively given points from the Winner in the specific year
- The GREEN chart represents the effectively received points from the Winner in the specific year
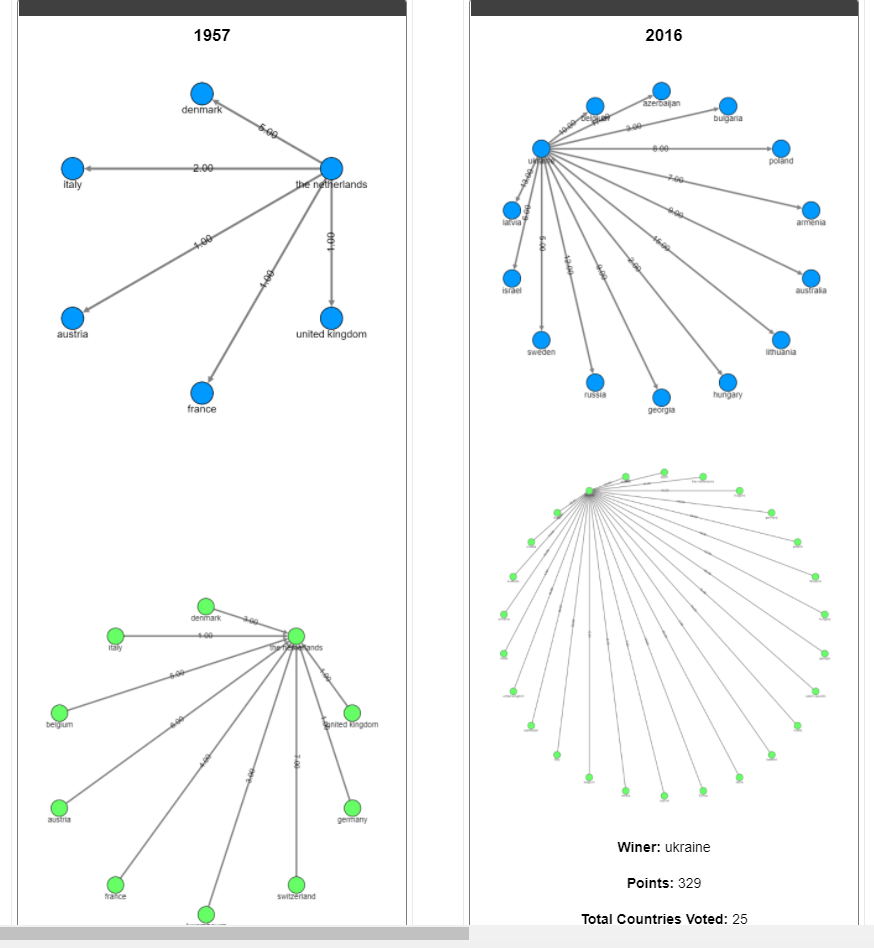
The network graph, it is showing statistics for the winner
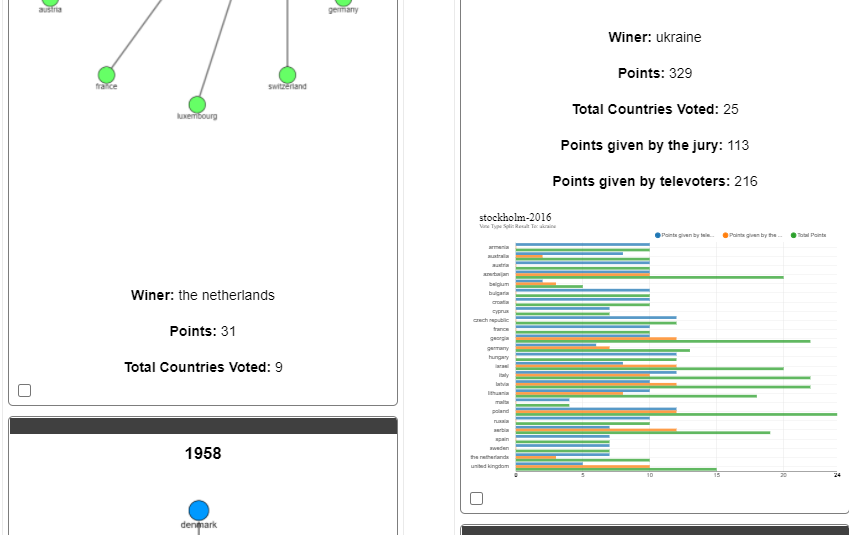
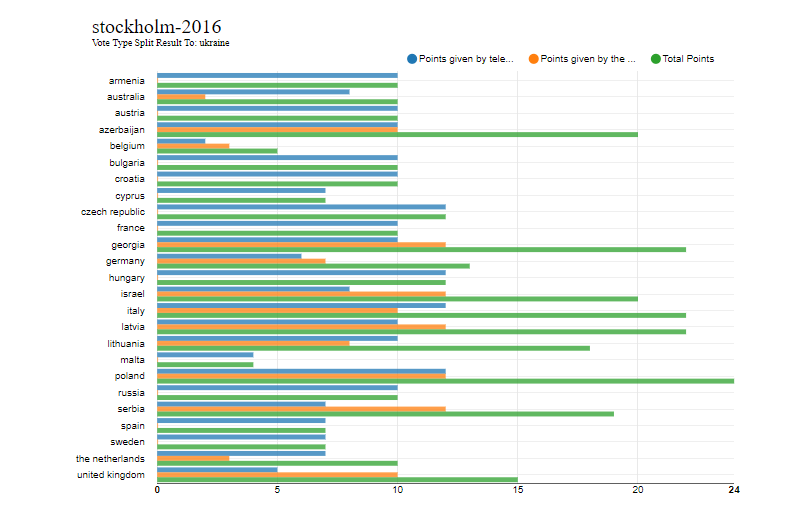
Only in the second period, it is reported in bar graphics the 2 kinds of votes and the sum of both:
- Jury
- Televoters
- The grand total (addition of the Jury and Televoters)
in the flow body, can see all the ways the countries voted in each year, and if look at the details of the winners from the first period, found in 1969, 4 countries reach the same point in the 1st position, and in 1991, 2 countries tie with the same score in the 1st place.