Hi there, Just KNIME It! folks! We’re back with a supply chain challenge today.
Claudia, the CEO of a small supermarket chain in the US, is worried about stockouts: a situation that occurs when customer orders exceed the available inventory of an item. She wants to know which warehouses are likely to suffer the most from stockouts, and which types of items are going to be the most problematic. Can you create a model to forecast stockouts for the different warehouses and item types, allowing her to interactively check the forecasts?
Here is the challenge. Let’s use this thread to post our solutions to it, which should be uploaded to your public KNIME Hub spaces with tag JKISeason4-13 .
Need help with tags? To add tag JKISeason4-13 to your workflow, go to the description panel in KNIME Analytics Platform, click the pencil to edit it, and you will see the option for adding tags right there. Let us know if you have any problems!
I used a Random Forest Regression. Many other models could be used (ARIMA, SARIMA, LSTM, …). I wanted to use LSTM, but the extension is not installed yet on my new KNIME instance
Anyway, the concept stays similar.
The solution I provide do the forecast on the fly when the settings are being changed (warehouse or item type change). If it start to be slow or a lot of data needs to be processed, it might be interesting to extract the model training out of the component (and maybe train a generic one to be used, or multiple more specific ones saved somewhere).
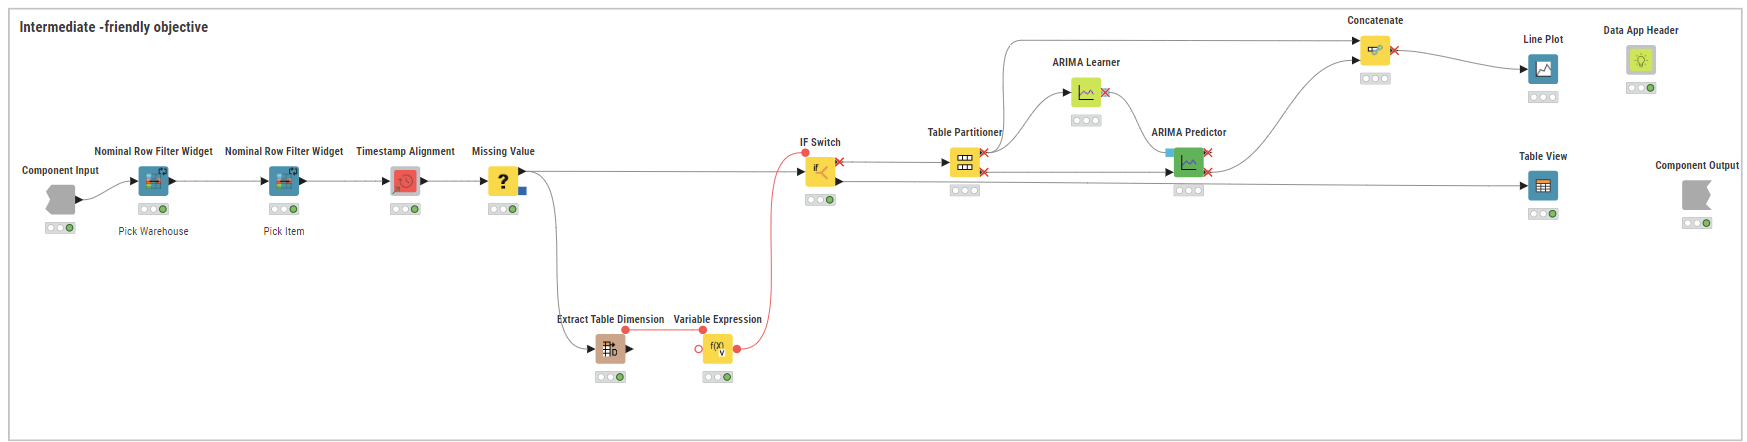
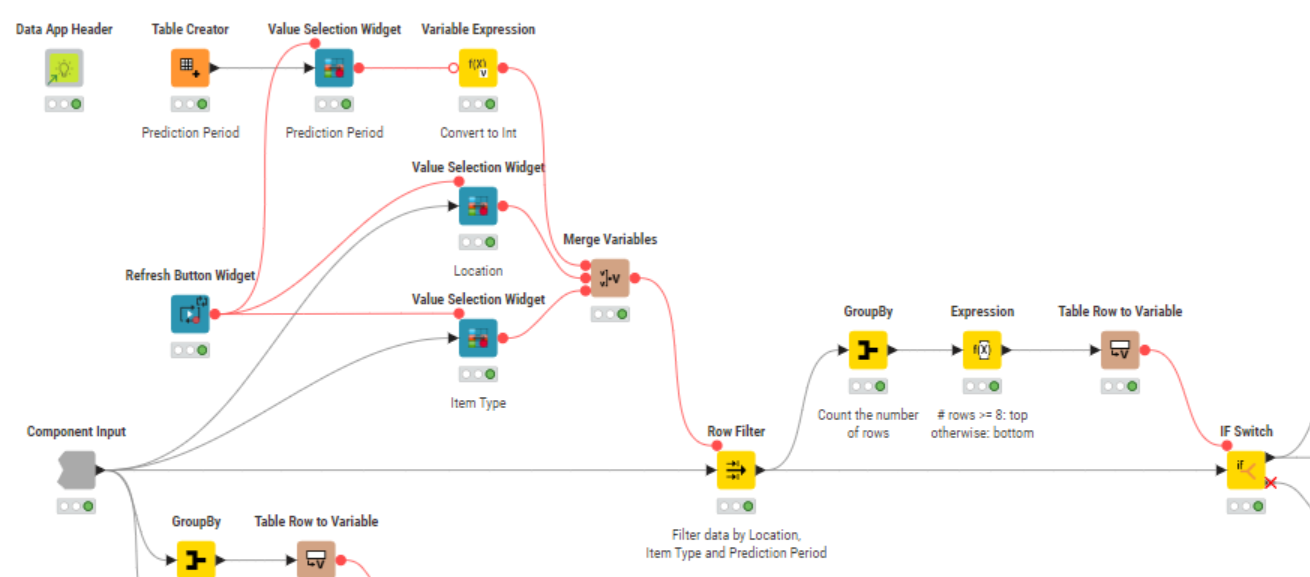
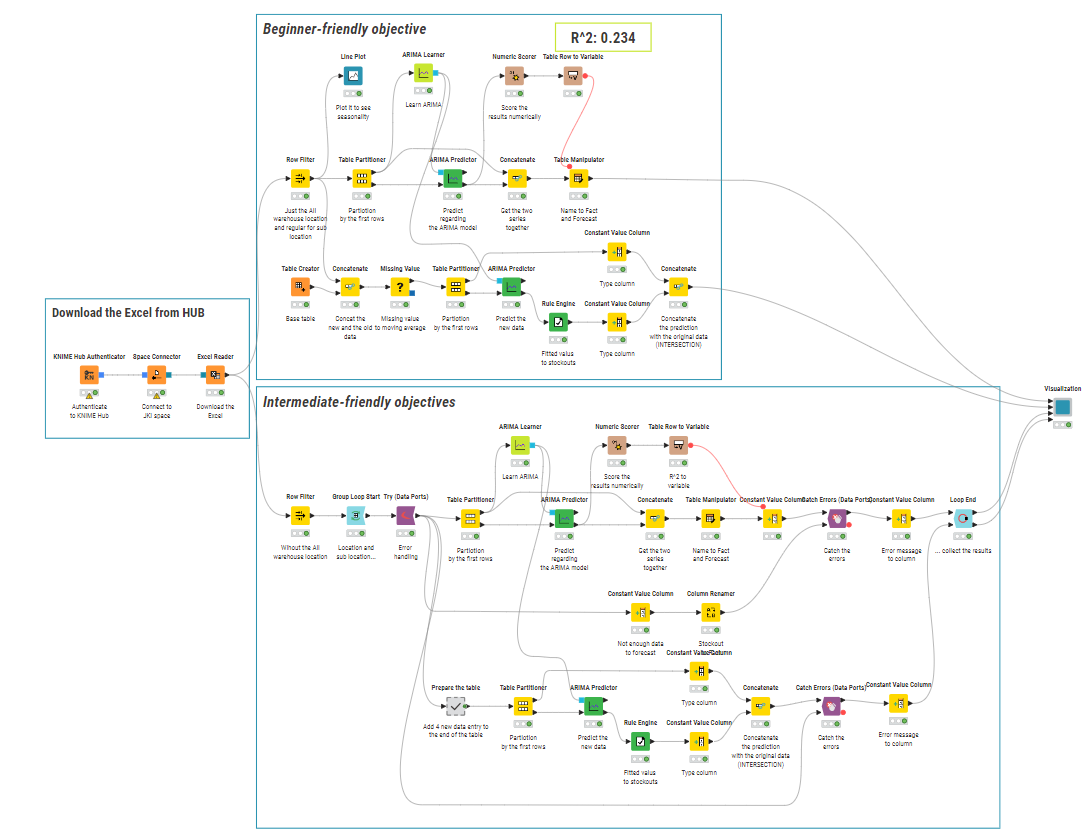
The overall workflow:
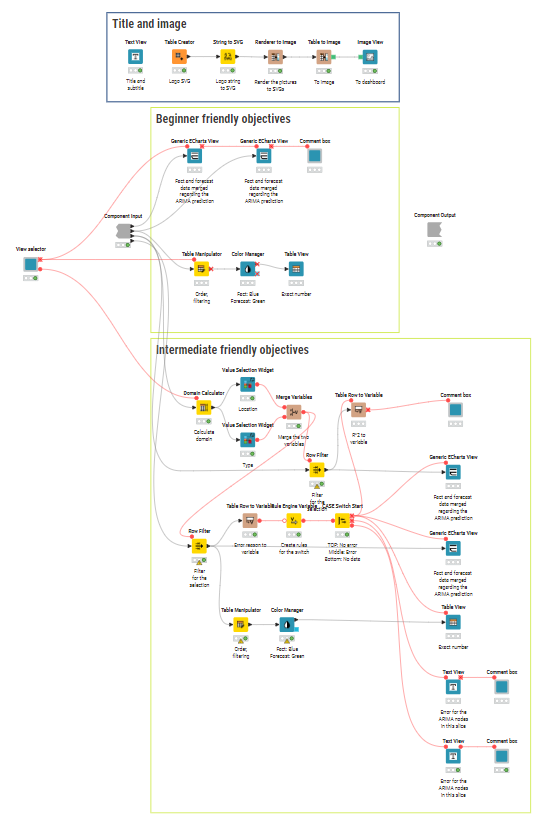
Inside the component (where the logic is in this one - cf. above if optimization is needed).
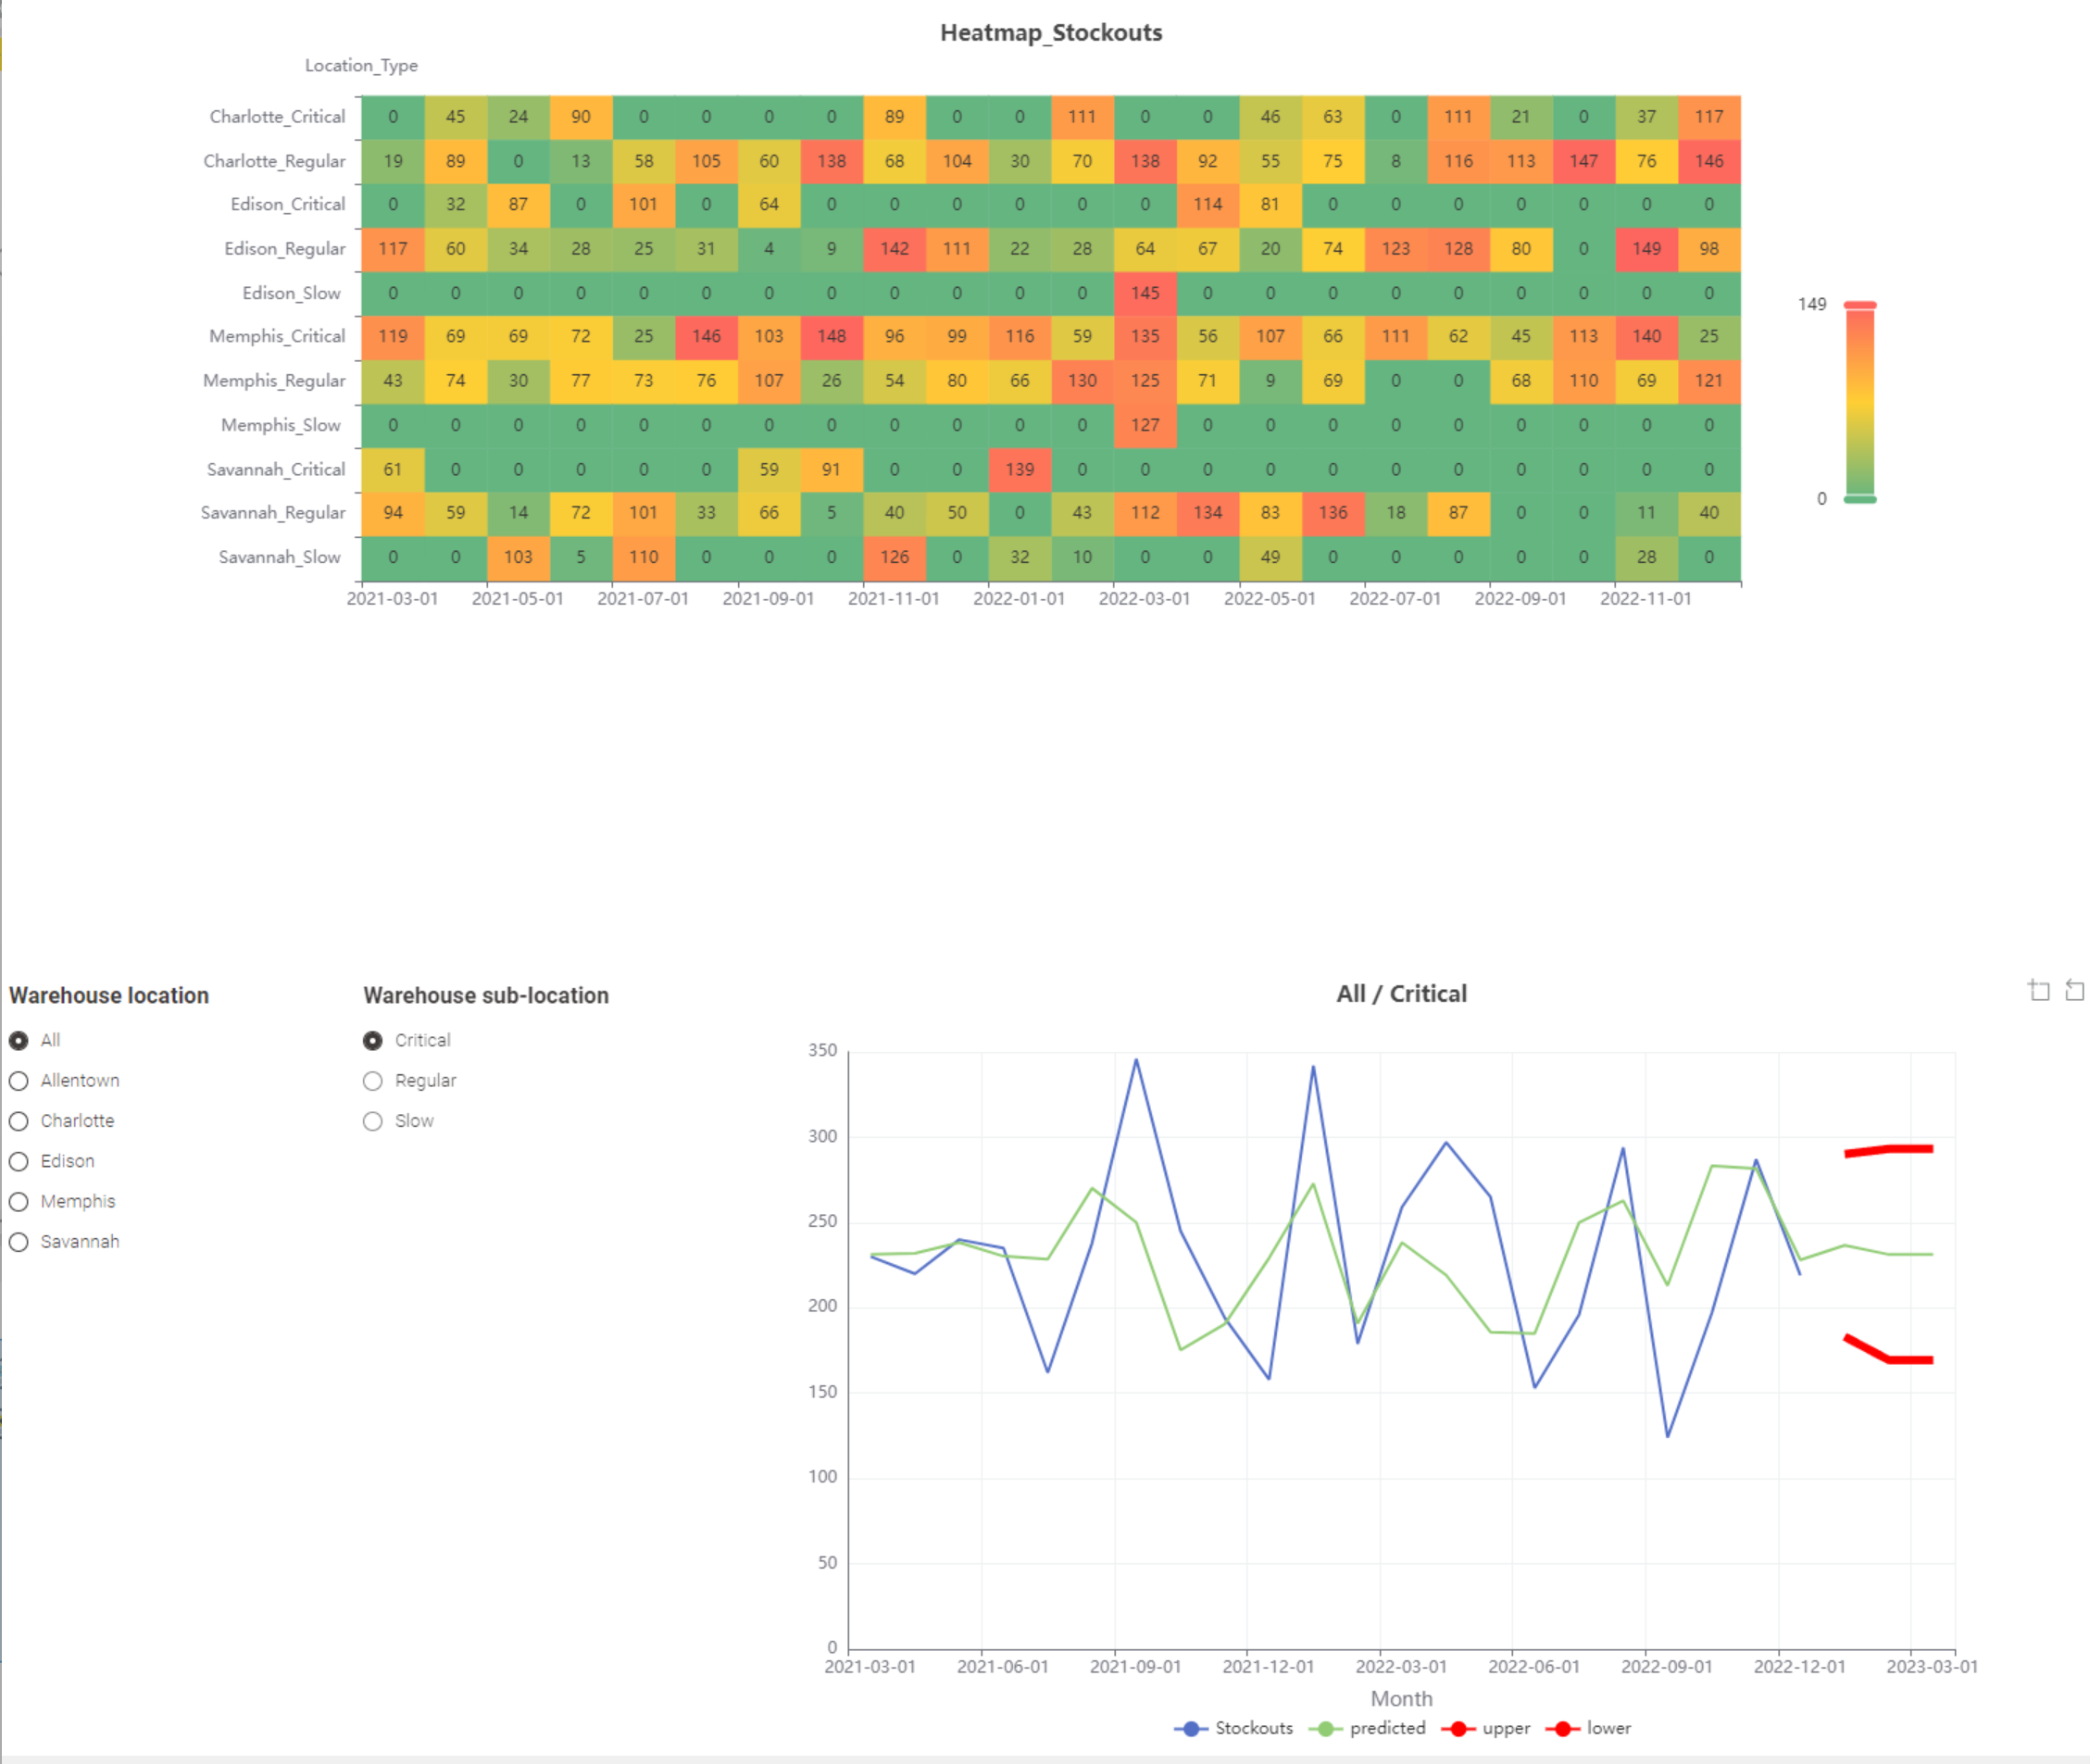
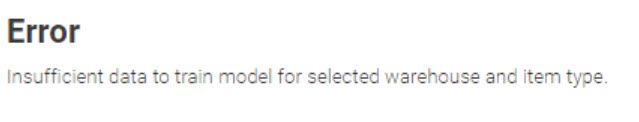
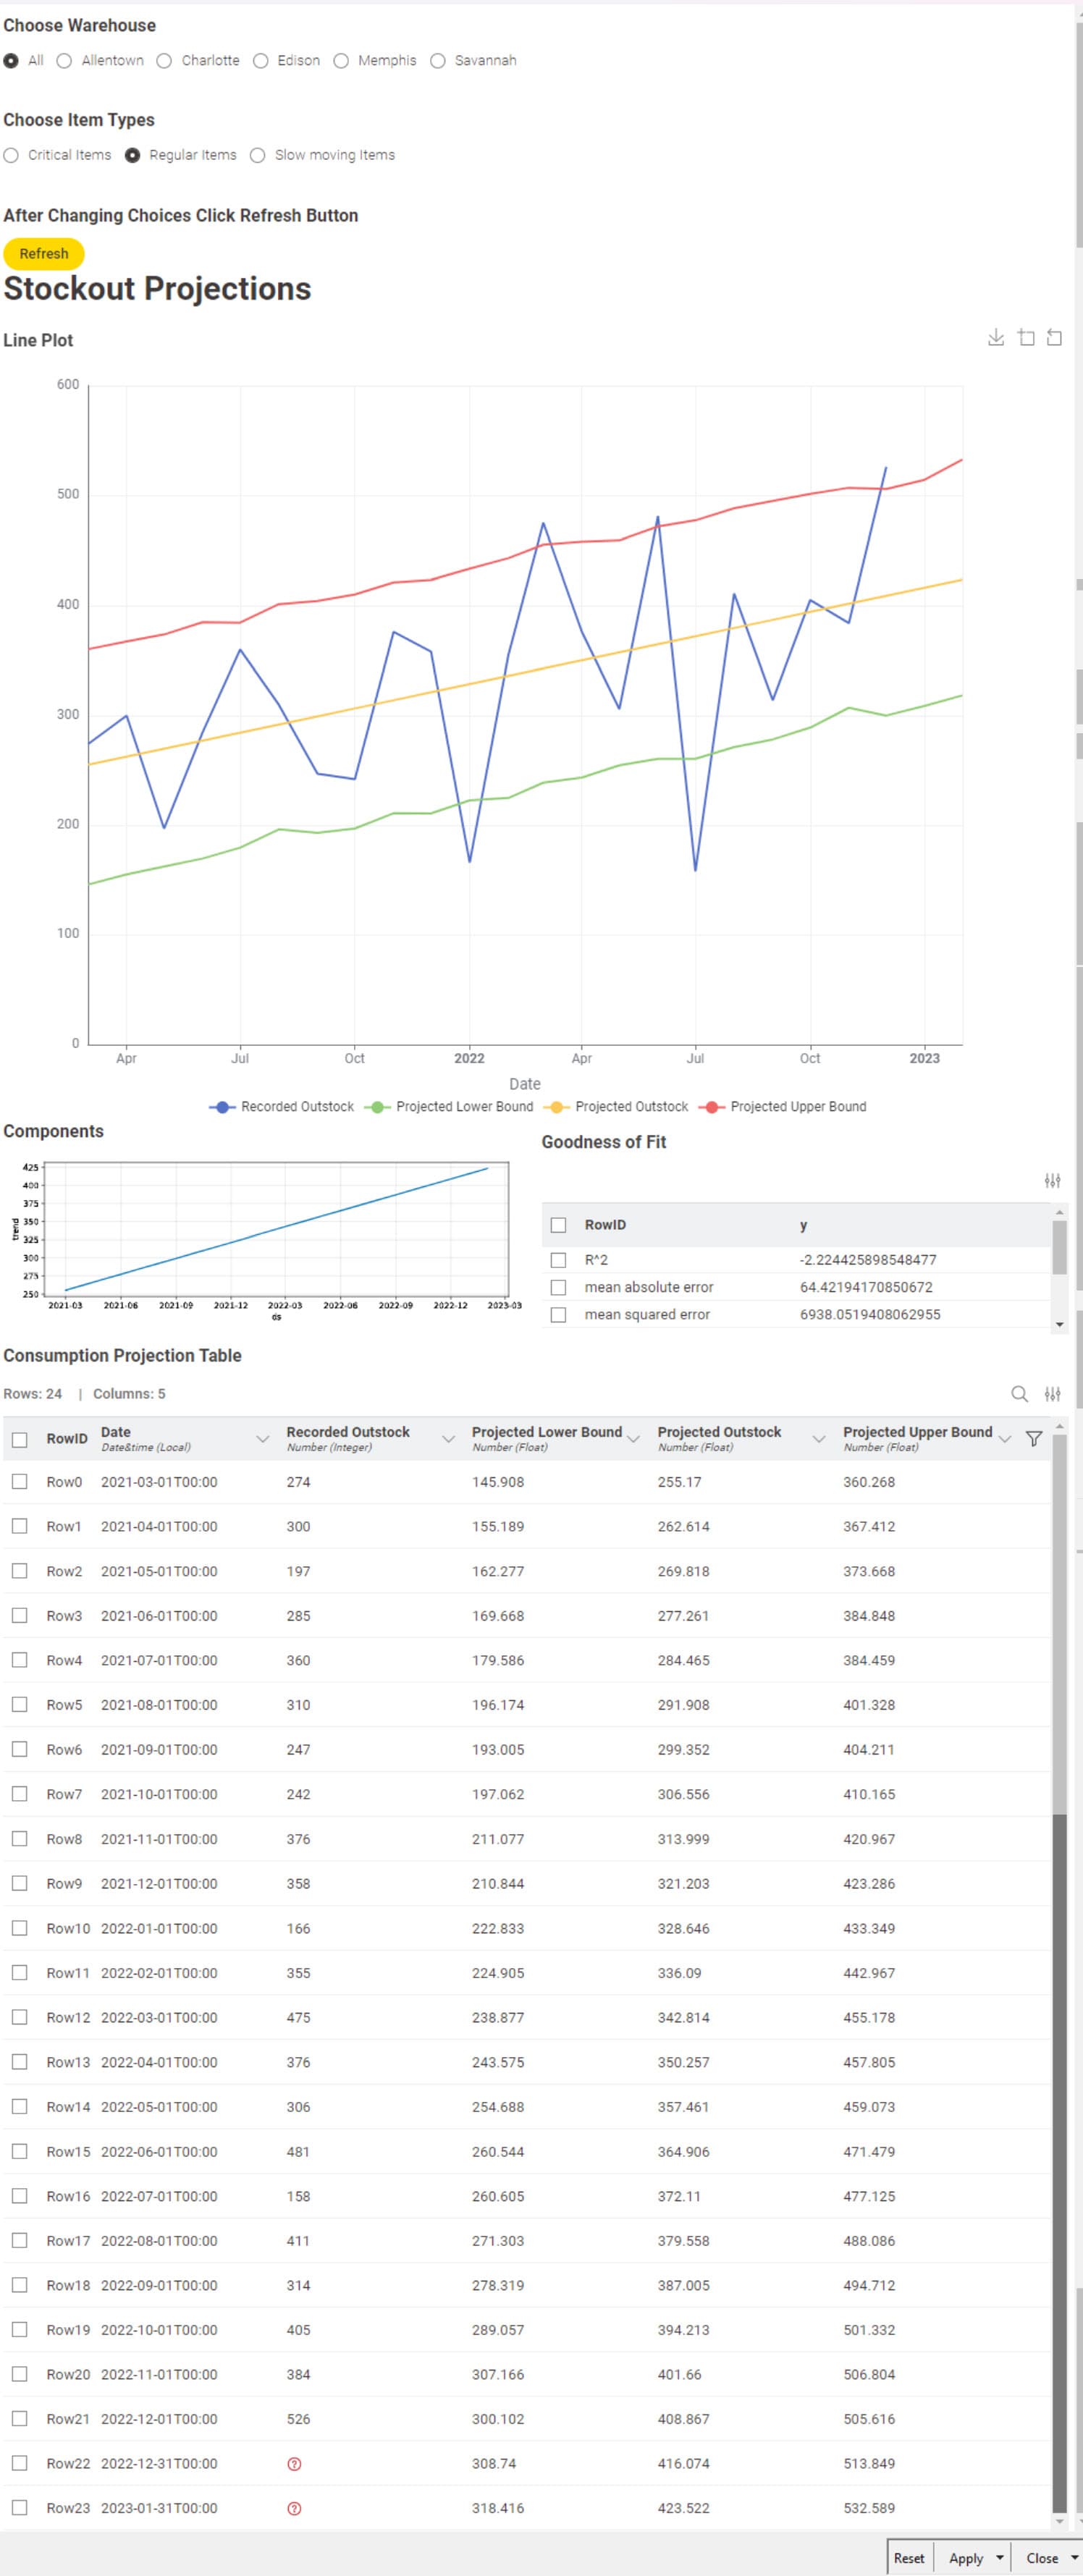
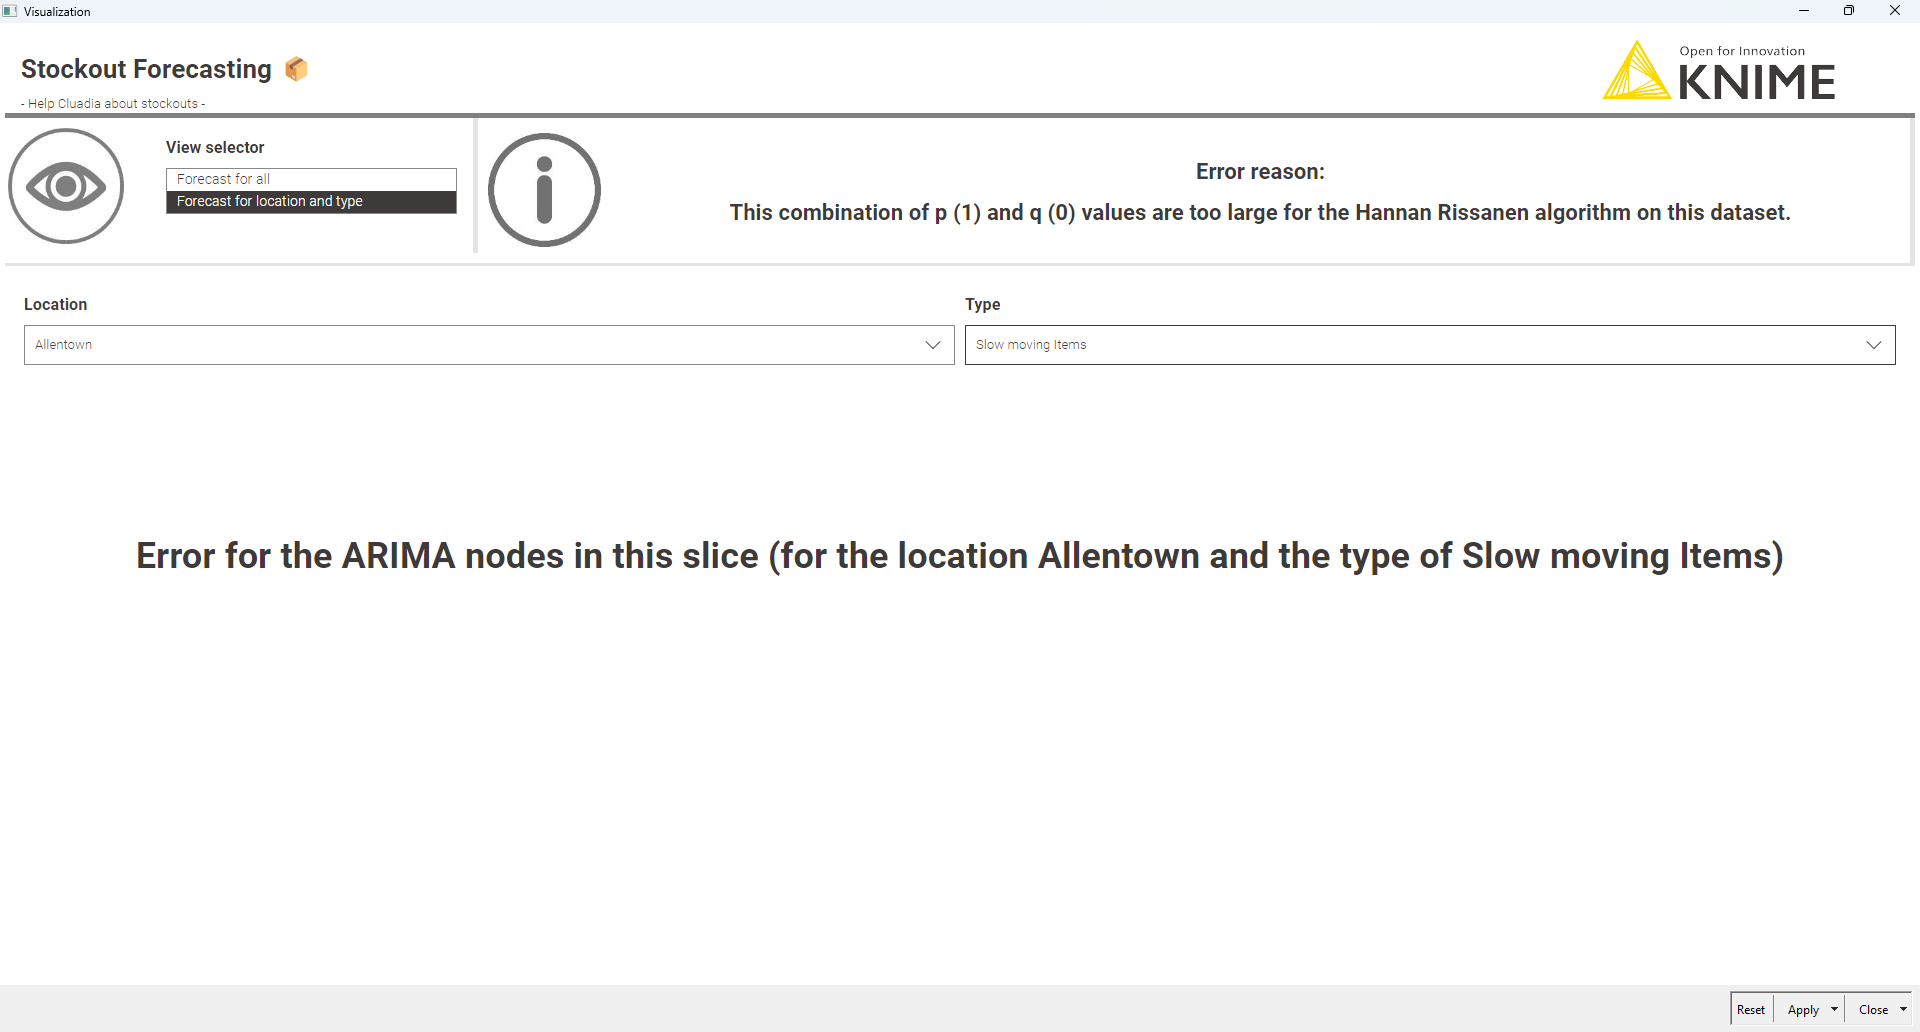
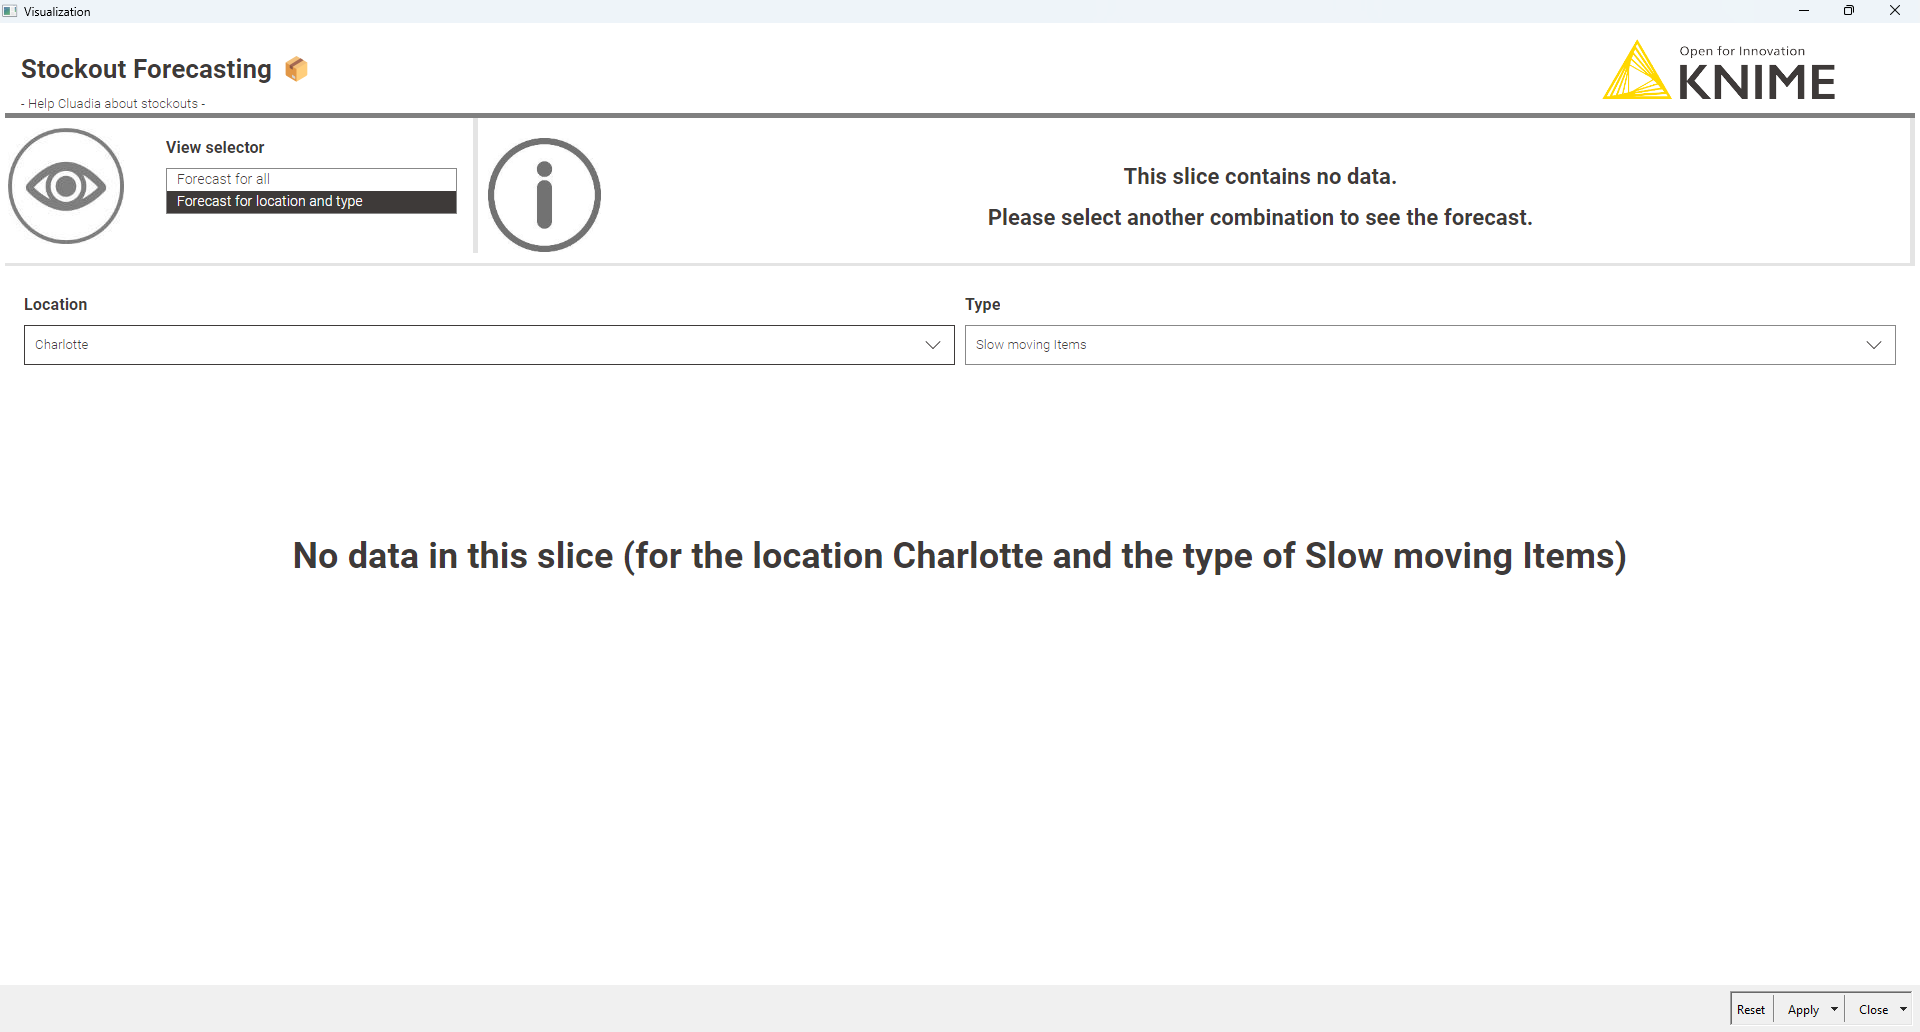
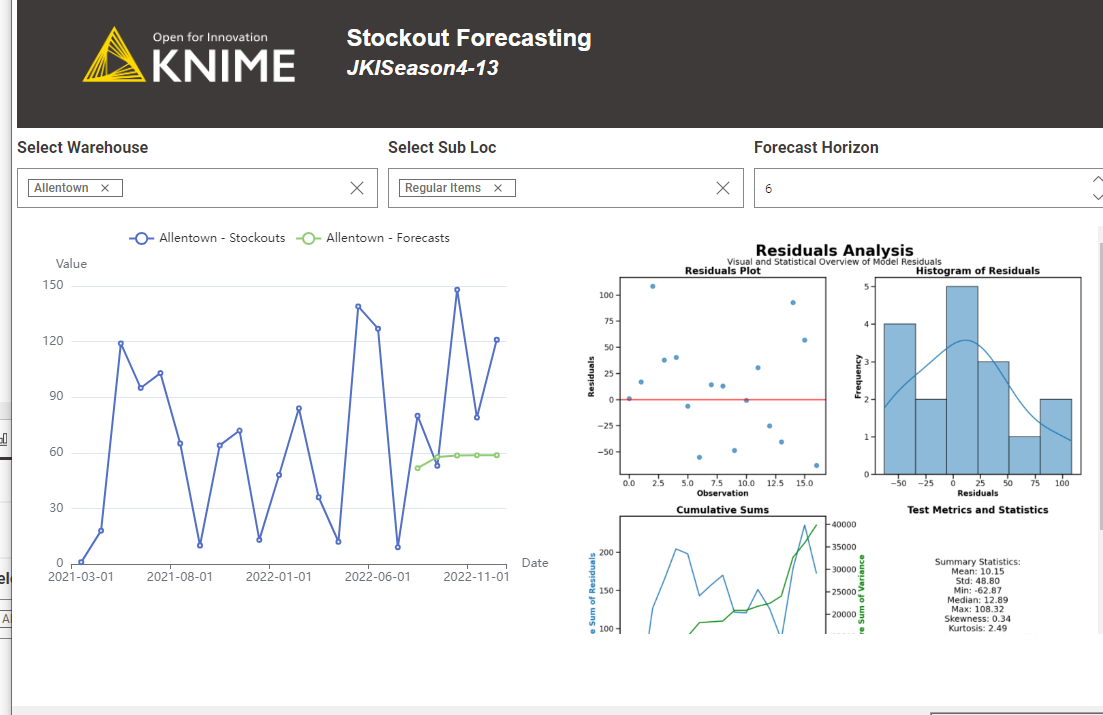
And the output as follow, giving some information about model quality and the future prediction of the stockout. If the number of sample is too small, it is being catch with a try-catch logic, including a warning message.
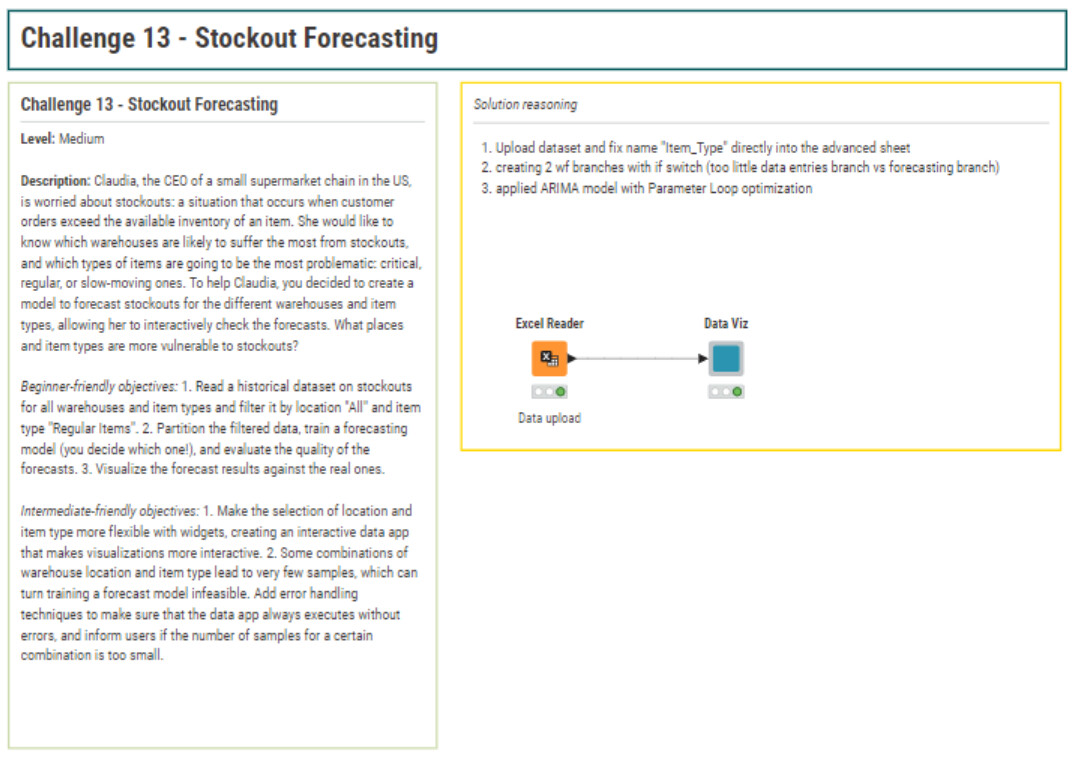
1. Data Upload
The dataset was read using an Excel Reader, followed by basic filtering and column renaming to streamline further processing.
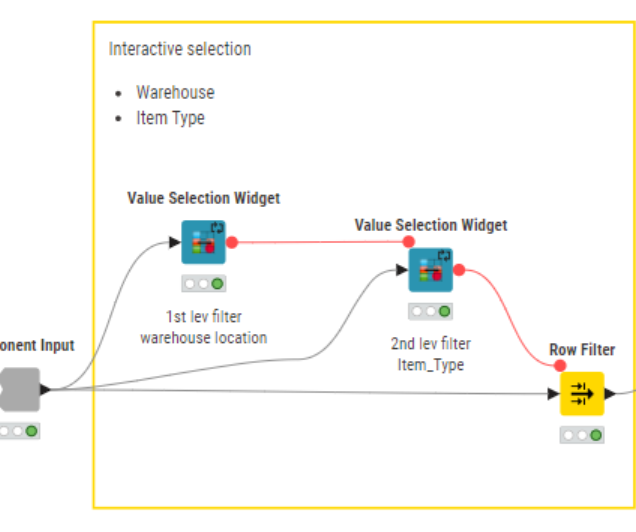
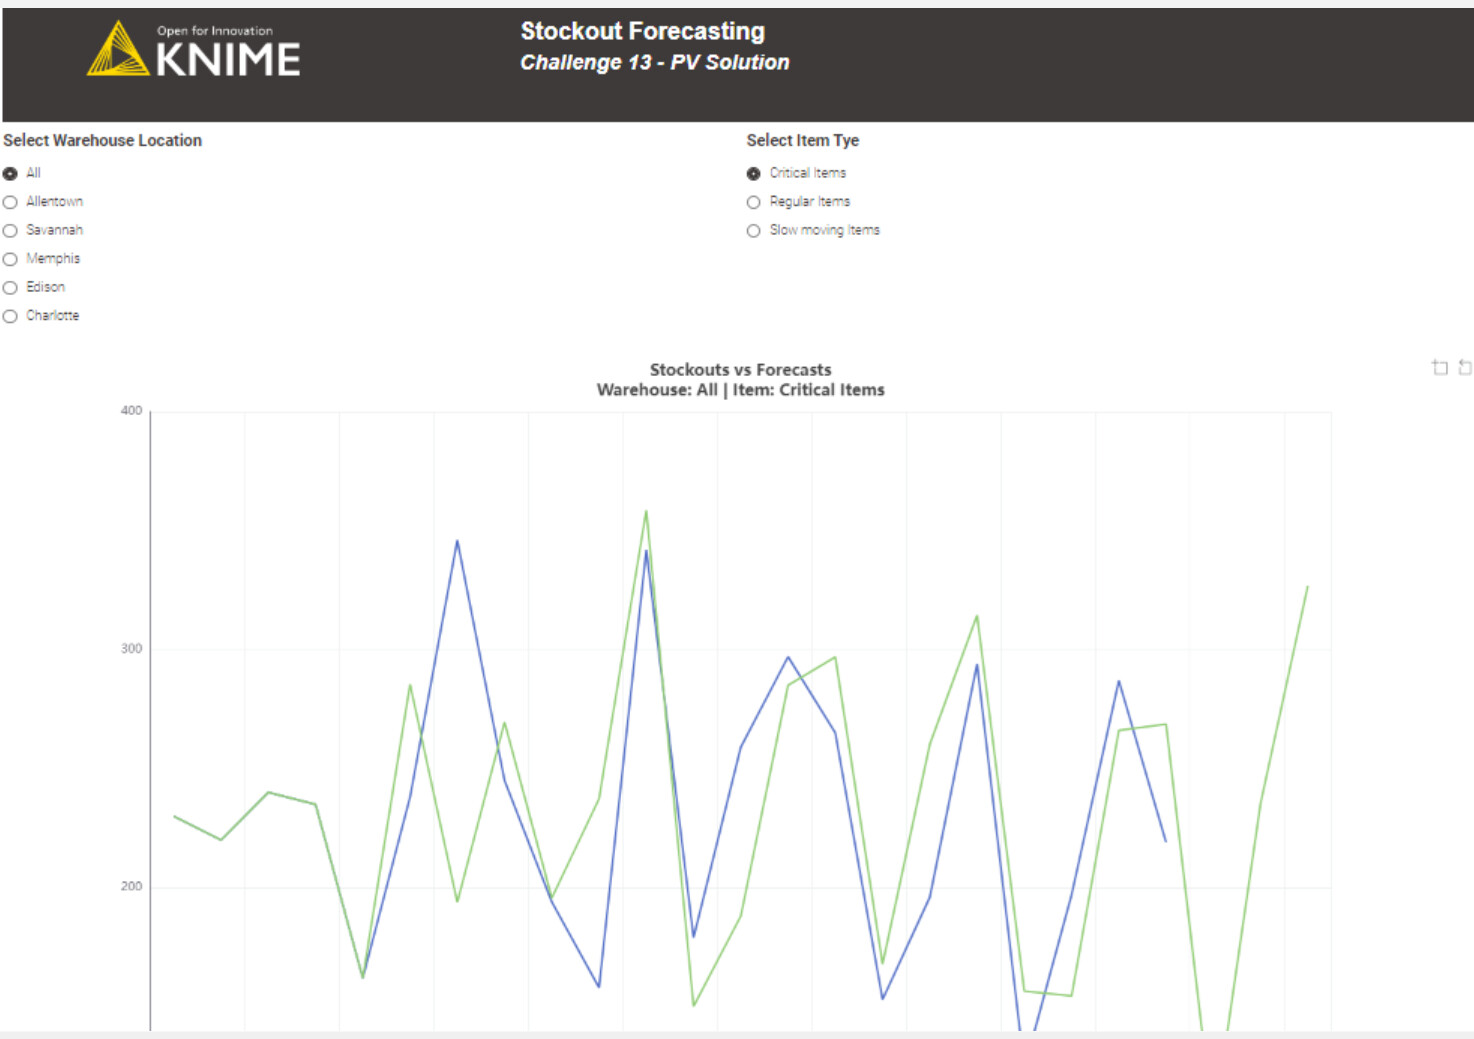
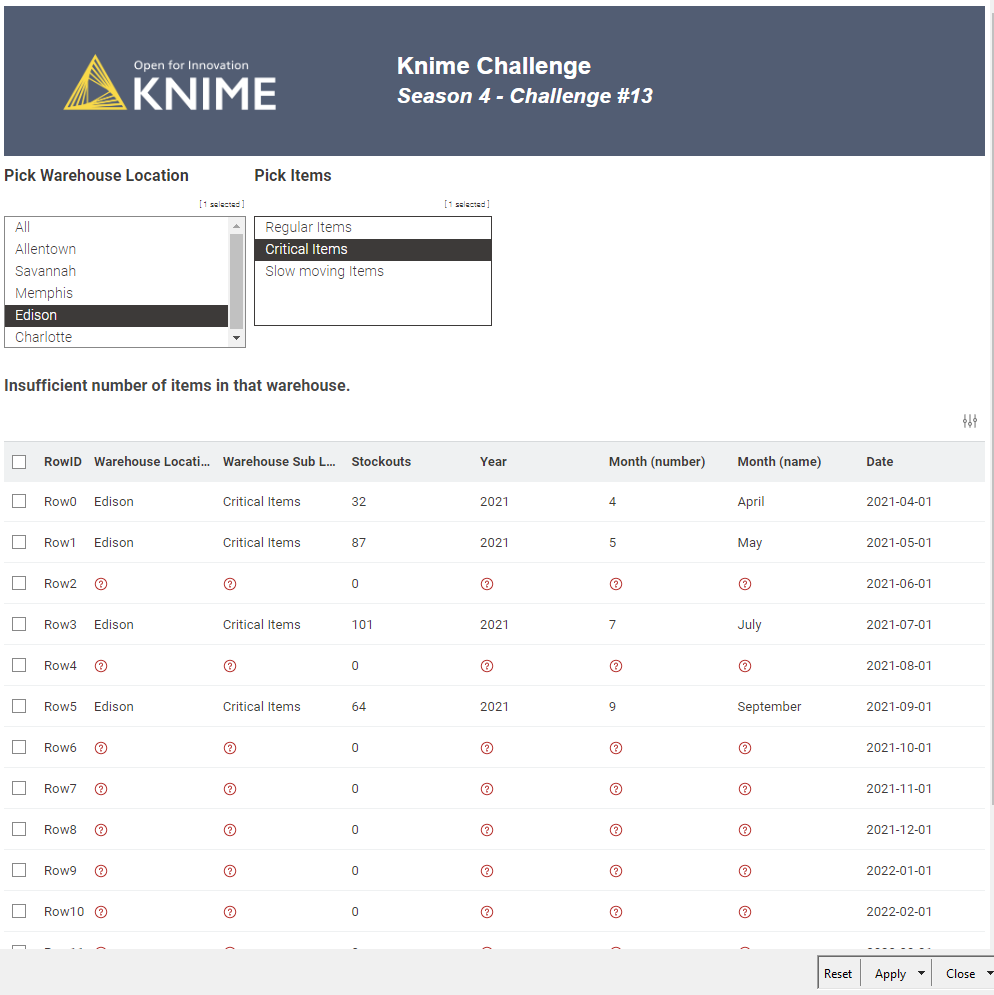
2. Interactive Filtering
I introduced two Value Selection Widget nodes to allow dynamic filtering by Warehouse Location and Item Type, enabling a more interactive experience for users.
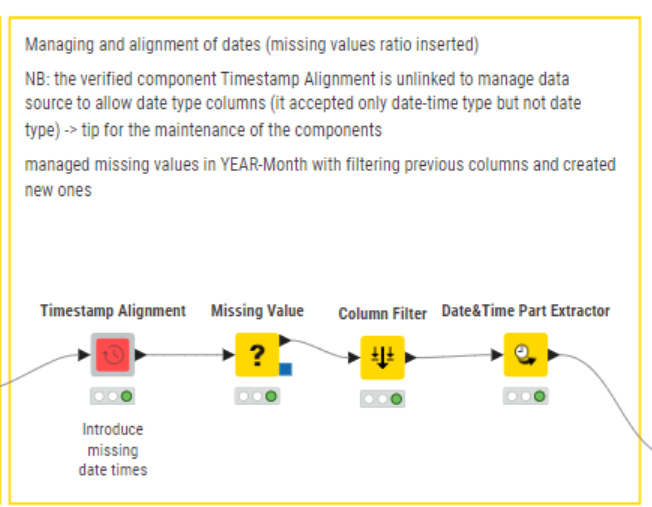
3. Missing Timestamp Management
To handle potential gaps in the time series (months with zero stockouts), I used the Timestamp Alignment (Verified Component).
Note: I unlinked the component to modify the accepted data types—originally limited to Date&Time, I extended it to also accept Local Date. This might be a useful maintenance suggestion for the KNIME team maintaining the verified components.
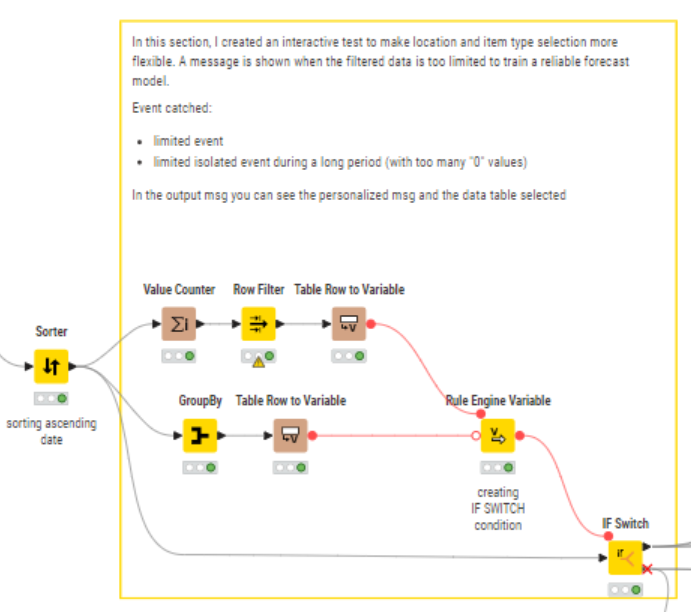
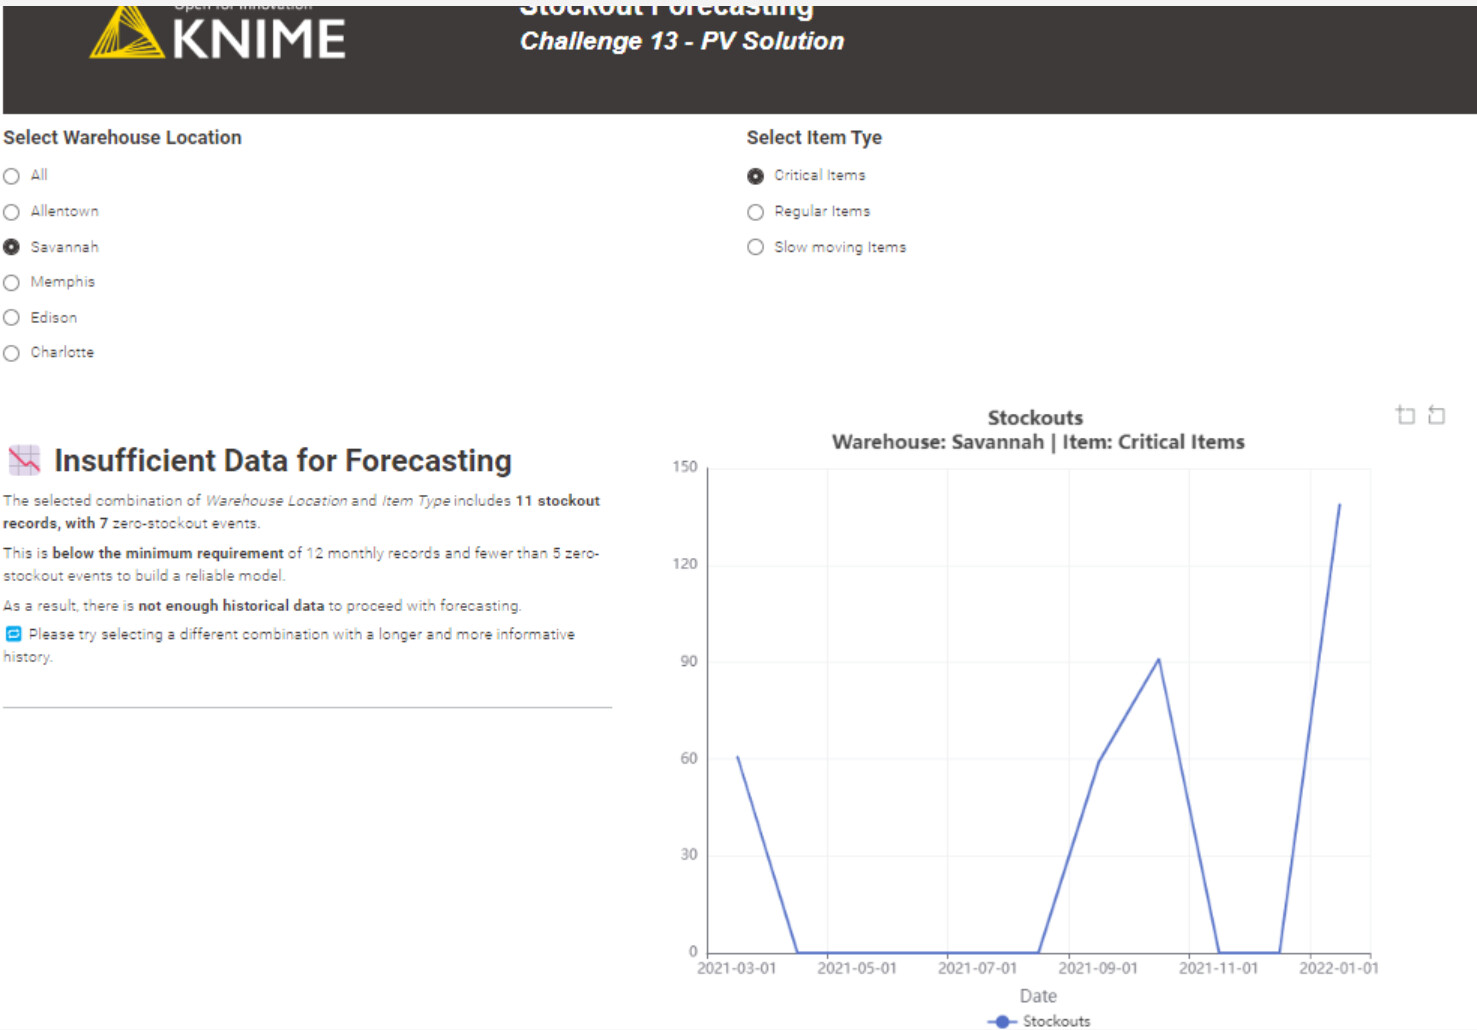
4. Insufficient Data Handling
If the selected combination doesn’t meet the minimum threshold for modeling, I applied an If Switch and routed the flow to a custom message using a Text View, to inform users clearly.
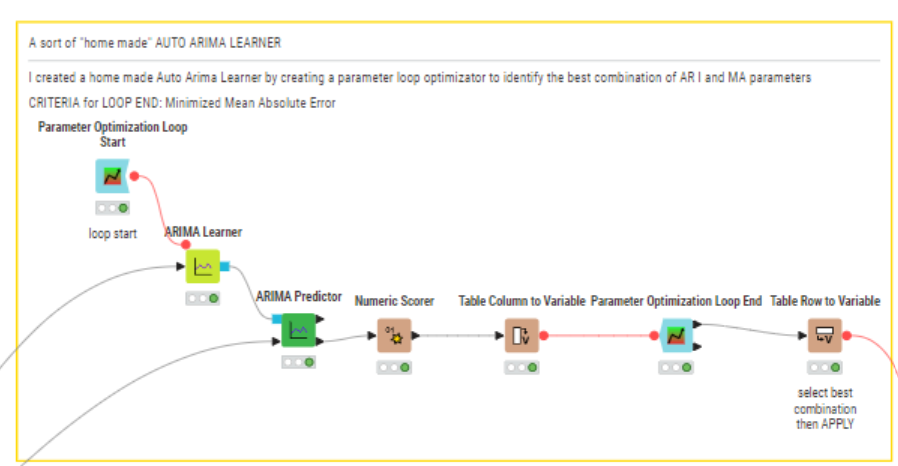
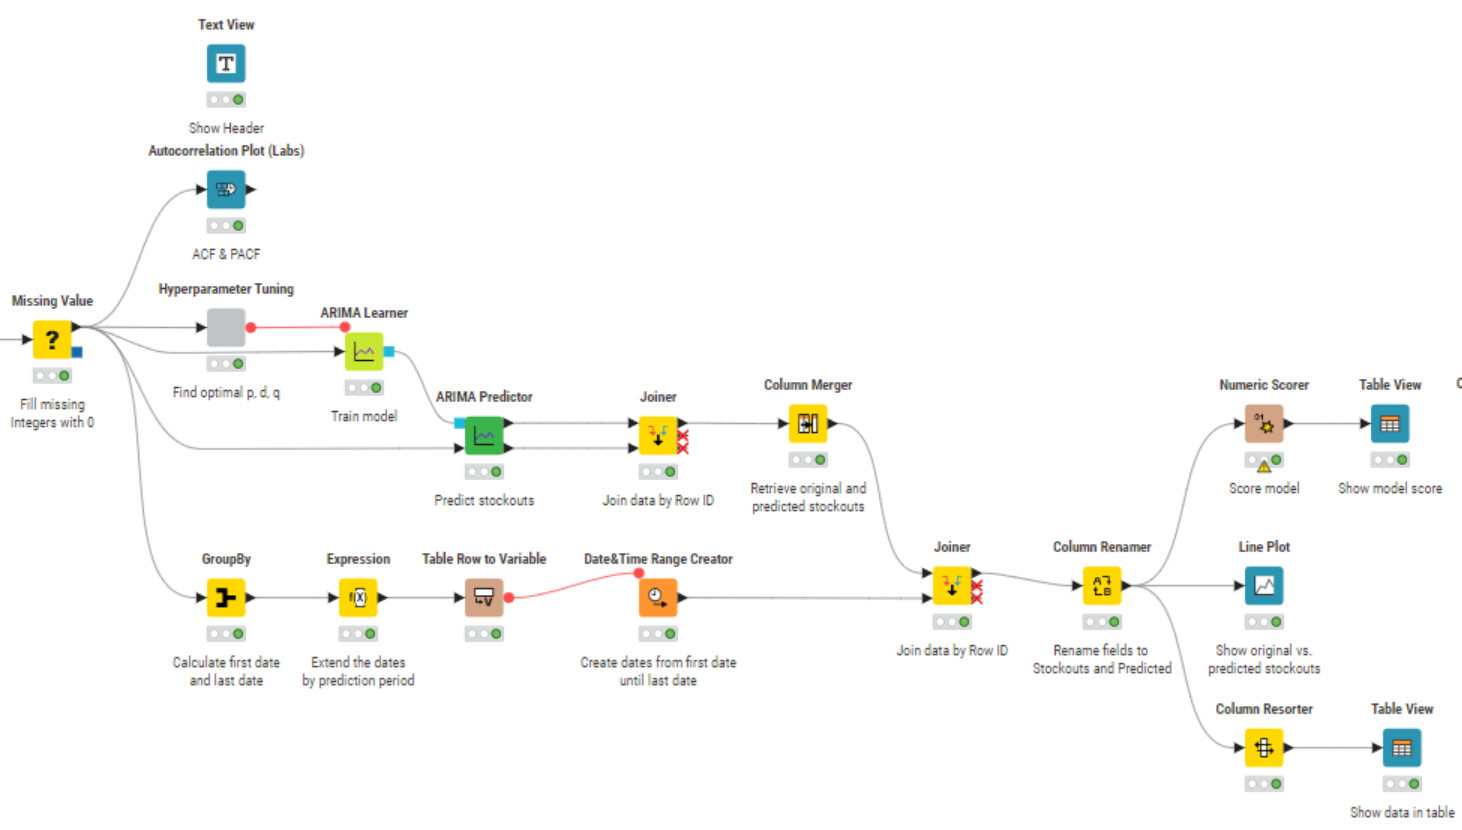
5. Forecasting with Optimization
For valid forecasting scenarios, I adopted an ARIMA model, as seen in other strong solution.
To optimize the AR, I, and MA parameters, I implemented a Parameter Optimization Loop, minimizing the Mean Absolute Error (MAE) to determine the best configuration for each filtered series (best combination of optimized parameters for every filtered scenario).
Here’s my solution. I used fbprophet. The model produces a 2 month projection which can be changed with the fbprophet component input. It requires the corresponding python package. Since its not commonly installed, I included a Conda Environment Propogation node which should install it for you. Unlike most native Knime regression/time series nodes, fbprophet doesn’t handle model errors elegantly. To address this I did manual filtering of data which can’t produce a model. In that case it displays an error message:
I have never used time series before, I had to go thru Knime workshop to be able to complete this. The video made me discover the Timestamp Alignment component, which is very cool!
I arbitrary picked 15 records as a minimum for forecasting.
Here is my solution to this week challenge. JKISeason4-13
If this is a medium level challenge I wonder what difficult level challenge looks like
I’m still new to the time series analysis and had to leverage what others here are doing to solve these challenges but the more I continue to use time series analysis the more I’m starting to gain a decent knowledge base.
Hey I’m also joining this season for the first time, and like you, I found myself studying and applying some features I’d never really used before — in my case, the If Switch node from this challenge.
That’s one of the things I like most about these exercises: they push us to explore parts of KNIME we usually keep “on the shelf” .
And yes… so that’s how you could use the node! — now I have the feeling I won’t be able to live without it anymore .
I agree with @PVergati, @dataloca and @garcbcpa regarding the difficulty level of the challenge. It started smoothly, but turned into a beast mode midway until the finish line . However, it was also rewarding, as it’s given me the opportunity to explore new areas.
Data Preparation
Identify and fill missing dates with a default value
Initially, I used the Date&Time Aligner, but in my opinion, it requires extra effort for monthly periods, as it returns the end of the month instead of the beginning. I also tested the verified Timestamp Aligner component as an alternative. However, as @PVergati mentioned, it caused an error and required manual unlinking and node adjustments. As a result, I opted for a simpler join-based approach to achieve a similar outcome.
Extract geometry of the relevant locations to enable geospatial visualization later in the process
For the prediction step, I assumed a minimum of 8 data points is necessary. If the data falls below this threshold, a warning message will be shown to inform users.
Model training and prediction
I experimented with several algorithms, including Linear Regression, Random Forest Regression, and ARIMA. Among them, ARIMA appeared to deliver the best results.
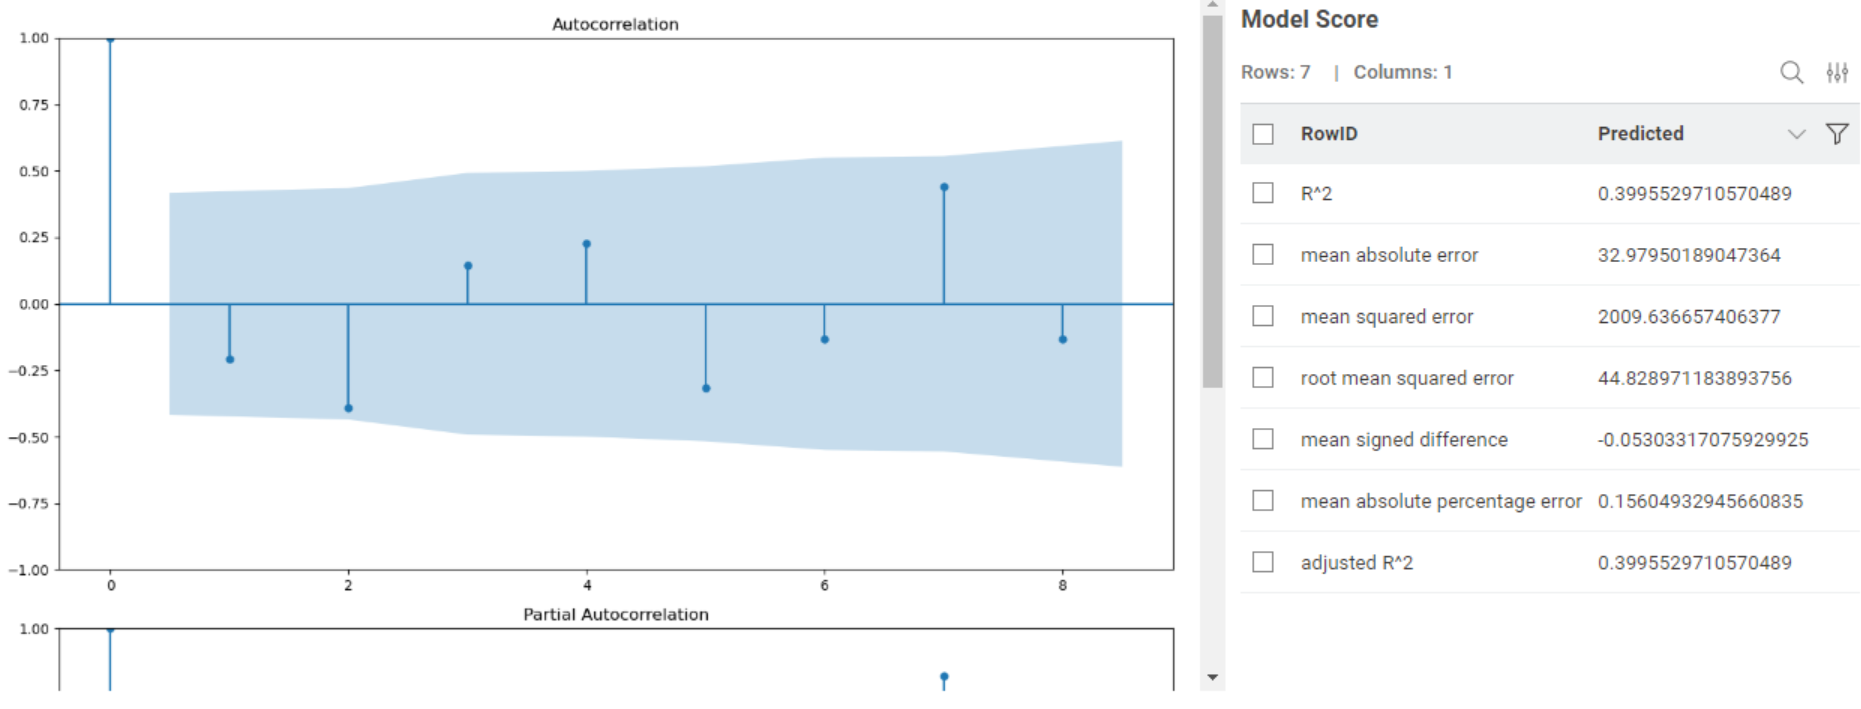
To optimize the model, hyperparameter tuning was performed to determine the ideal values for p, d, and q. Additionally, ACF and PACF plots were used to help validate these parameters.
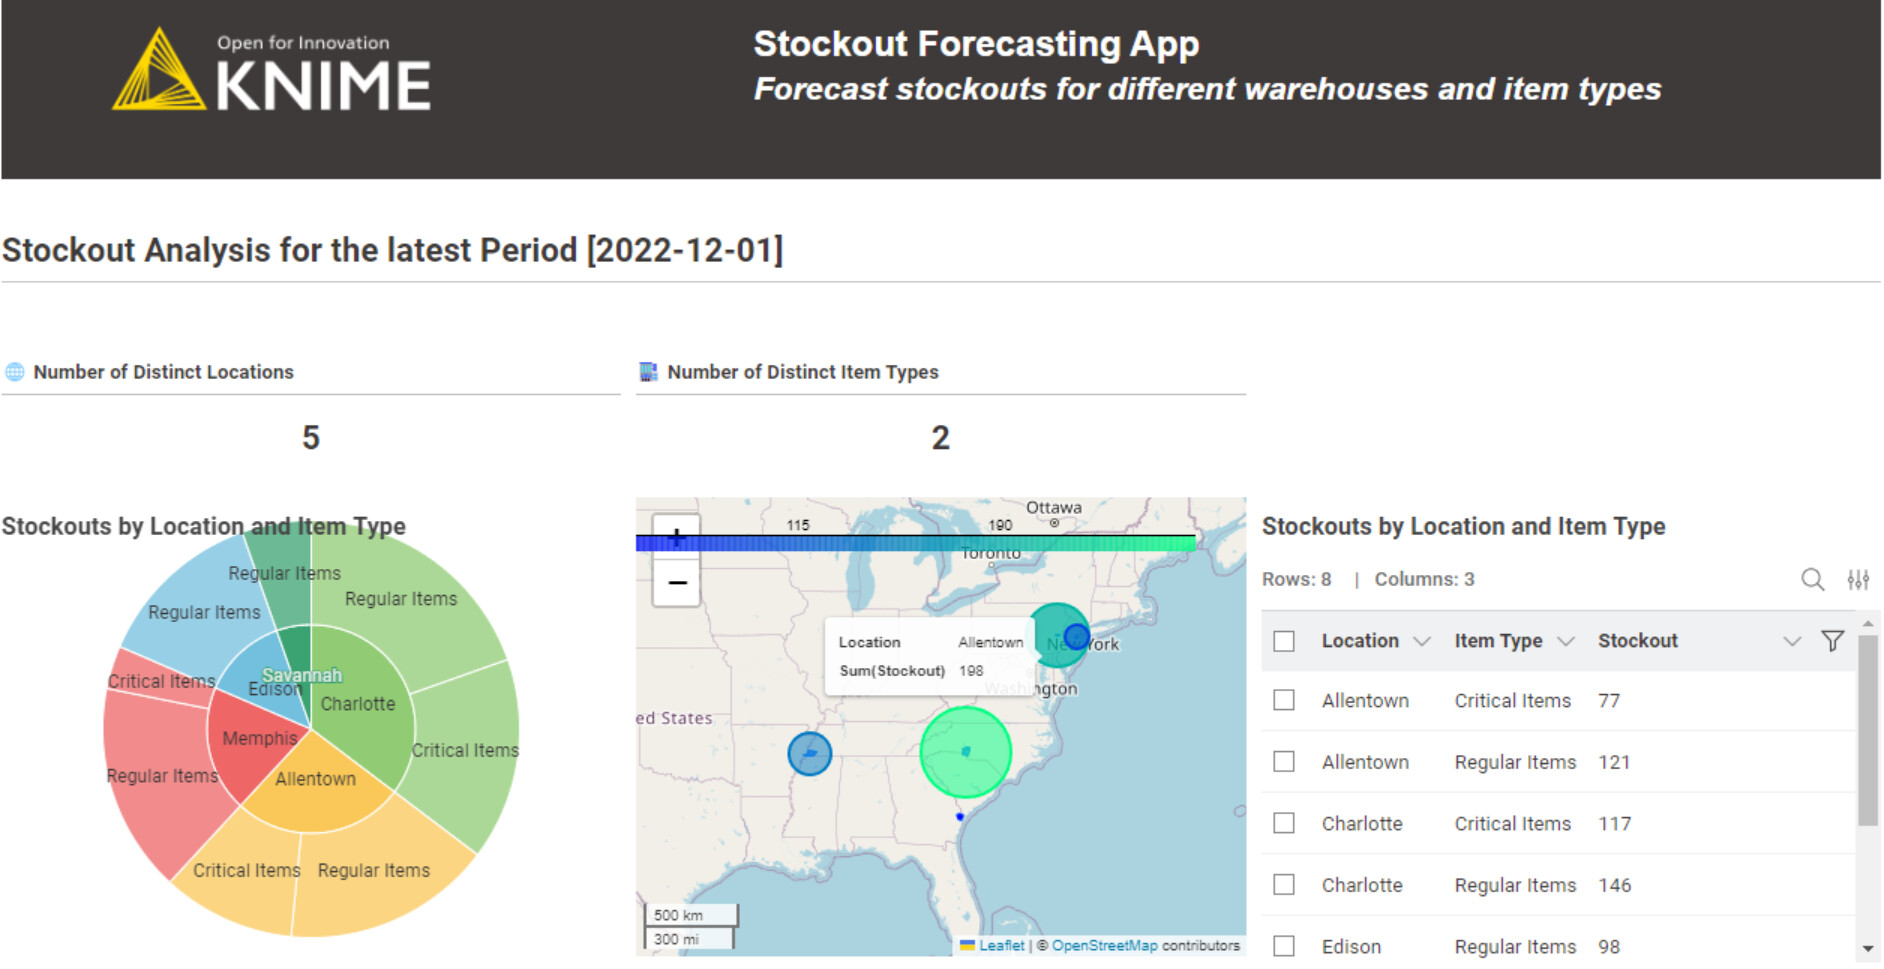
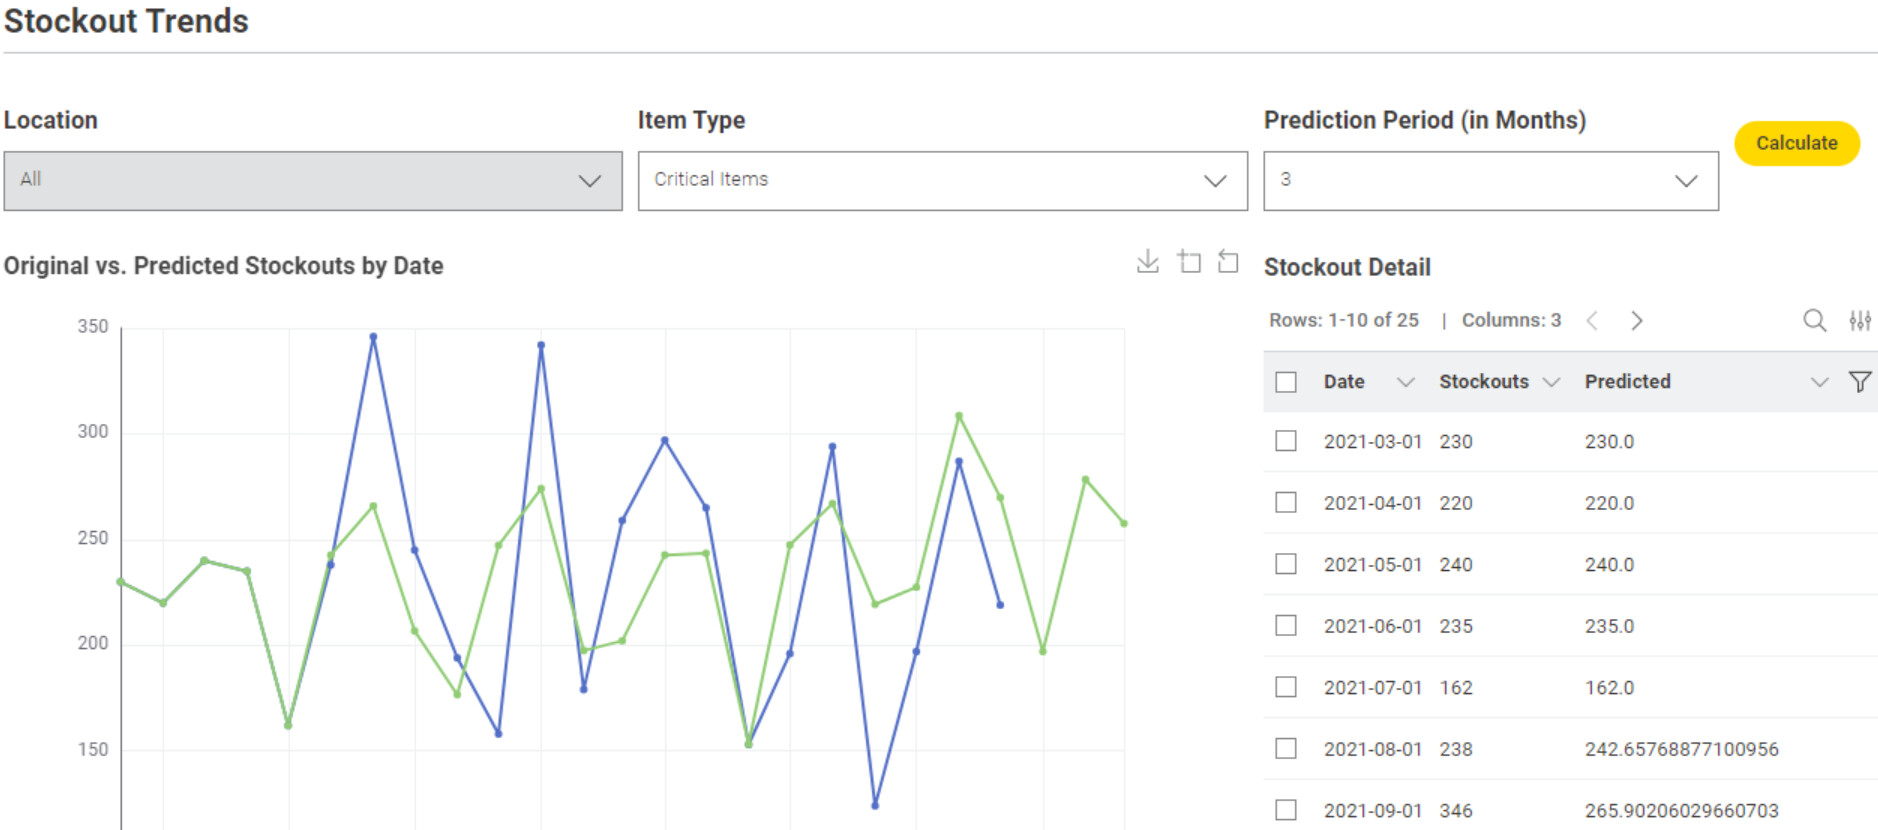
Data Visualization
Present a general overview of stockouts for the latest time period, including the number of distinct locations and item types, as well as the distribution of stockouts across both. I also explored incorporating a geospatial view and attempted to use the ECharts map view (example link), but unfortunately wasn’t able to get it working . If anyone has experience with it, I’d really appreciate any tips!
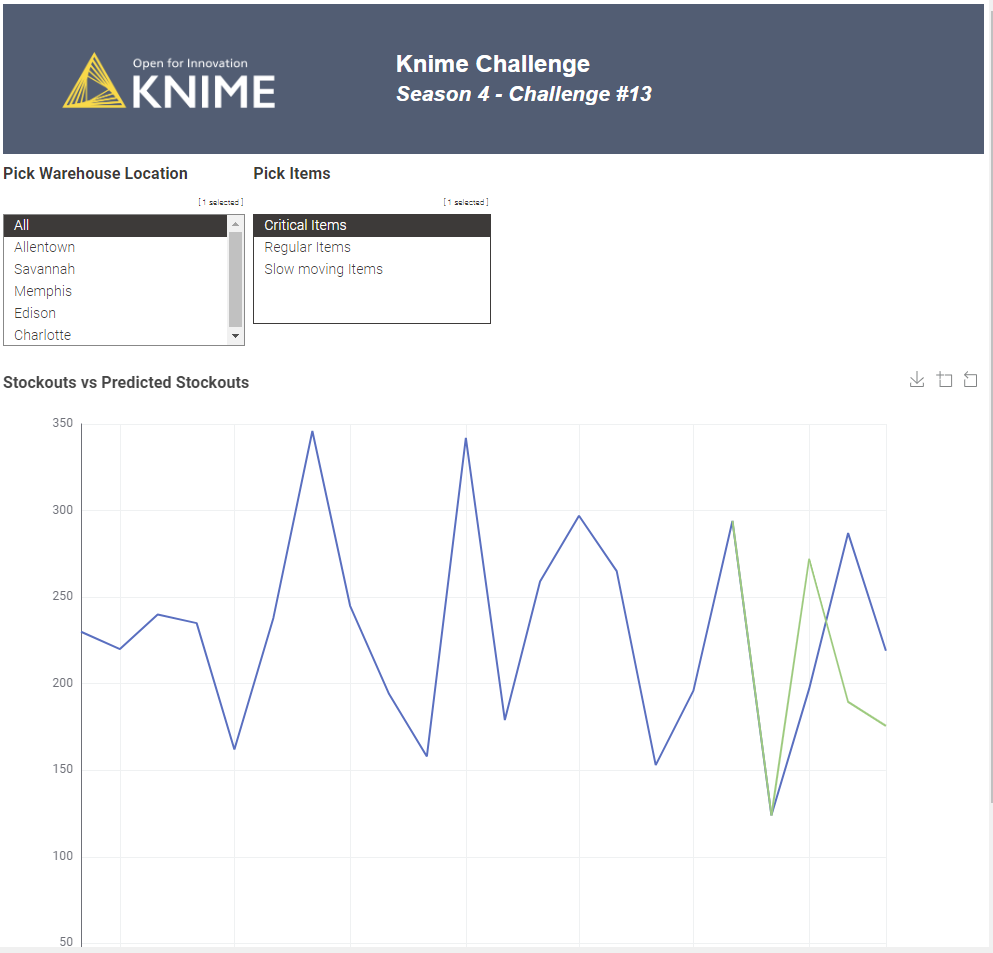
Functionality for users to select the location, item type, and prediction period has been provided. The results display both the actual vs. predicted stockouts, along with the model score and autocorrelation plots for further analysis.
Wow!! outstanding scoring with your ML model! — truly impressive work! I can’t wait to review it on my PC once I’m back from vacation (unless the developers surprise us with a tablet or smartphone release!)
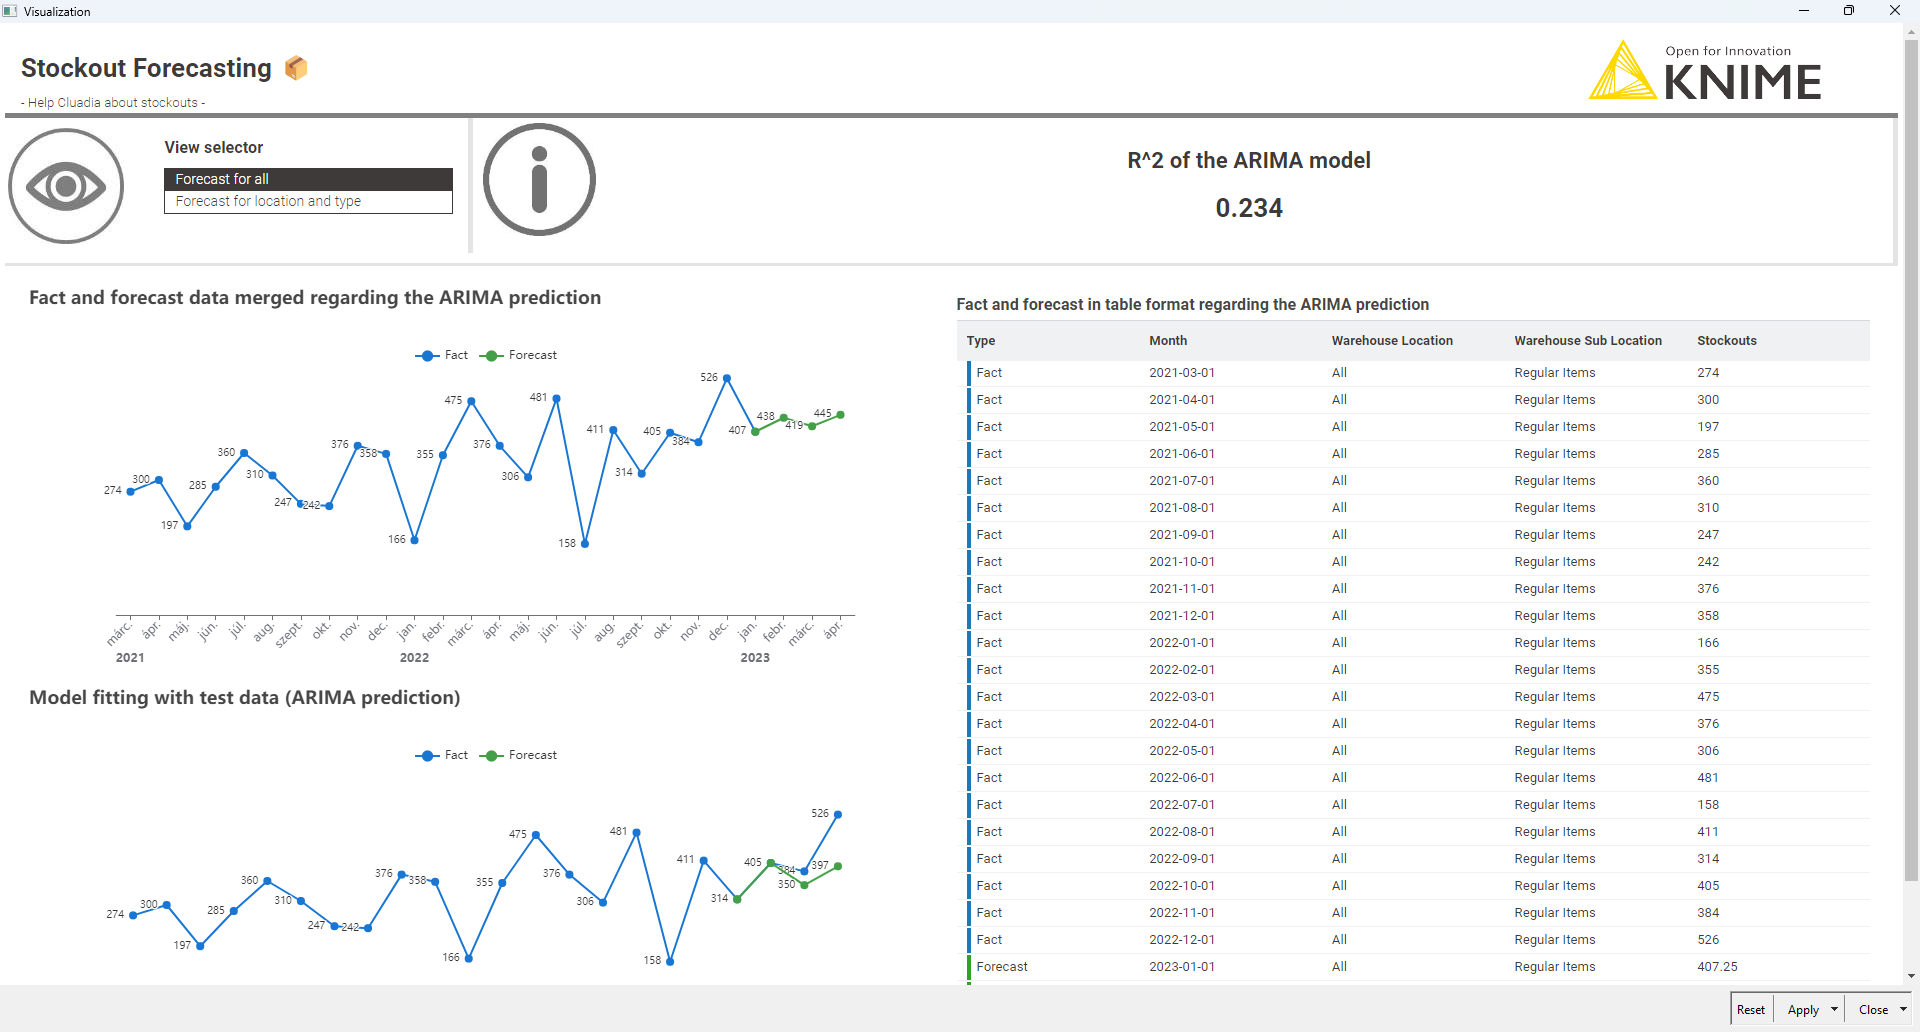
Creating an ARIMA prediction for the type: ALL (top part)
2.1 If the score was acceptable I did a full ARIMA (with the same model) on all of my data
2.2 Visualize the results with the R^2 score
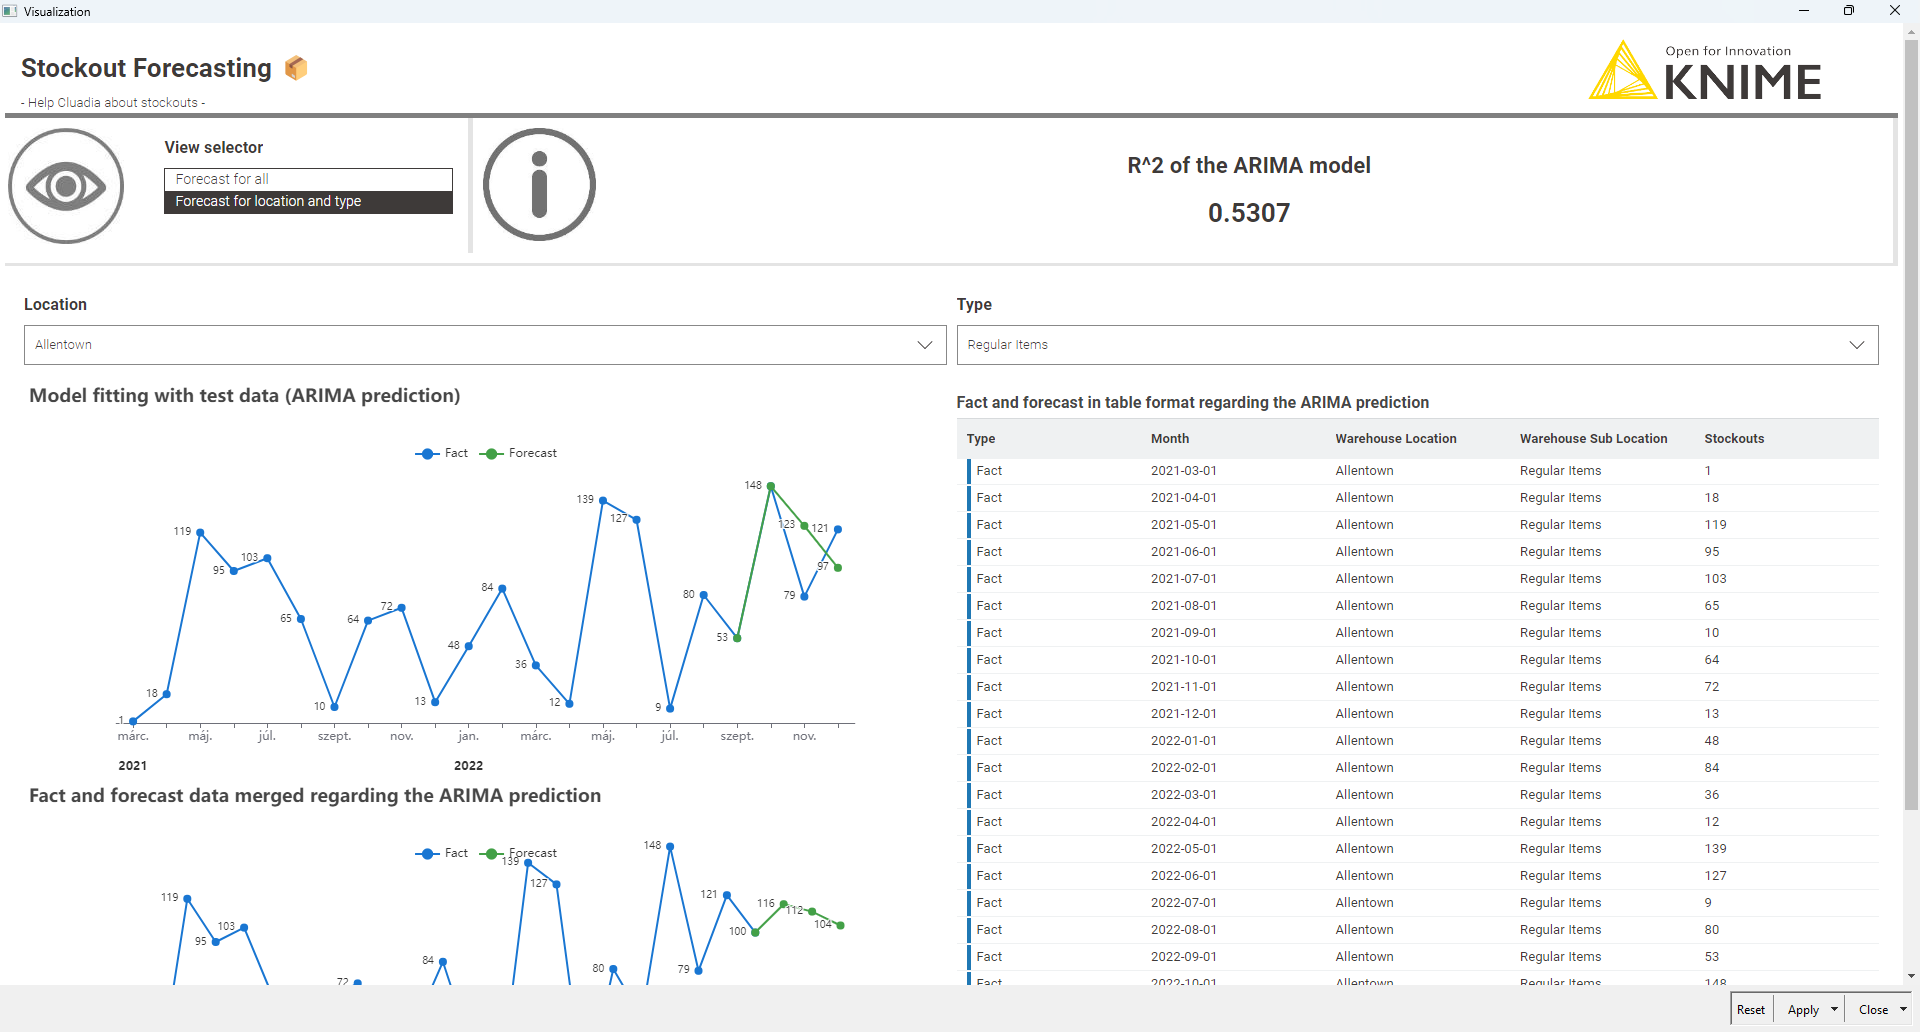
Did the ARIMA prediction for all the combinations of locations and sub locations (I did it outside of the component to not hurt the performance, not relevant here but could be if there would be a lot of data)
3.1 I did the predictions in a loop for all the combinations (for error catching I used the try catch nodes)
3.2 I have created the visuals interactively reflecting the selections
I think it was a cool challenge, and it’s so good to see all the perspectives that other KNIMErs gave me
We just posted our solution to last week’s Just KNIME It! challenge!
We were excited to see many people in our community studying time series forecasting and using this challenge as an opportunity to become more well-rounded data professionals. Besides the many forecasting and data visualization techniques that were explored, it was also very nice to see some of our users implementing error handling techniques for a smoother user experience.
We hope you join us tomorrow for a challenge on news scraping!