Solutions to "Just KNIME It!" Challenge 14 - Season 3

:sun_with_face: Did you already have breakfast? :avocado: How about some avocado toast with a new Just KNIME It! challenge? :grin:

:alarm_clock: This week you are invited to explore different time series analytics techniques to forecast the price of every millennial’s favorite fruit to eat with toast: avocado!

Here is the challenge. Let’s use this thread to post our solutions to it, which should be uploaded to your public KNIME Hub spaces with tag JKISeason3-14.

:sos: Need help with tags? To add tag JKISeason3-14 to your workflow, go to the description panel in KNIME Analytics Platform, click the pencil to edit it, and you will see the option for adding tags right there. :slight_smile: Let us know if you have any problems!

2 Likes

Hello, this is my solution.

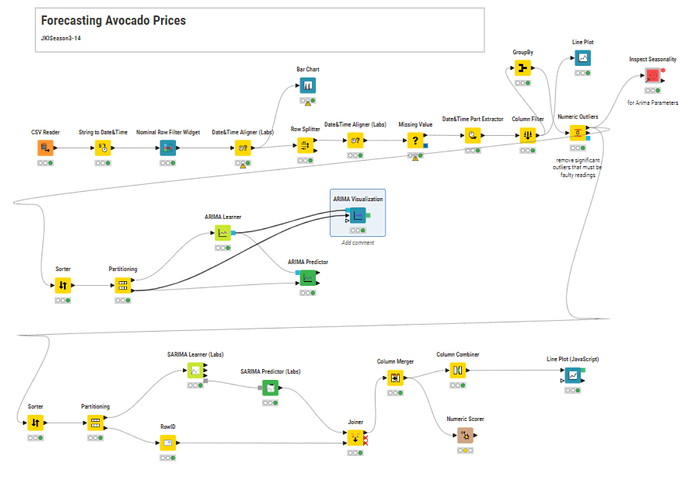
Arima Node is simple and the model is fast.
It is easy to do parameter optimizations.

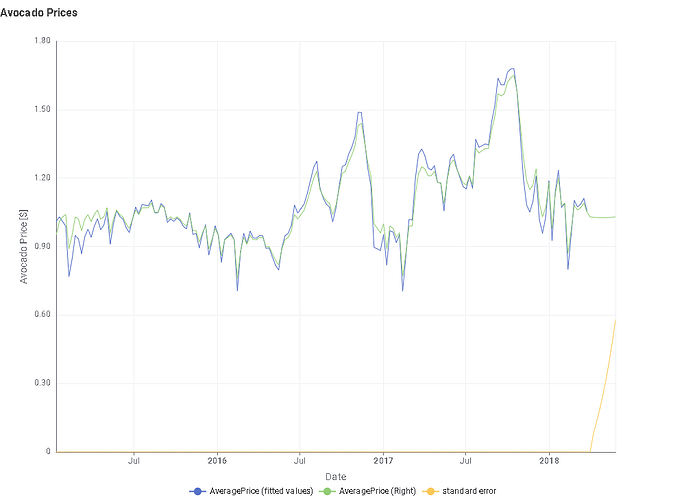
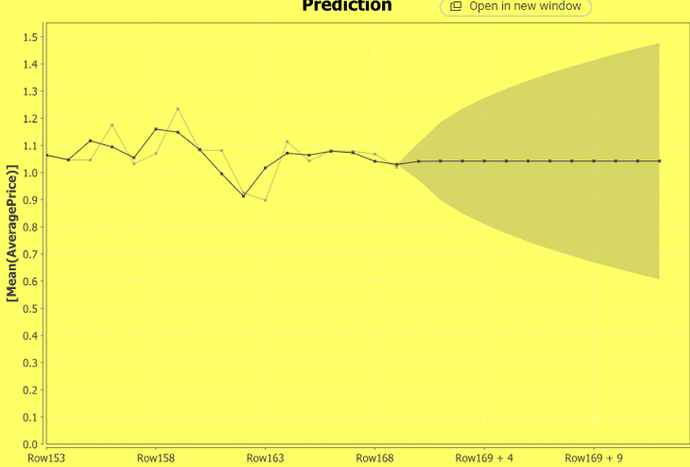
To score for SARIMA I excluded last 10 dates from learner and compared the predicted prices to the listed ones.


As SARIMA is more complex, on my computer it takes extremely long to calculate results.
So I stopped further optimization. But with more optimization the results seems to be good.
Why does SARIMA Predictor node has no table input?

4 Likes

Hi @alinebessa

:sun_with_face: Good morning from Jakarta! Just uploaded my first solution for the “Just KNIME It!” Challenge 14 - Season 3.

It’s a work in progress, and I’ll keep improving it in between work tasks. Let’s keep the passion for learning KNIME Analytics Platform alive! :fire::ninja::bar_chart:

4 Likes

Hello everyone,
This is a very challenging task for me. I’m not confident due to my lack of knowledge in Time Series Analysis. I would greatly appreciate any feedback on mistakes or misinterpretations. Anyway, I have created a workflow. I wasn’t sure how to determine the parameters for the SARIMA model, but the excellent materials below provided me with some hints. I think, however, there is still plenty of room for optimizing the parameters. Thanks.
[Slides - [L4-TS] Introduction to Time Series Analysis (knime.com)]
(https://www.knime.com/sites/default/files/2021-08/l4-ts-slides.pdf)

6 Likes

Find my initial try …


3 Likes

Hi all,
Here is my solution.

In this time, I have referred to the material shared by @tark .
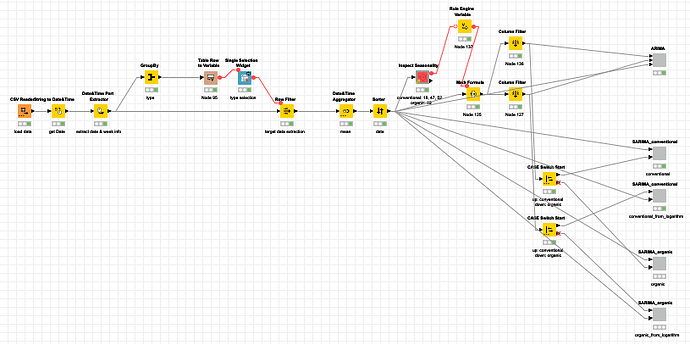
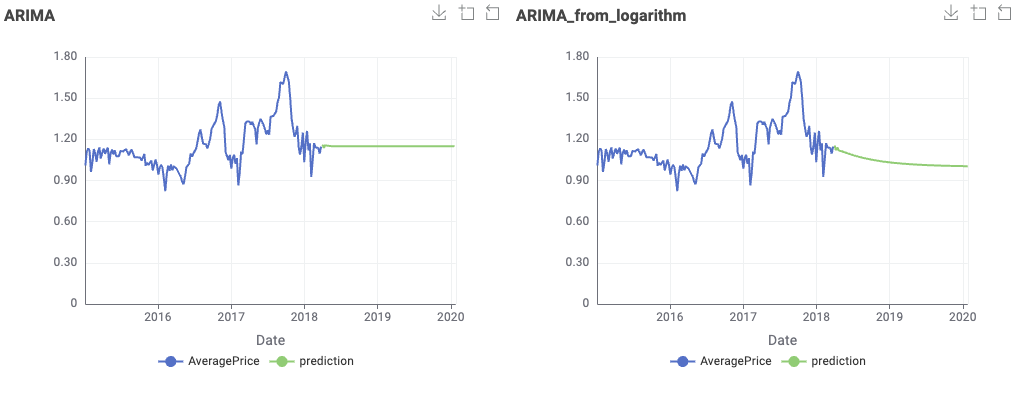
I also compared the ARIMA and SARIMA methods and tried the way of converting prices once into logarithms before forecasting.
As a result, SARIMA appears to give more plausible results than ARIMA.

I have also tried Auto-ARIMA component, SARIMA Learner component, and SARIMA Predictor component, which can be downloaded as Examples from the KNIME hub, however they had a bug in the internal python Script nodes, so I have edited them myself with reference to this thread.
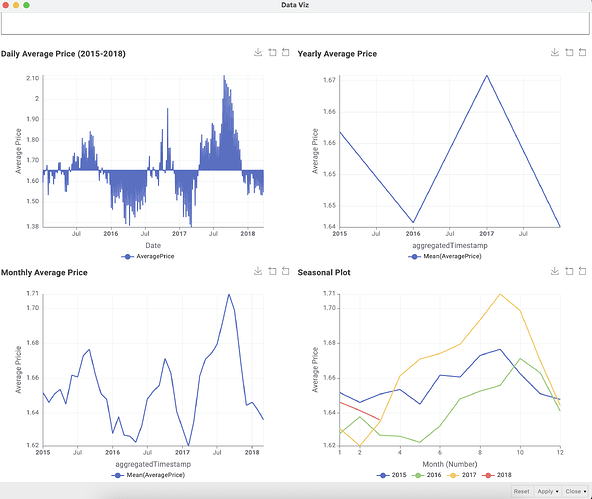
Some screenshot of the results are attached as my solution takes a very long time to run all the nodes.


To be honest, due to my limited knowledge of time series prediction, I could not come to a conclusion on which method is the most appropriate, but I hope it will help you! :raised_hands:

4 Likes

Hi all,
Here is my solution.

I used the past year’s price data for organic (April 2017 to March 2018) as validation data to optimize the parameters for both ARIMA and SARIMA models. The results of these examinations are saved in my workflow. Due to the long execution time required for SARIMA, I used Bayesian optimization for parameter tuning. Even so, it still took a very long time to complete.

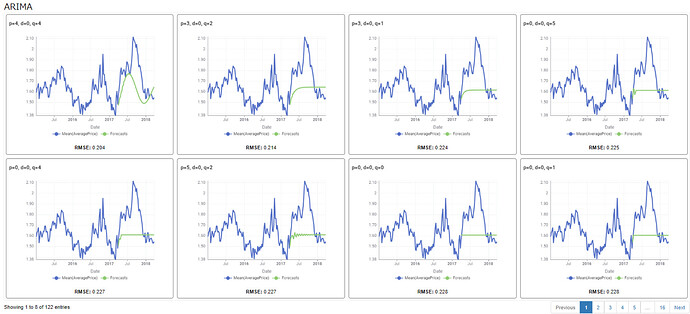
ARIMA (Parameters optimization)

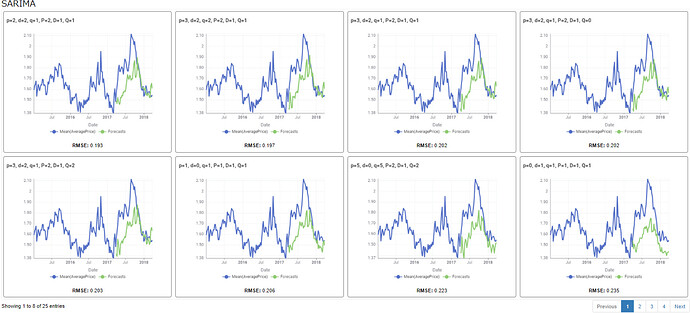
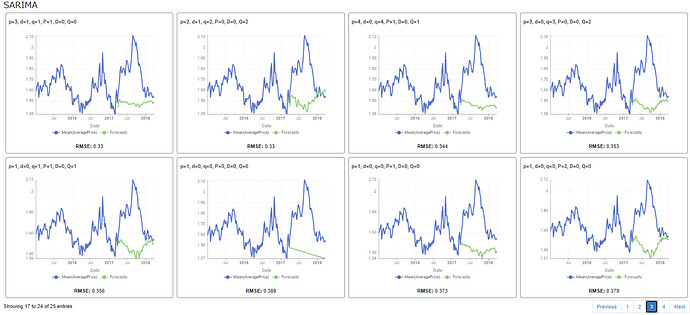
SARIMA (Parameters optimization)
It does not seem to predict well when D=0.


6 Likes

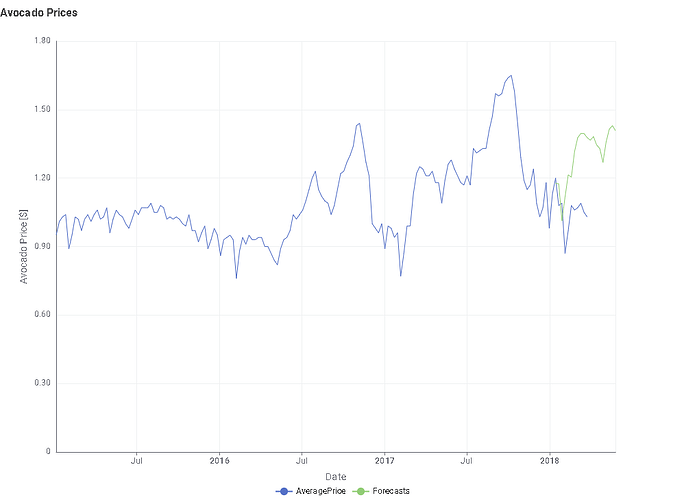
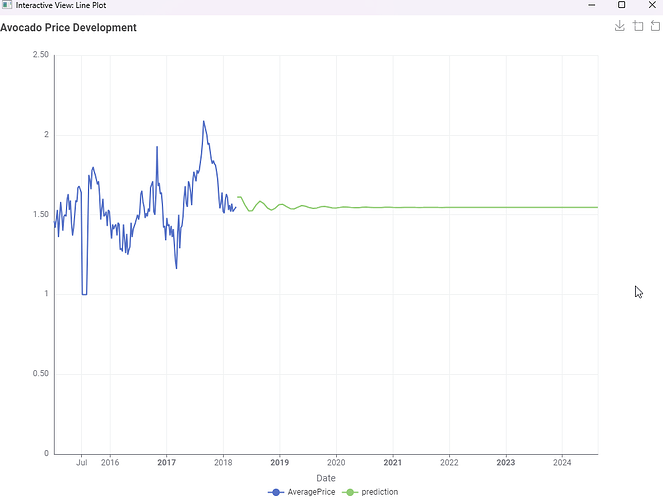
Getting one on the board here as well. TS not my strong suit but think that SARIMA could help given that there is some clear seasonality just looking at the source data, however ARIMA predicts (at least for me :D) a fairly linear development.

3 Likes

Hi all,
Here is my solution.

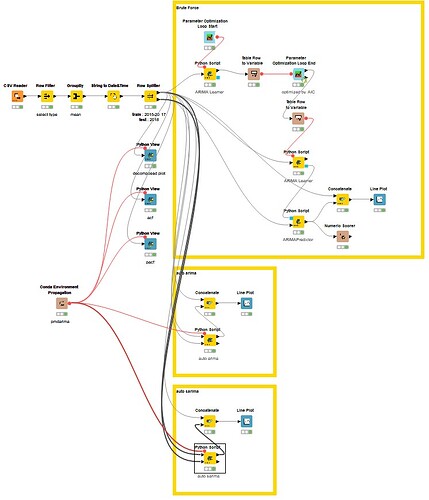
I have implemented ARIMA and SARIMA using a Python script in the Node environment. Two types of hyperparameter tuning techniques were employed: one using the KNIME Optimization extension and the other utilizing the Python package pmdarima.

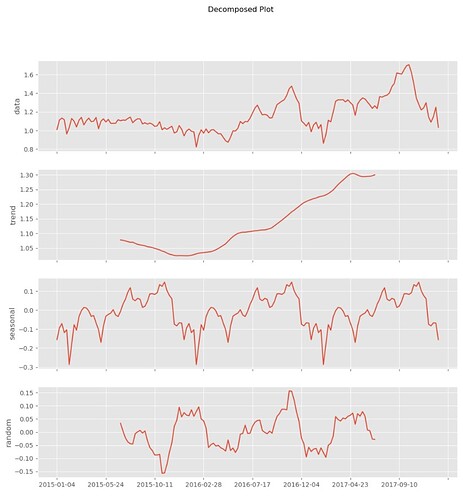
Through pmdarima, it is also possible to generate various plots such as decompose plots and auto-correlation plots.

The .yml file for the Conda environment used to construct this workflow is stored in the data directory.

3 Likes

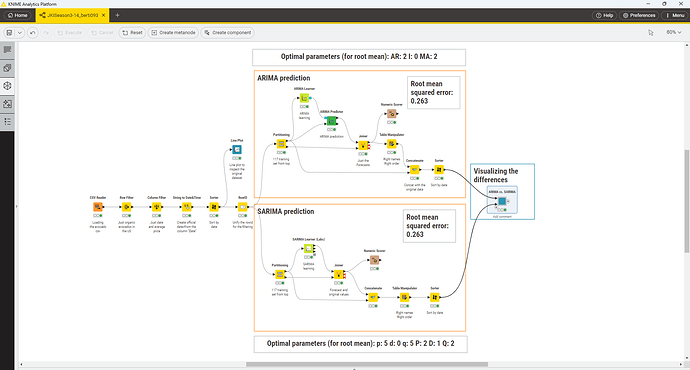
My solution for the challenge. I understand the description: filtered for type = organic, region = TotalUS.

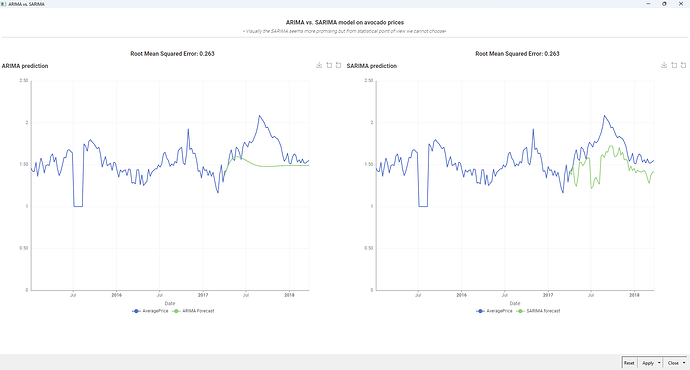
Both the ARIMA and SARIMA (with optimized parameters) have a root mean squared error: 0.263.

Visually the SARIMA seems more promising but regarding the numbers we cannot choose.

I have drawn extensively from the previously uploaded solutions. :slight_smile:

For me the SARIMA learner was very very slow: One run was typically 10-15 minutes (one time it was one hour) :frowning: I do not know if it occurs for someone else.

3 Likes

Here’s my solution. I didn’t use SARIMA although it might produce marginally better results for long term projections. I assumed the projection would be used by retail buyers so I used a short (4 week) projection. I also added an fbprophet component developed by @roberto_cadili. If you reset my workflow you’ll need to install an fbprophet environment. The Conda Environment Propagation can be found here:
https://forum.knime.com/uploads/short-url/in1VJEudLPMAdHGbItMtL7rO1oJ.knwf

3 Likes

Hello everyone, this is my solution.This workflow should only run on versions above 5.3.*, because after 5.3, the SARIMA node has changed its extension.

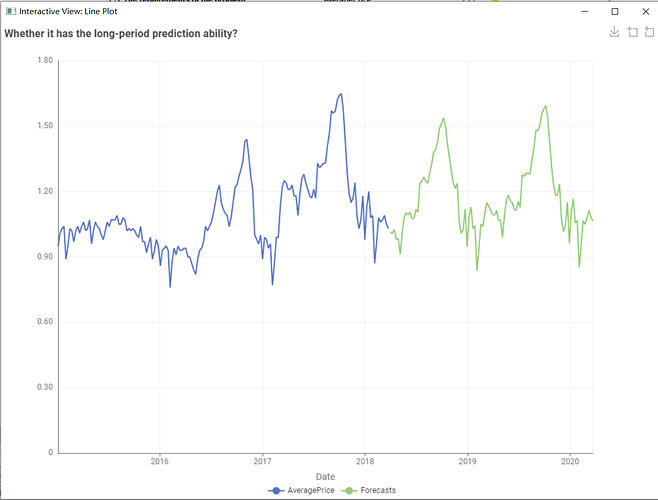
Regarding the confirmation of the hyperparameters of the SARIMA model, I also encountered the problem of overly long calculation time. Therefore, I adopted the method of manual judgment. Manual judgment has subjective factors, but judging from the model test results, the effect is good.

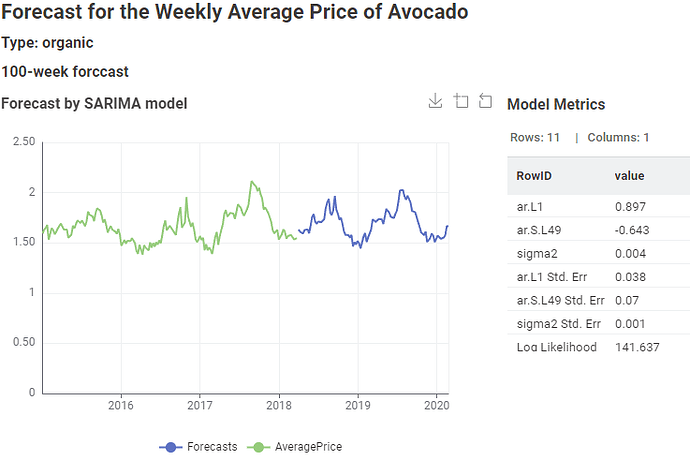
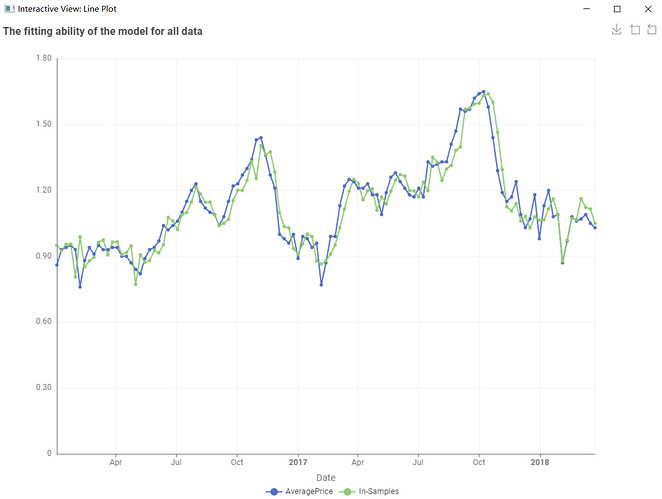
This is the test result where the length of the test sequence is 52.
PS: The test results are strongly correlated with data preprocessing and dataset division.
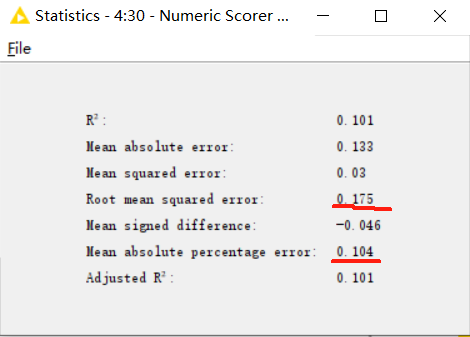
image

Explanation:

1.For data processing, only conventional types of avocados were considered because their sales volume was the largest, far exceeding that of organic types of avocados.
2.In the dataset division part, I referred to @sryu 's method. The retained sequence length of the test set is 52, which is exactly the length of one year. Because if the data is to check for seasonality, at least one complete cycle needs to be examined.
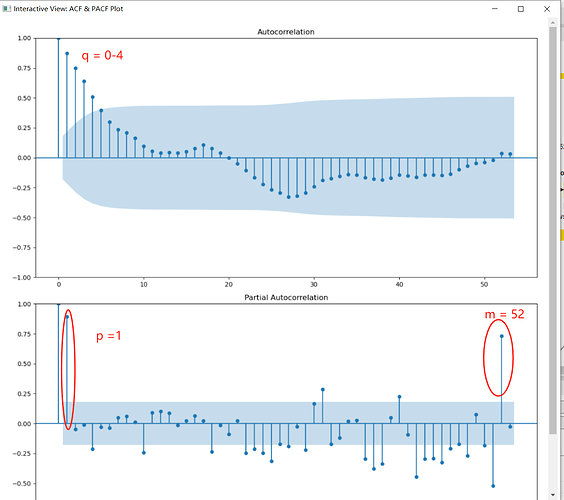
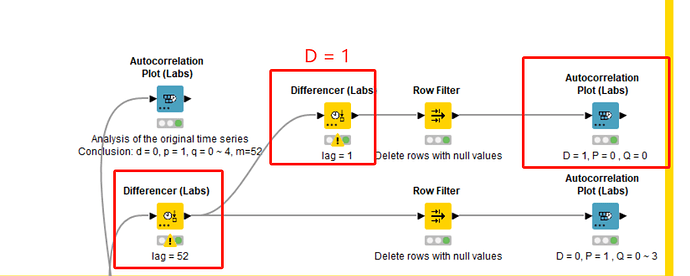
3.Manual hyperparameter judgment, as shown in the following figure:

The ACF and PACF plots of the original data.
PS: The first-order difference graph of the original sequence eliminates the autocorrelation of the sequence. So there is no first-order difference here, that is, d = 0.

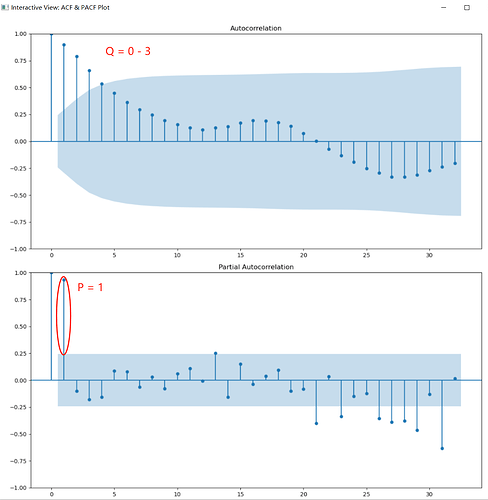
The ACF and PACF plots of seasonally differenced (lag 52).
PS: Here, D = 0 is default. However, if D = 0 in the final result, the trend between years will be lost. So here D = 1 is set.

Result:
(p, d, q)(P, D, Q)m : (1, 0, 0)(1,1,1)52

8 Likes

:sun_with_face: Happy Tuesday, folks!

:avocado: Here’s our solution to the time series challenge we posted last week. A bit more challenging than I was expecting, maybe because time series analytics is a bit of a niche topic in data science. Shout out to @Corey, our time series expert, for polishing our solution. :smiley: I myself don’t have so much experience with the topic.

:hugs: Also shout out to all of you for pulling up your sleeves and really studying the topic, proposing solid solutions! See you tomorrow for a challenge on childcare! :baby: :baby_bottle:

4 Likes

Hey @alinebessa

Just KNIME It! is totally my go-to for learning. :smile: When I downloaded a solution, turns out I needed to install the KNIME Timeseries (Labs) Extension. Never heard of it before, but it’s never too late to learn, right? :thinking:

Keep pushing through Just KNIME It! every week! :ninja: :fire:

Happy KNIME’ing from Indonesia :indonesia:

2 Likes

@tomljh Your solution was selected as the highlight of the week, by the way! Check the shoutout here! :smiley:

3 Likes

Thank you very much for receiving this honor. :smiley:

I have made a little improvement again. The model can be changed to
(p, d, q)(P, D, Q)m : (1, 0, 0)(0, 1, 0)52
, which will obtain slightly better performance.

5 Likes

Hello Everyone
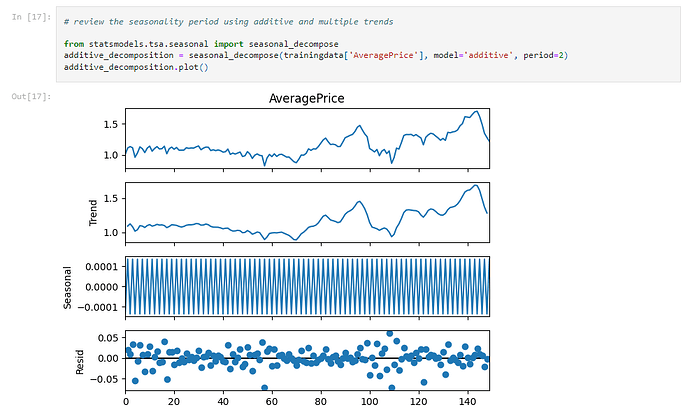
Even though I may be joining the discussion very late, I still wanted to share my workflow with the community. I made the decision to compile all of the region-specific data into a weekly time series dataset. I then assessed the seasonality metric using the seasonal decompose command in the statsmodel library (individually).

I decided to assess it individually because I had trouble using the KNIME Python script to turn the Seasonal Decompose plot output into an image within the workflow.

Github Jupyter Notebook

Manually simulating the numbers for seasonality within the code allowed me to consider seasonality period (m) =2 (Fortnight) as the preferred option [Other tested inputs - 4 (M), 12 (Q) and 24 (HY)]

Since I was having trouble seeing any seasonality in the PACF and ACF plots, I decided to employ the auto-arima option independently. My determination of the value of p = 1 was aided by the PACF plots and Autocorrelation Node, and my auto-arima experimentation helped me determine the final values of P = 2 and Q = 0. Despite my attempts to run auto-arima in Python, the code was not evaluating the q value range that I provided, hence the value of q remained unclear to me. Therefore, I made the decision to execute the SARIMA learner using KNIME’s parameter optimization loop and choose the value of q that has the maximum AIC value.

I have chosen to consider 150 weeks of data as part of my training set and 19 weeks data as part of the test dataset. I primarily ran the following models and evaluated their effectiveness using R^2 measure using the Numeric Scorer node –

  • SARIMA (best)
  • ARIMA (assuming no seasonality)
  • Prophet (Lowest Numeric Scorer)
  • NeuralProphet (Lowest Numeric Scorer)
  • Winter-Holt Exponential Smoothening (second-best and close to SARIMA)

Despite the fact that none of the models’ R^2 scores were able to reach zero, the assignment as a whole improved my time-series problem-solving technique, which will help me as a business decision-maker and improve my ability to collaborate with data scientists on my projects. The task also made it clearer to me how, in comparison to how we handled similar situations more than ten years ago, having in-depth business expertise combined with the resources provided by KNIME enables us and our teams to take far more educated decisions much more easily without the need for complex IT applications.


Best Regards,
nilotpalc