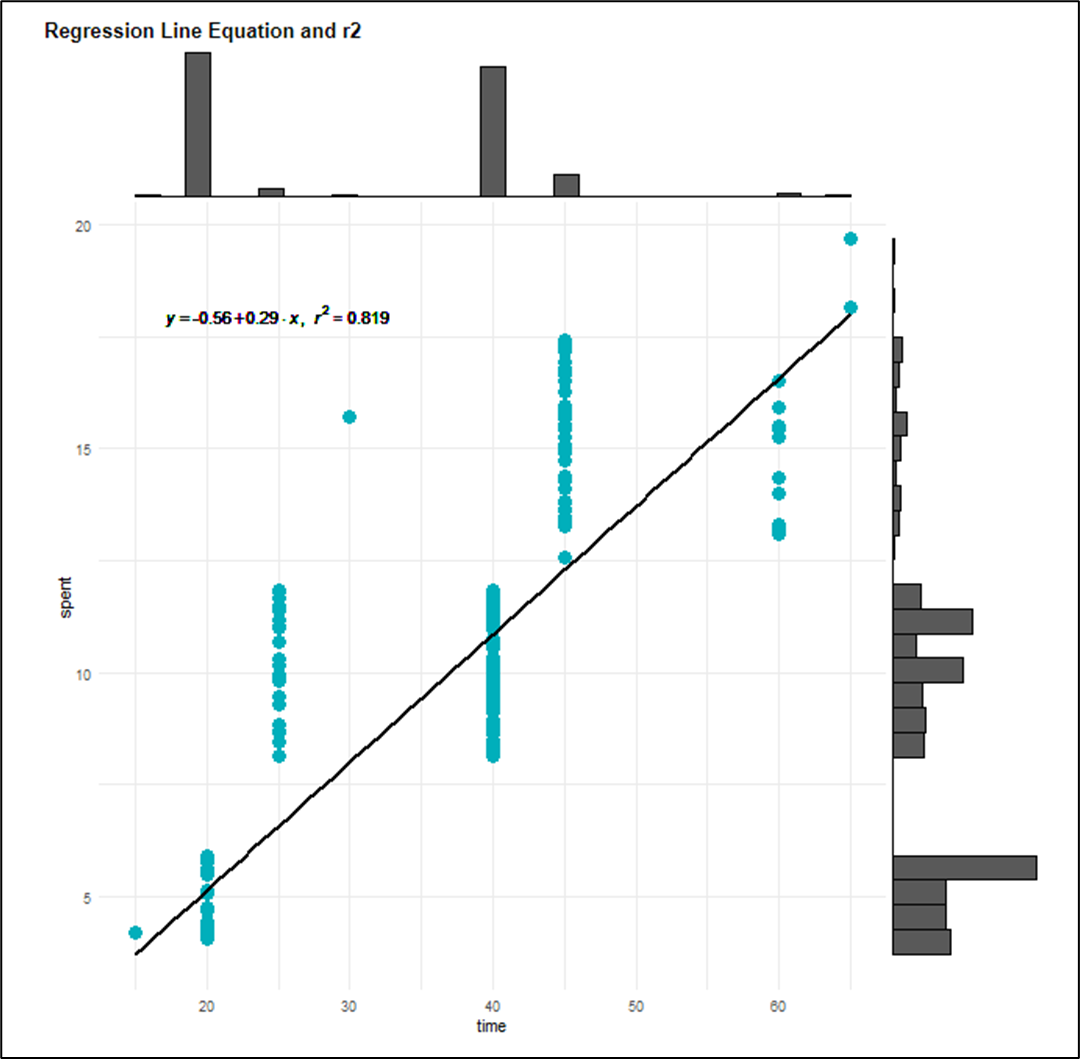
The results are presented in a dashboard with the top 10 spenders in a table; and a scattered plot ‘time spent’ vs ‘money spent’ showing the linear correlation and r2 regression line fit.
The plot is scripted in R finds correlation with a r2 coefficient == 0.819
@Christian_Essen I do see your point! To have a statistically sound approach here, we’d probably need a (much?) larger sample. A possibility would perhaps be to use the SMOTE node to oversample the data, but this could imply keeping the statistical properties of the current data (and are they true? hard to know)… Maybe using a better model to generate more data, probably relying on more domain expertise, would be a better way to go here.