Feel free to link your solution from KNIME Hub as well!
Have an idea for a challenge? We’d love to hear it! Please write it here .
And remember: the more you participate, the more participation badges you may end up getting. Fancy, huh? Just remember to correctly mark your solution in the Hub with tag justknimeit-21.
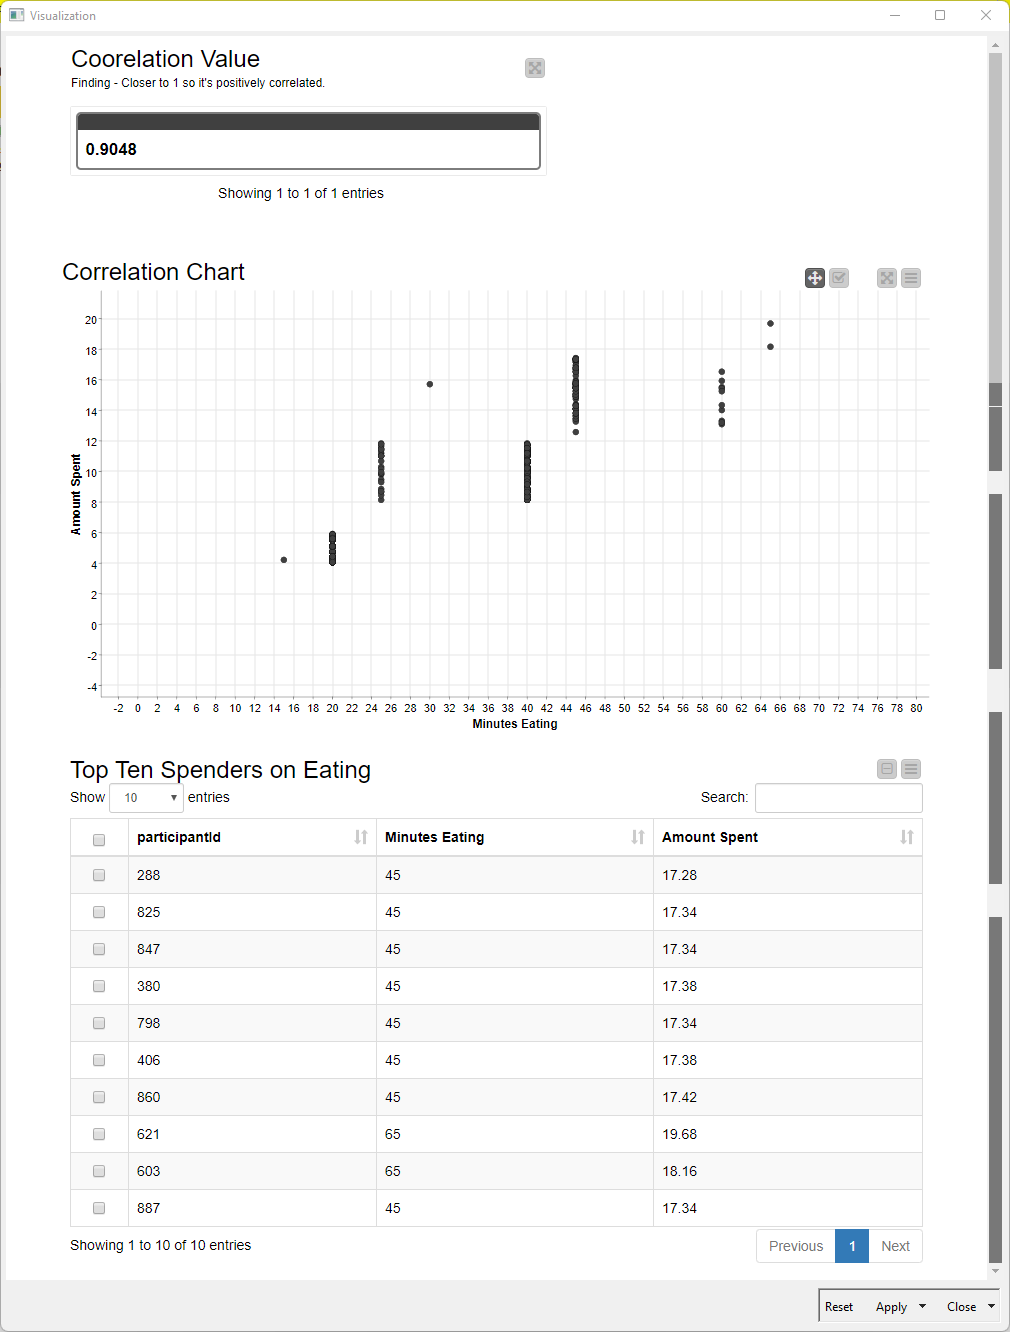
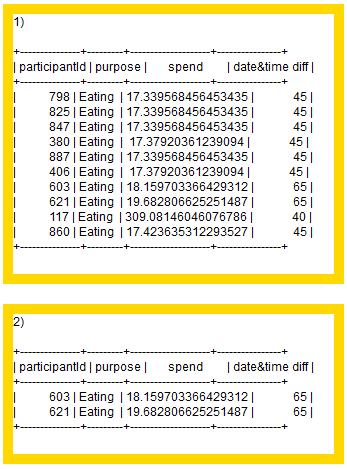
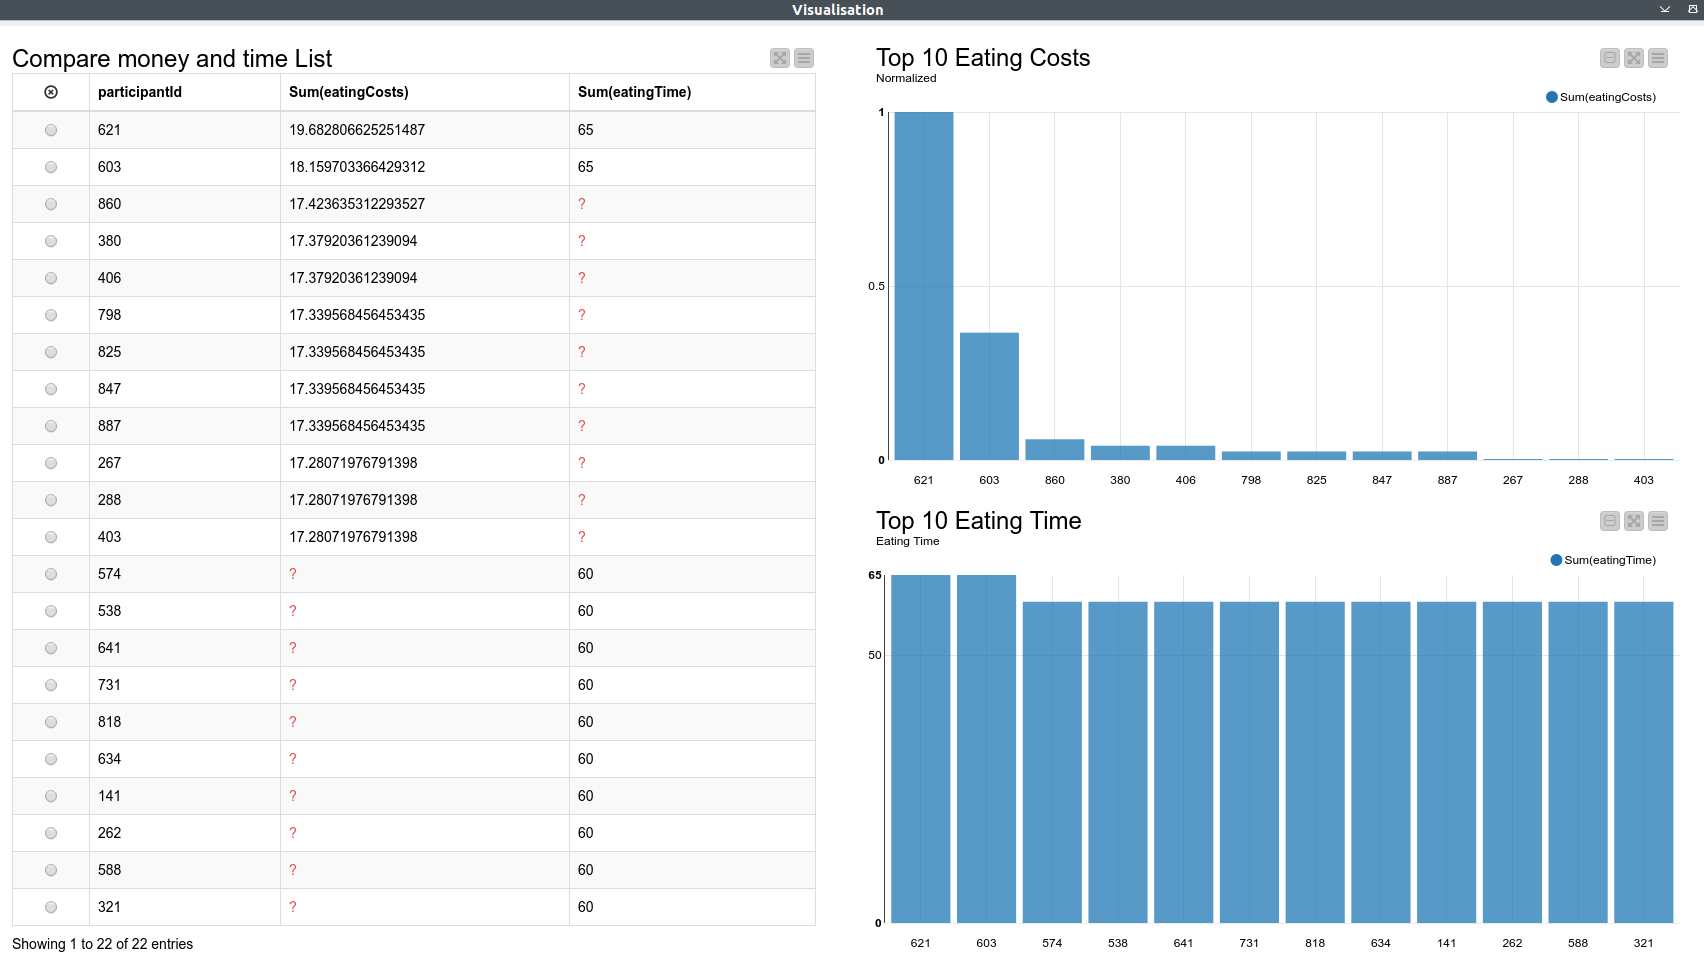
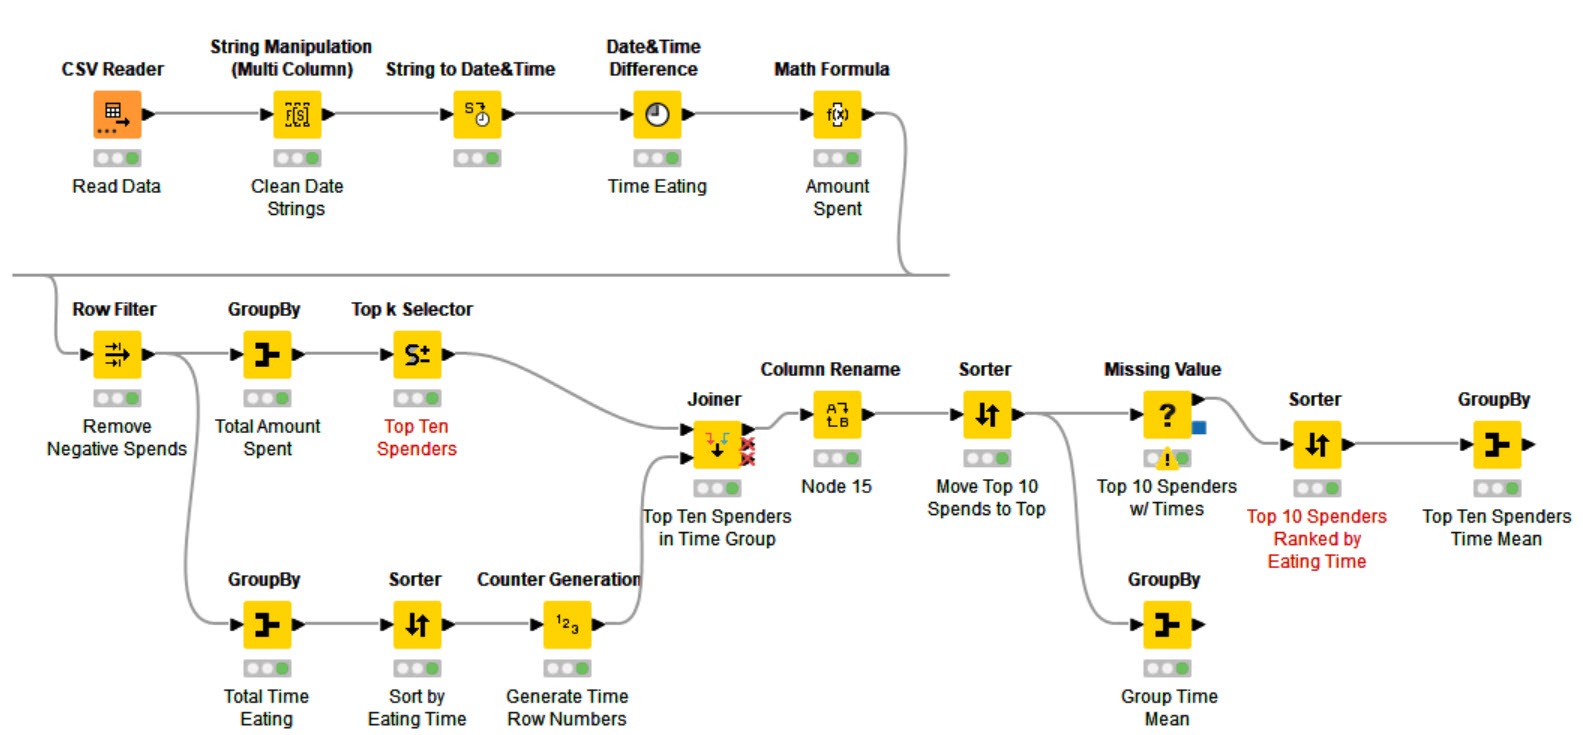
The top 10 are actually a top 12 because if we take the money spent as ranking criteria (and also consider the time spent) we have multiple #1s#6s and #10s. For the #10s there is - as far as I can see - no other way to determine any other criteria that would qualify any one of 3 #10s to be the one to be included in the list, hence it is only “fair” to include all of them
Lessons learned for me: This would be something I would discuss with the stakeholder when I come up with a first solution → is there any other criteria that could limit this list to a “true” top 10?
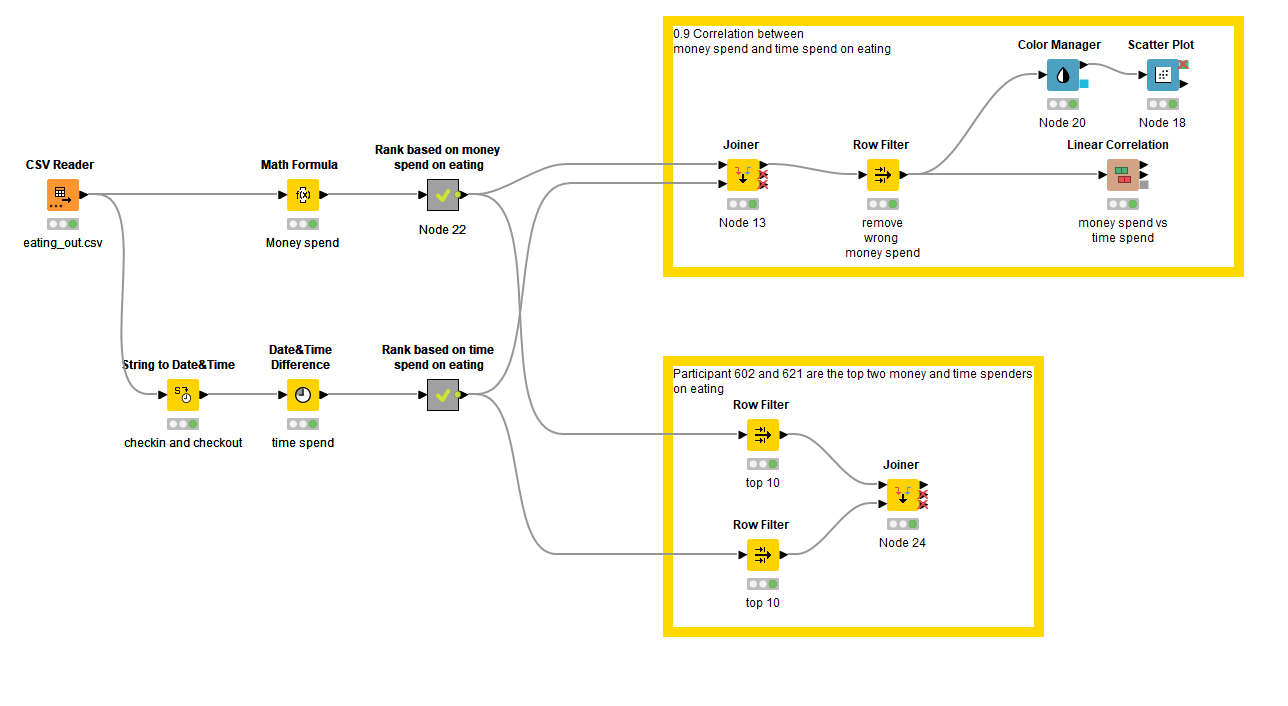
Participants who spend most money are NOT equal to the ones spending the most time. I determined this from the fact that #3 in money spent is actually #13 in time spent.
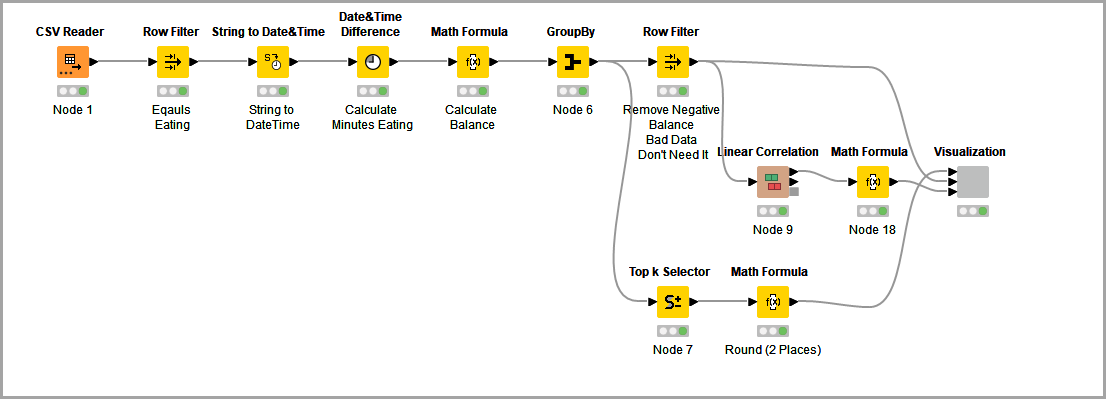
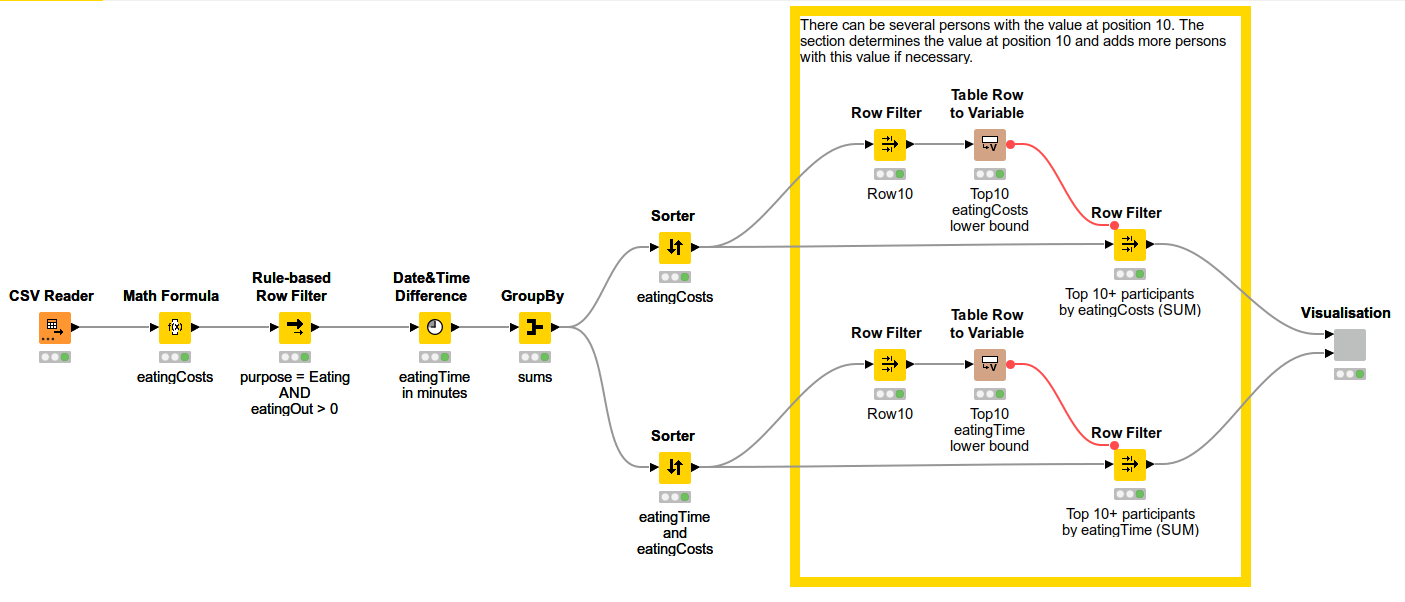
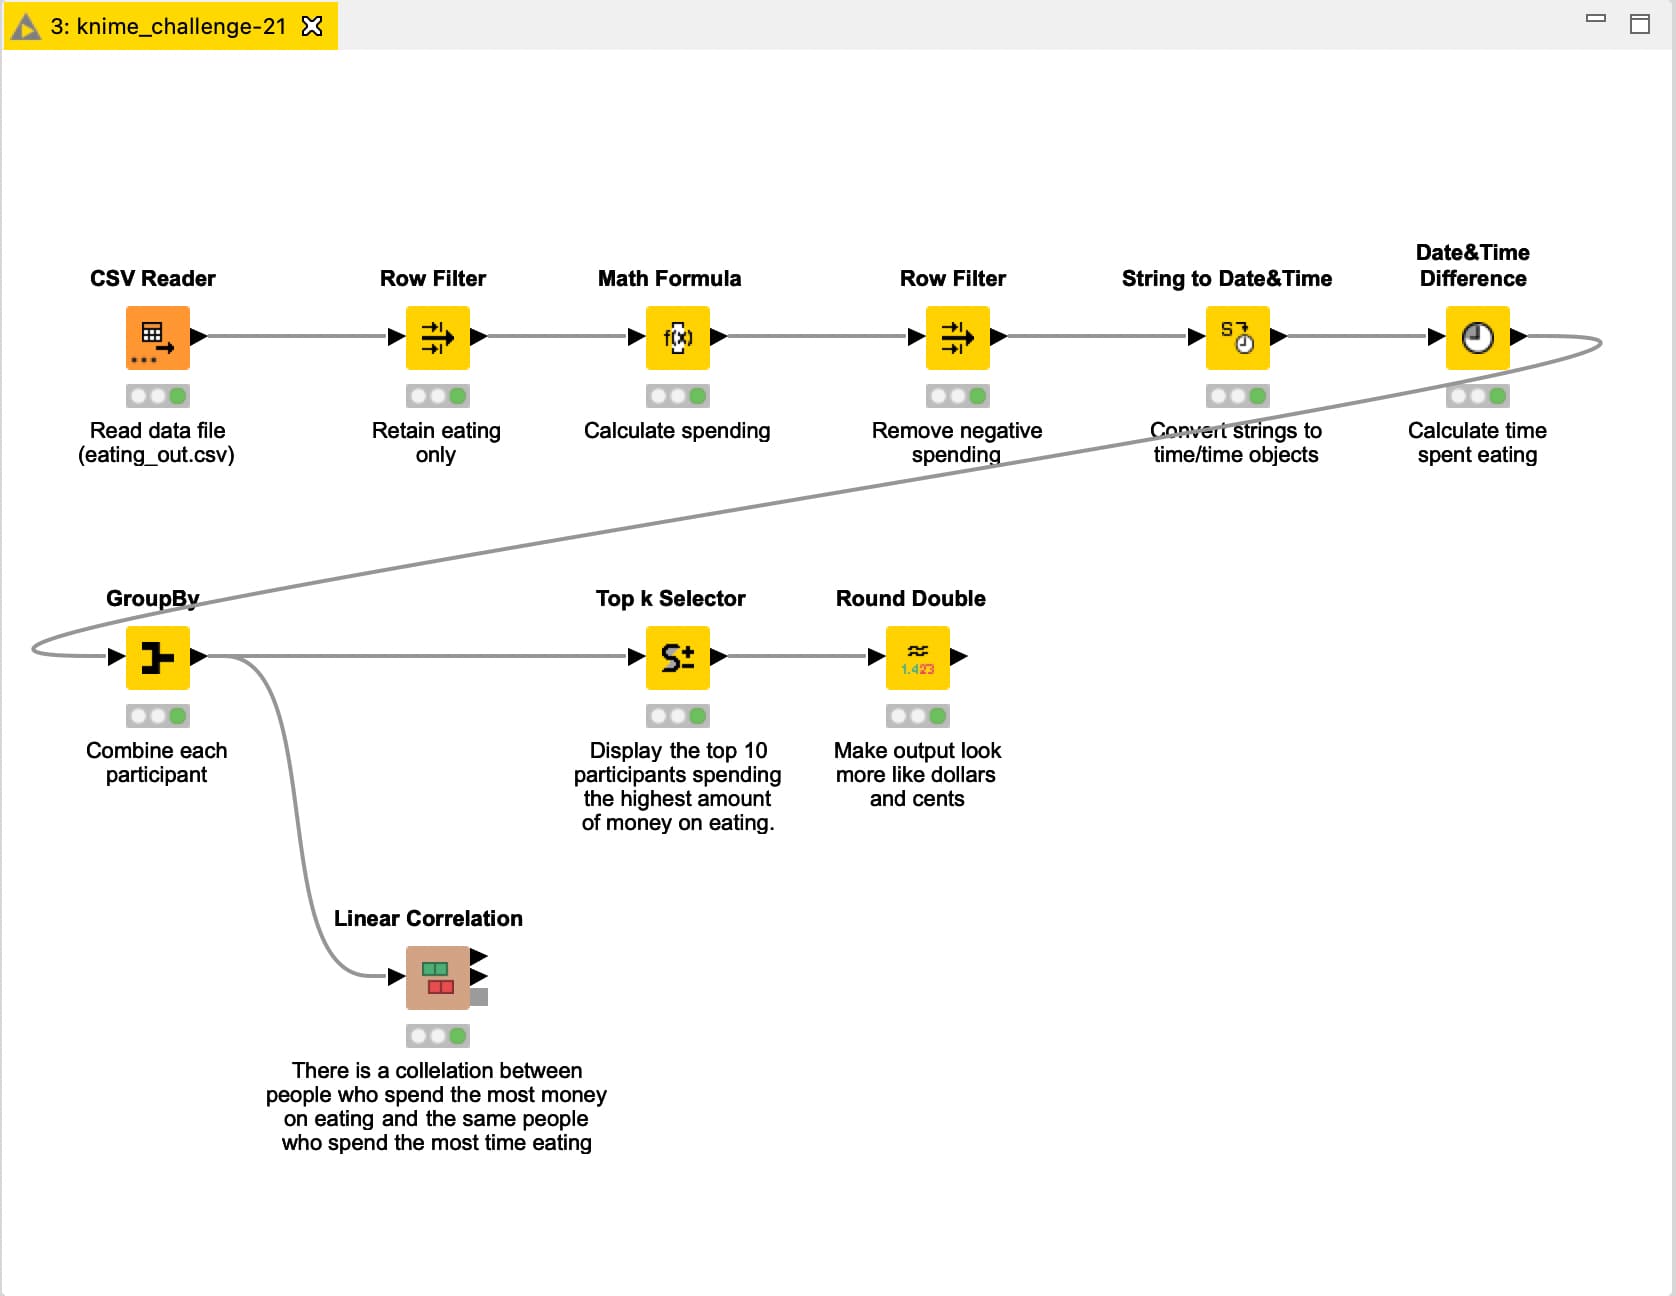
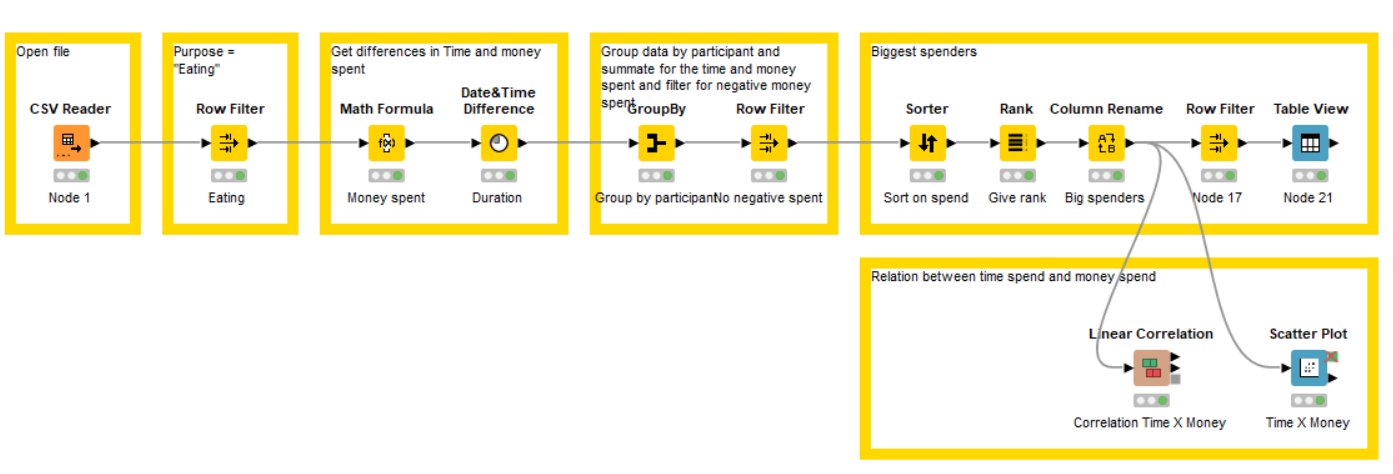
One additional lesson learned (thank you KNIME ): Instead of using String to Date&Time Node, I used the CSV Reader Nodes transformation tab → one node less
Also wanted to work with column expressions, but couldn’t find a way to calculate the time difference with the formulas given (that would then be another node less). Curious how the official solution will solve this
In my opinion, the data set is difficult with regard to a “standard” correlation analysis. This presupposes that the individual observation points are statistically independent of each other. This is not the case for participants, which appear several times in the data set. Among others, this paper deals with the topic of correlation analysis with repeated measures. A mixed-model approach seems to perform best here. However, this is a method that goes well beyond the pure KNIME capabilities.
Grouping of participants, as seen in many justknimeit solutions, would be one way to deal with this, but is not optimal, as one loses information in the process.
An example:
A dataset with only one participant who eats twice in total. Once for 5 minutes for 10 Euro and once for 20 minutes for 20 Euro, i.e. positive correlation. In the aggregated analysis you would see only 10 minutes and 15 Euro.
What do you think? Do you have a suggestion? Or do I see the whole thing totally wrong?
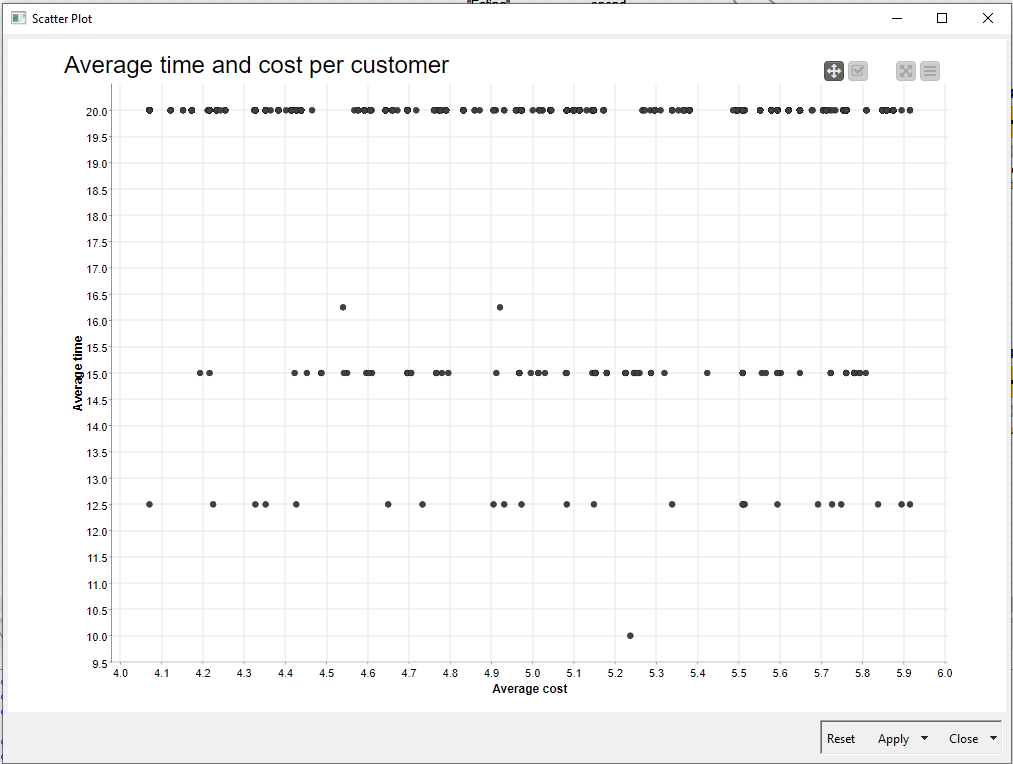
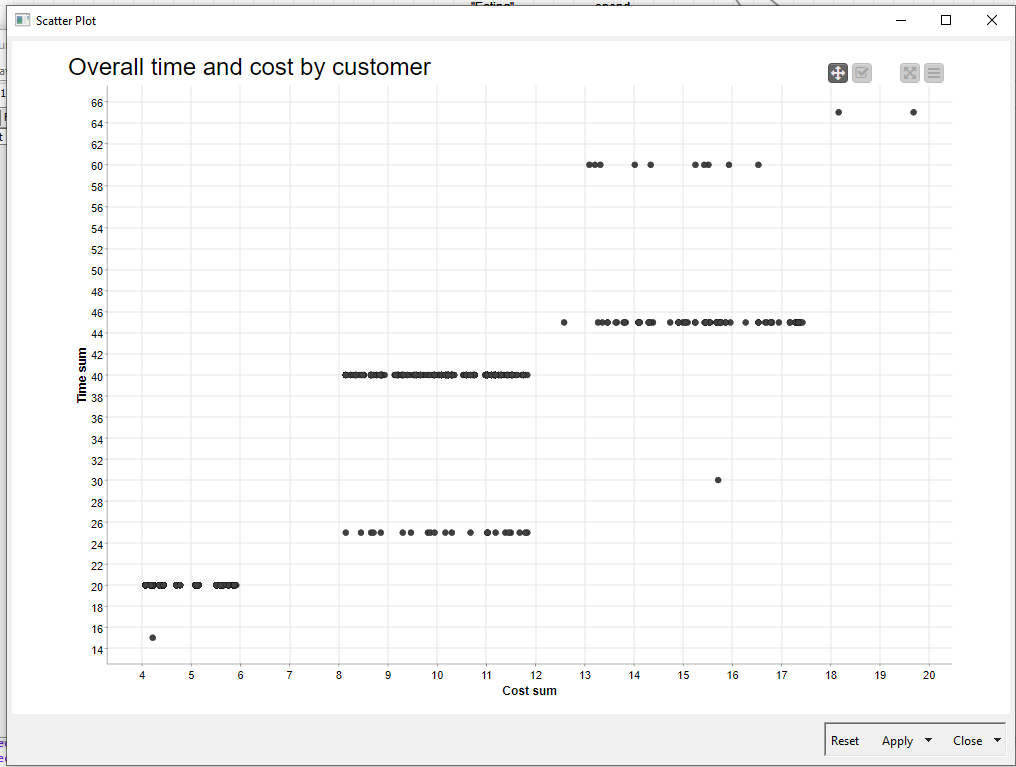
I made two outcomes for the challenge, (1) using total amounts regardless of the participation rate, (2) using average amounts based on total amounts divided by participation rate