Happy Wednesday, folks! We just posted a new Just KNIME It! challenge.
Cohort analysis is widely used by businesses when they want to track customer retention (a proxy for loyalty) over time. Don’t miss out on this challenge if you want to hone your business analytics skills over some real-world purchase data!
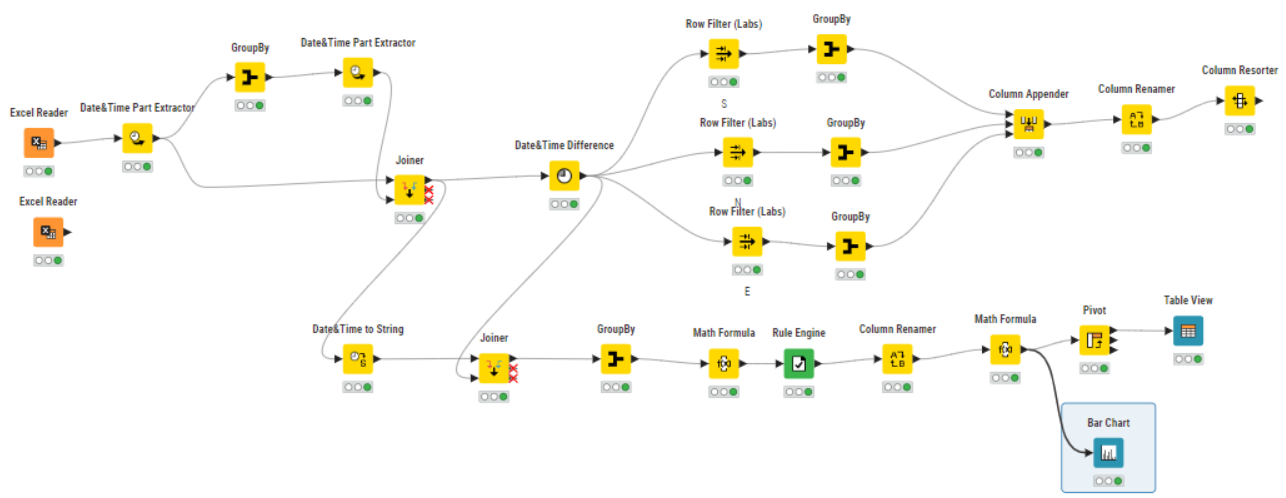
Here is the challenge. Let’s use this thread to post our solutions to it, which should be uploaded to your public KNIME Hub spaces with tag JKISeason3-24 .
Need help with tags? To add tag JKISeason3-24 to your workflow, go to the description panel in KNIME Analytics Platform, click the pencil to edit it, and you will see the option for adding tags right there. Let us know if you have any problems!
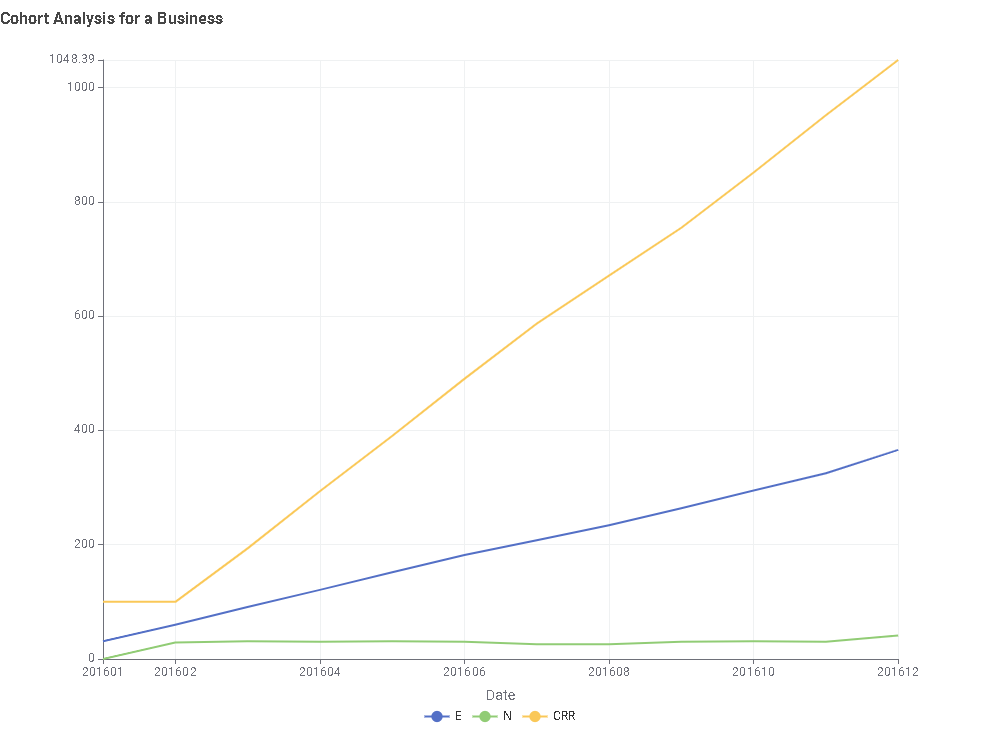
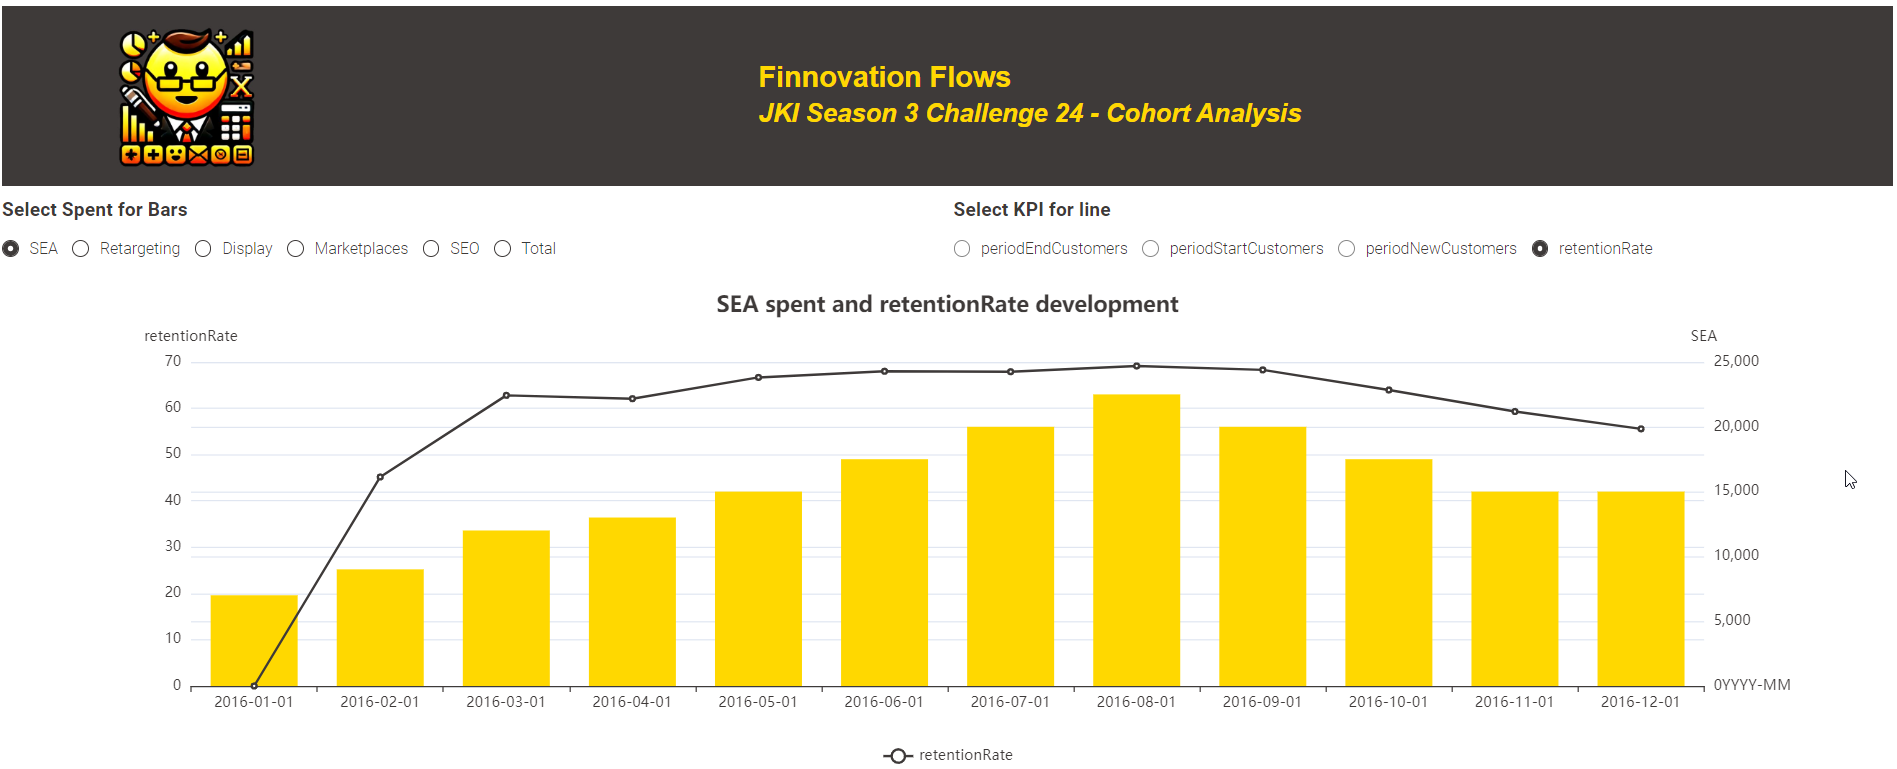
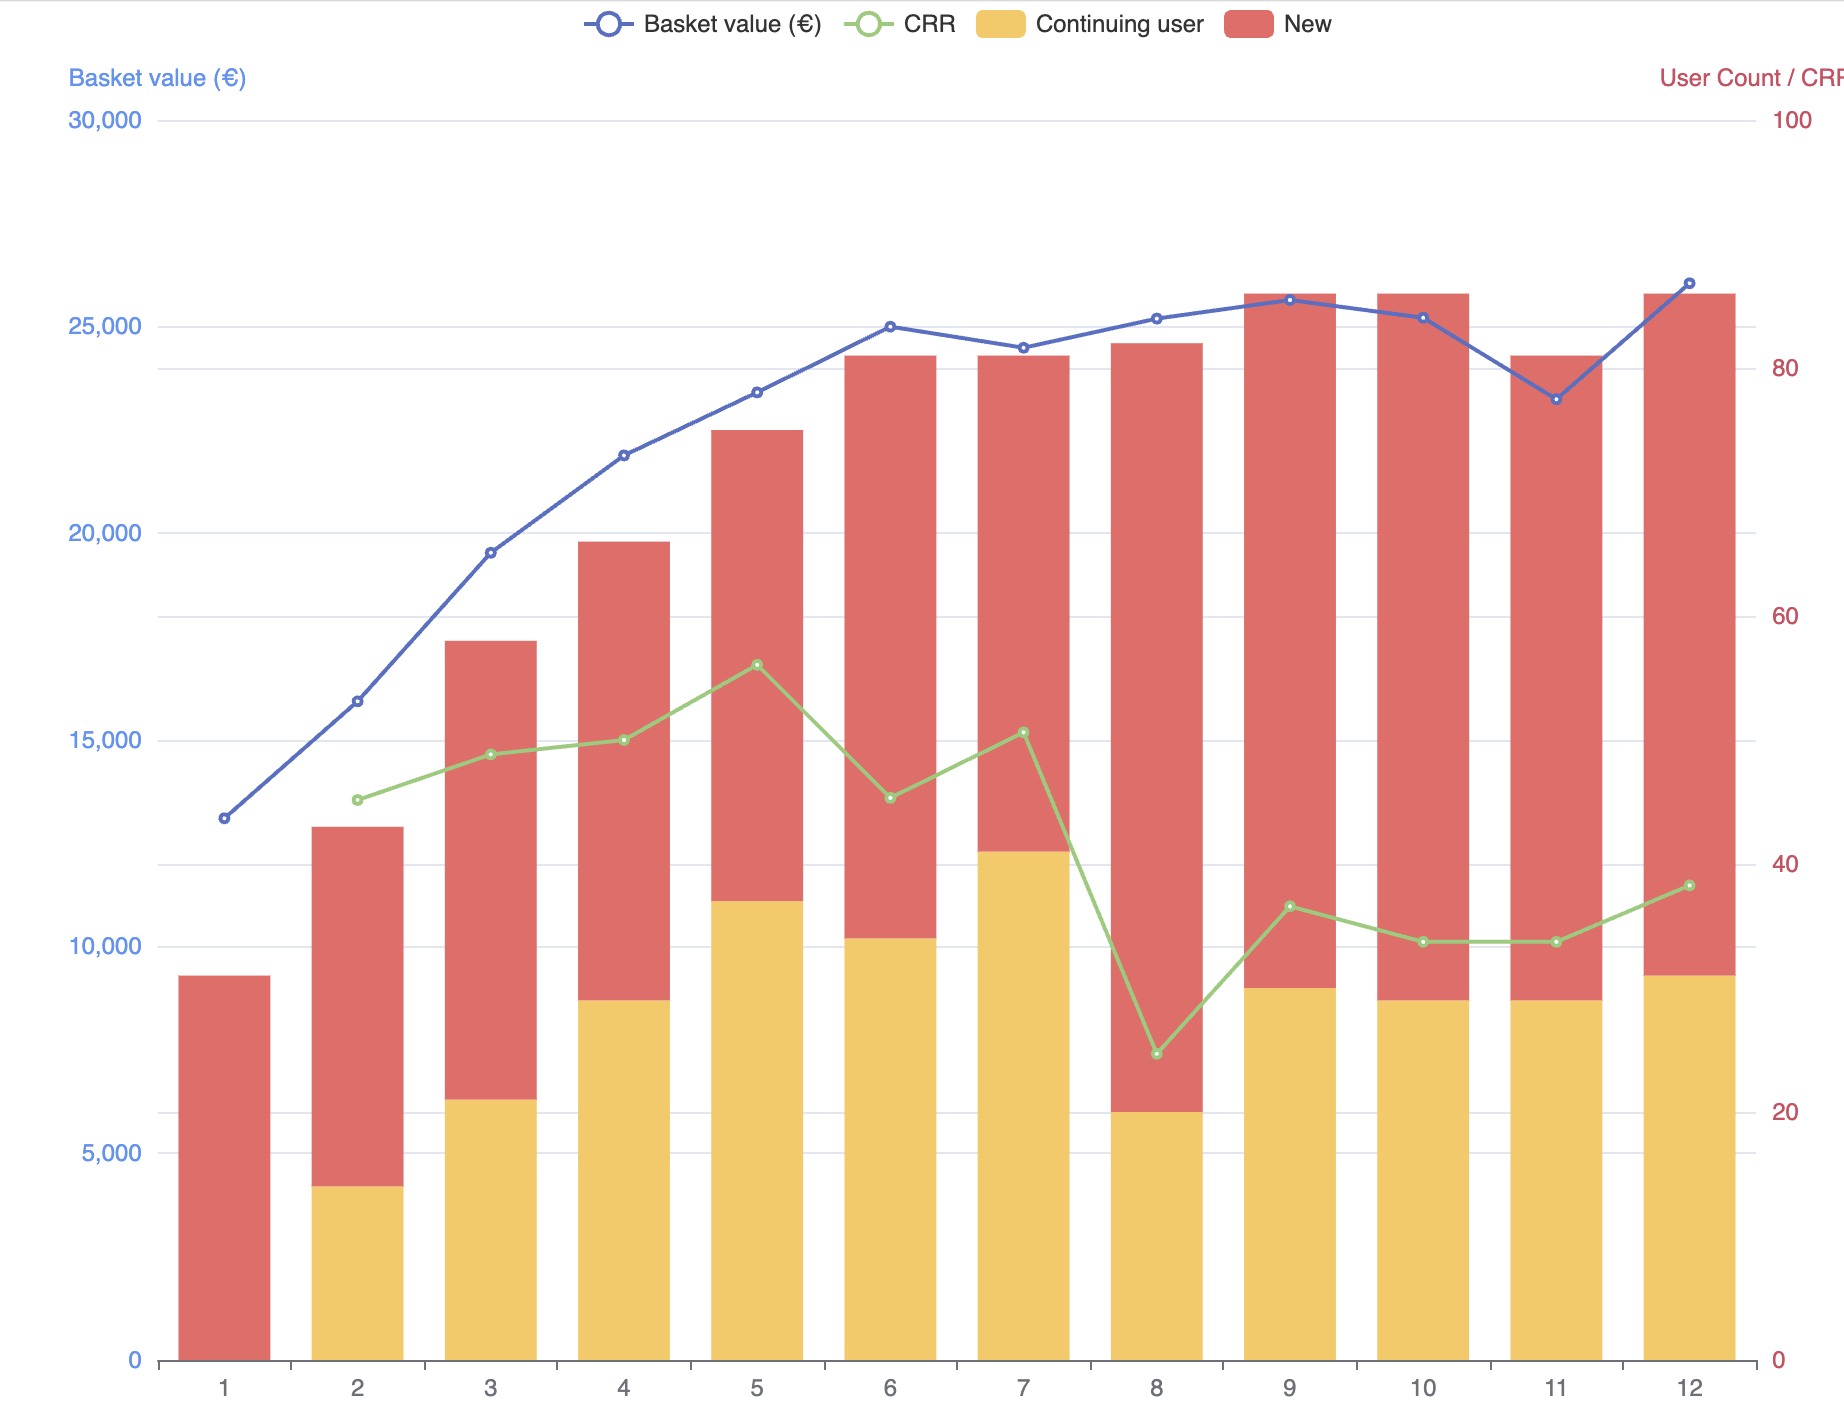
Overall Monthly Development vs. Marketing spent. It allows to select between different KPIs for the line (customer numbers, retention rate) and spent categories for the bars (Total, SEA…): Overall there seems to be a correlation between increasing SEA spent and improving overall rentetion:
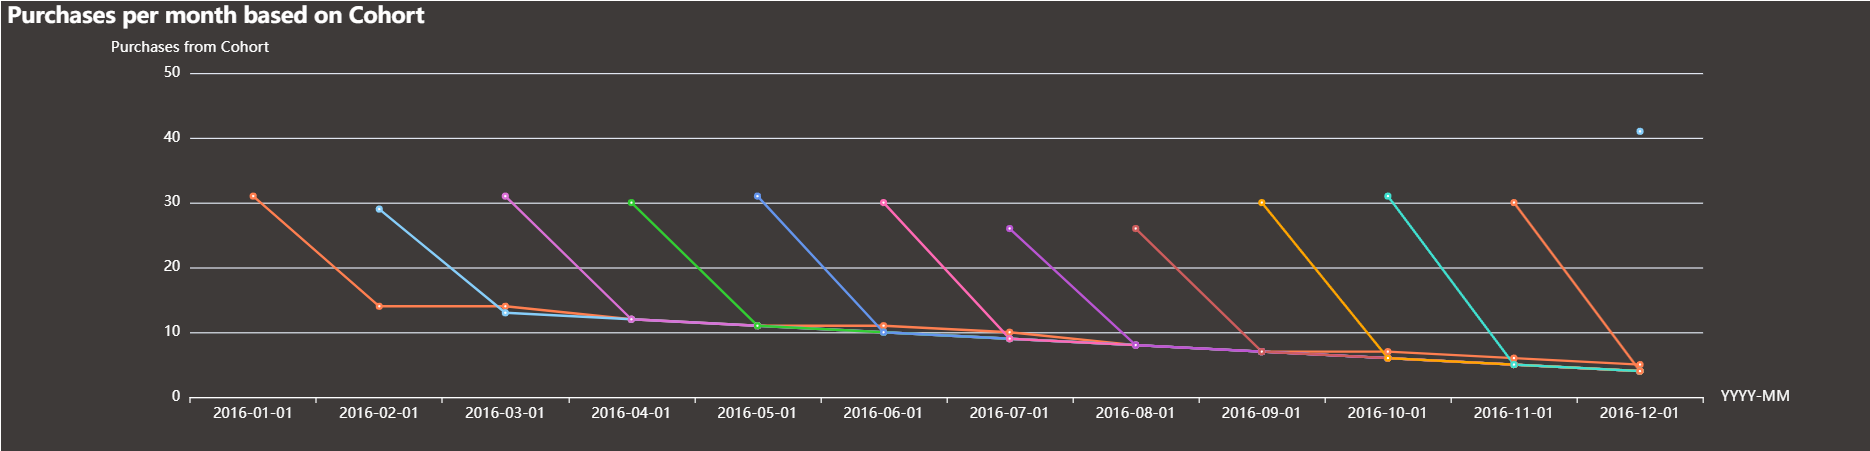
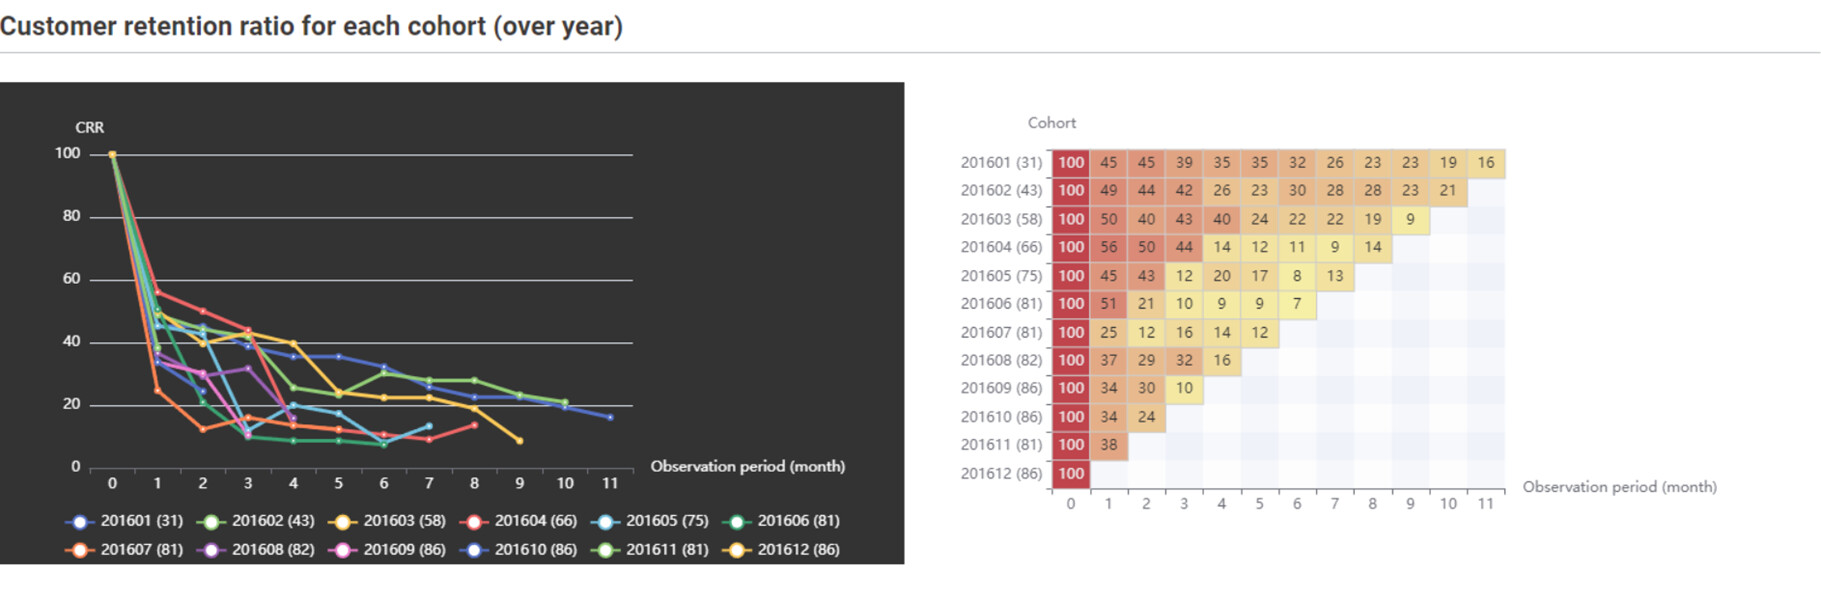
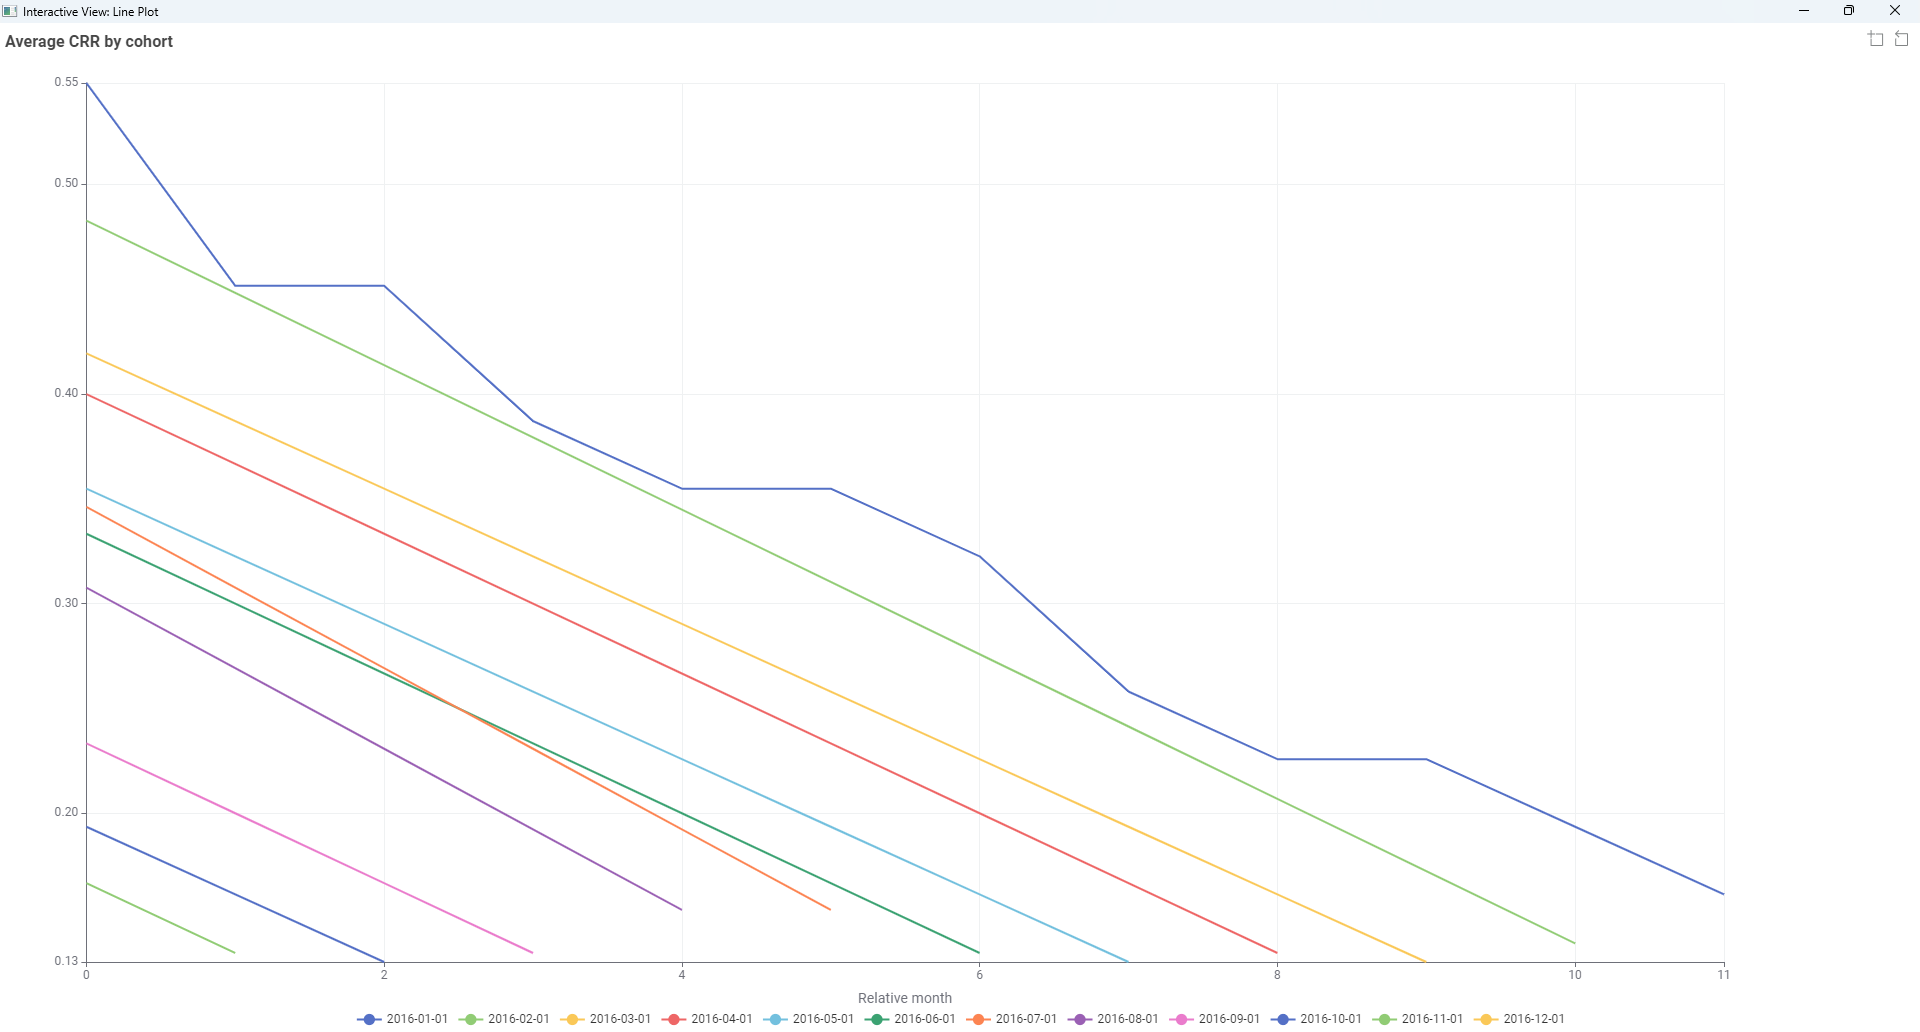
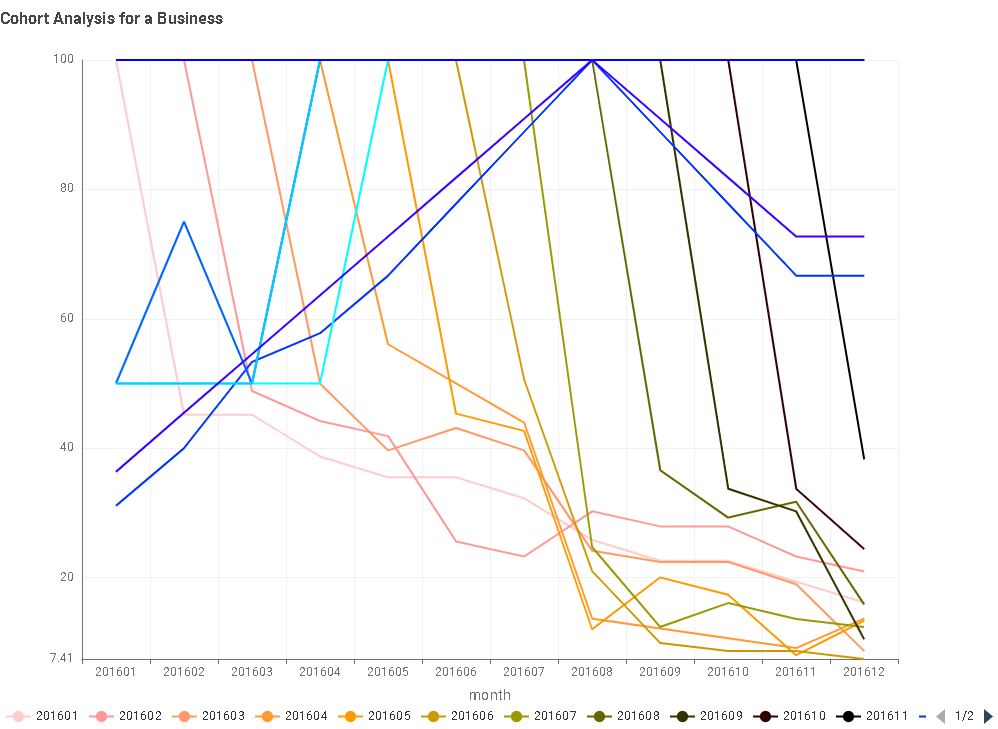
Line chart showing re-purchases in future months for Cohorts (i.e. if 10 customers made their first purchase in Jan, the 2016-01-01 Cohort line show how many of these purchased again in future month). Overall the first cohort seems to be doing best and any further cohort drops of just a bit more it seems:
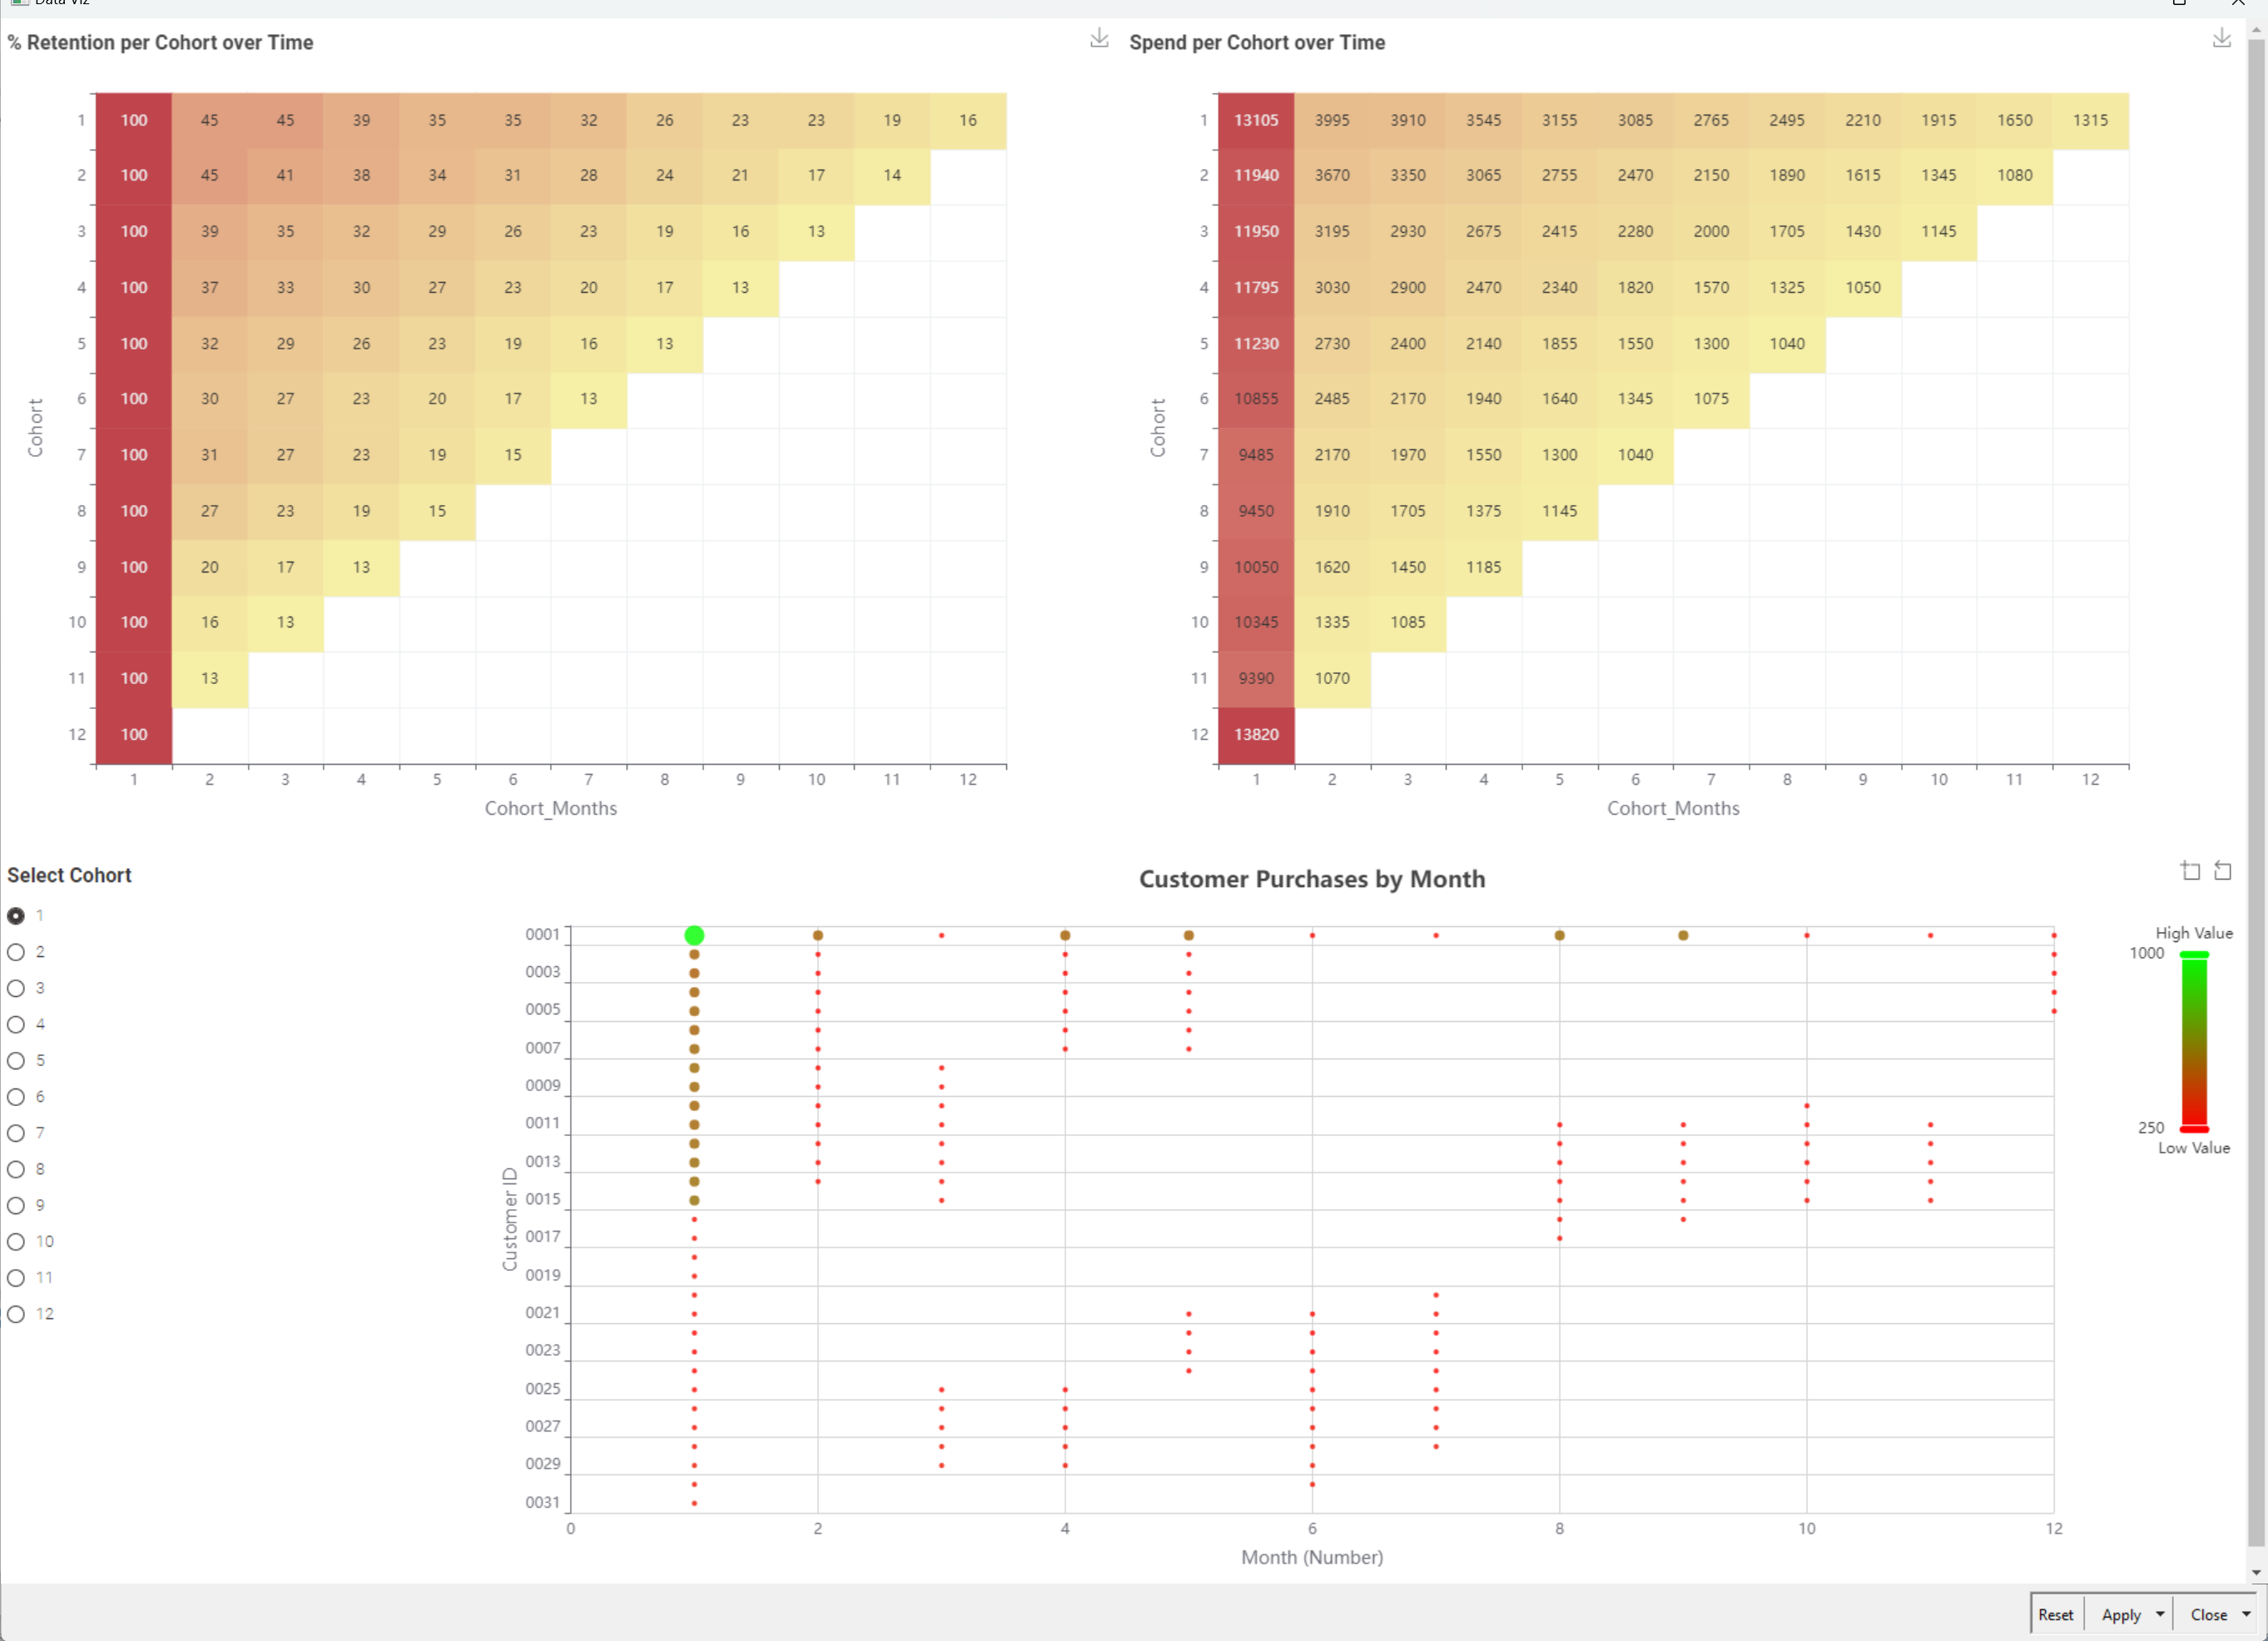
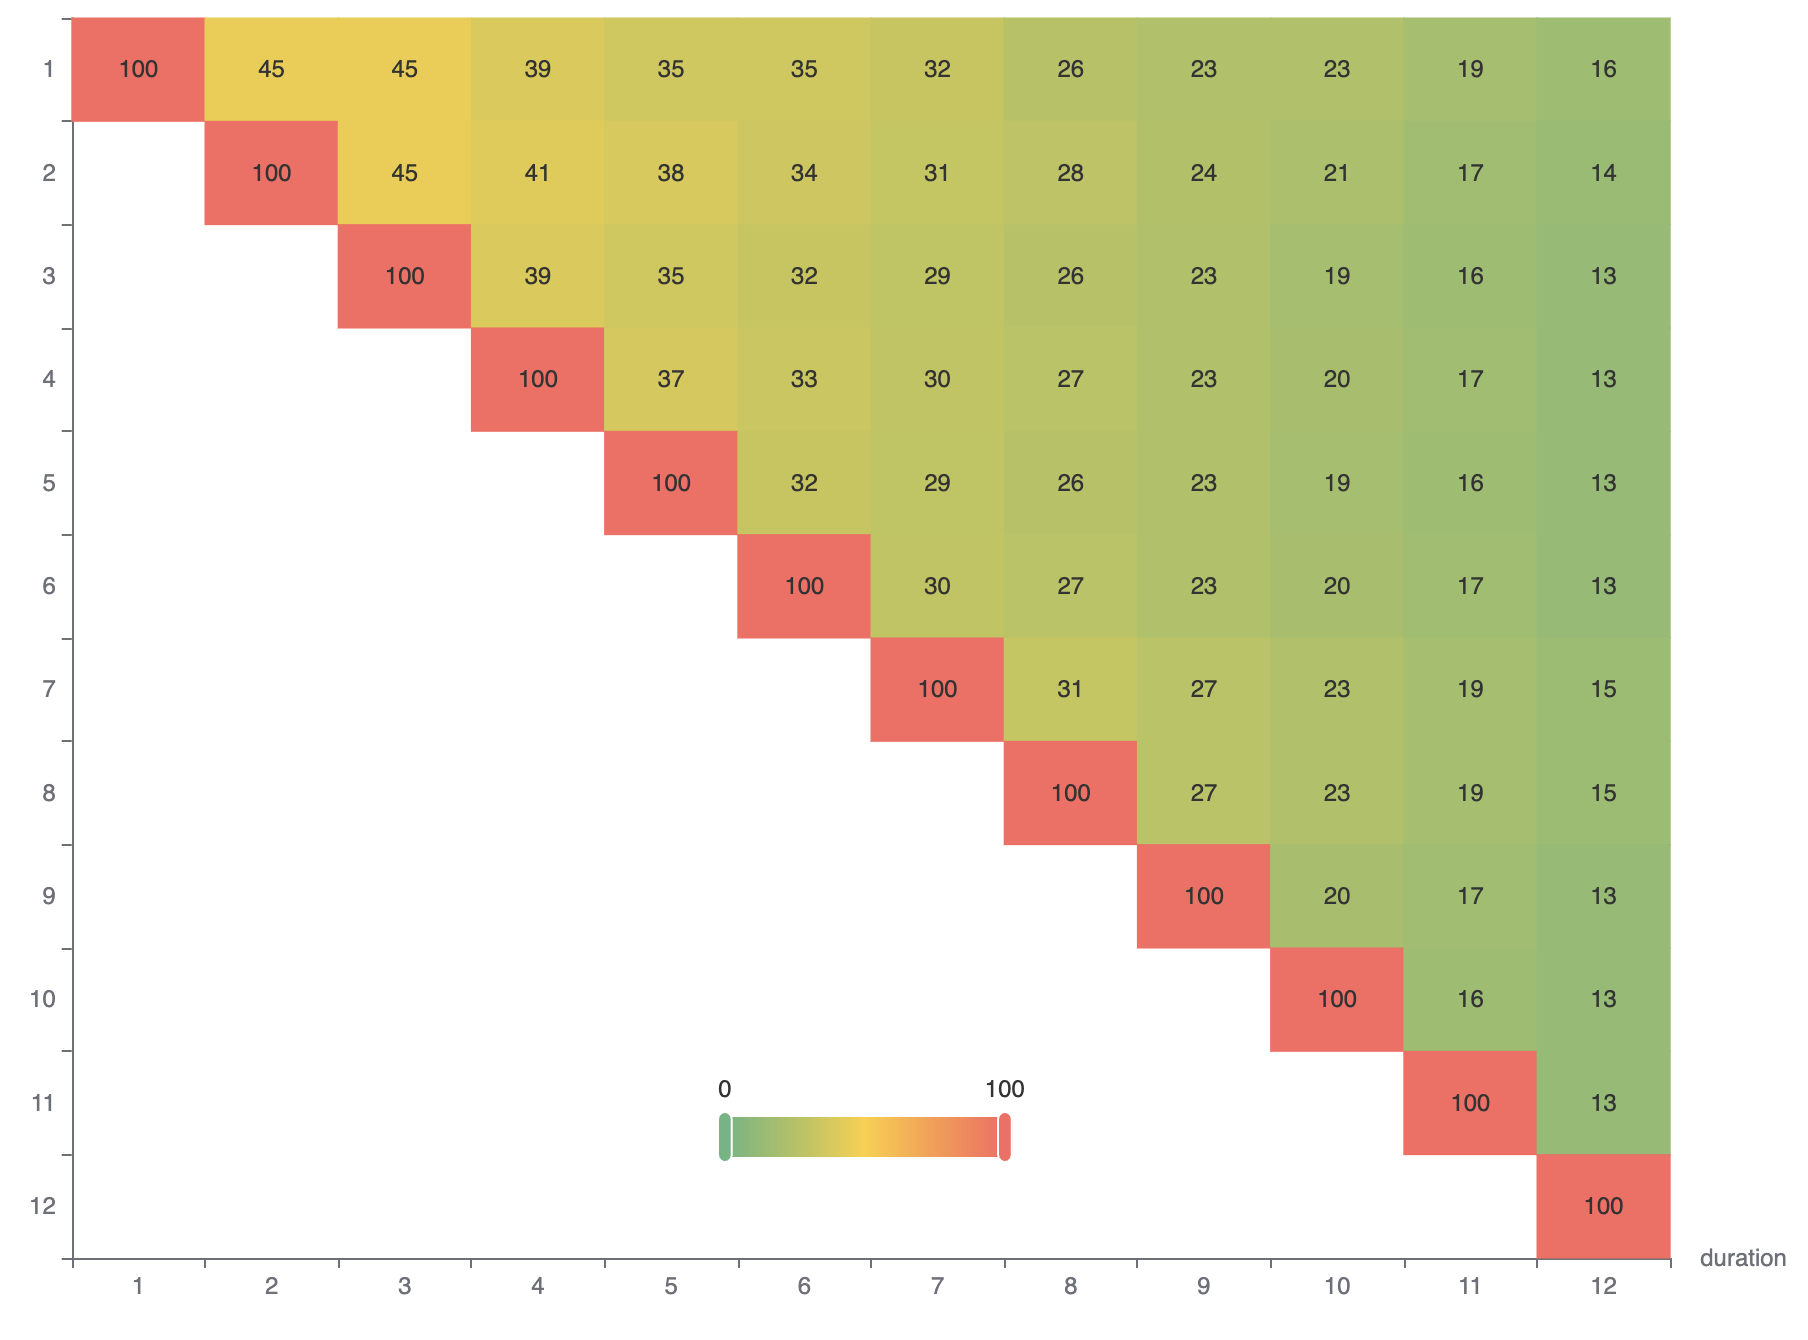
Heatmaps for cohort retention rate & spend.
Would be nice to be able to control the coloring in this node.
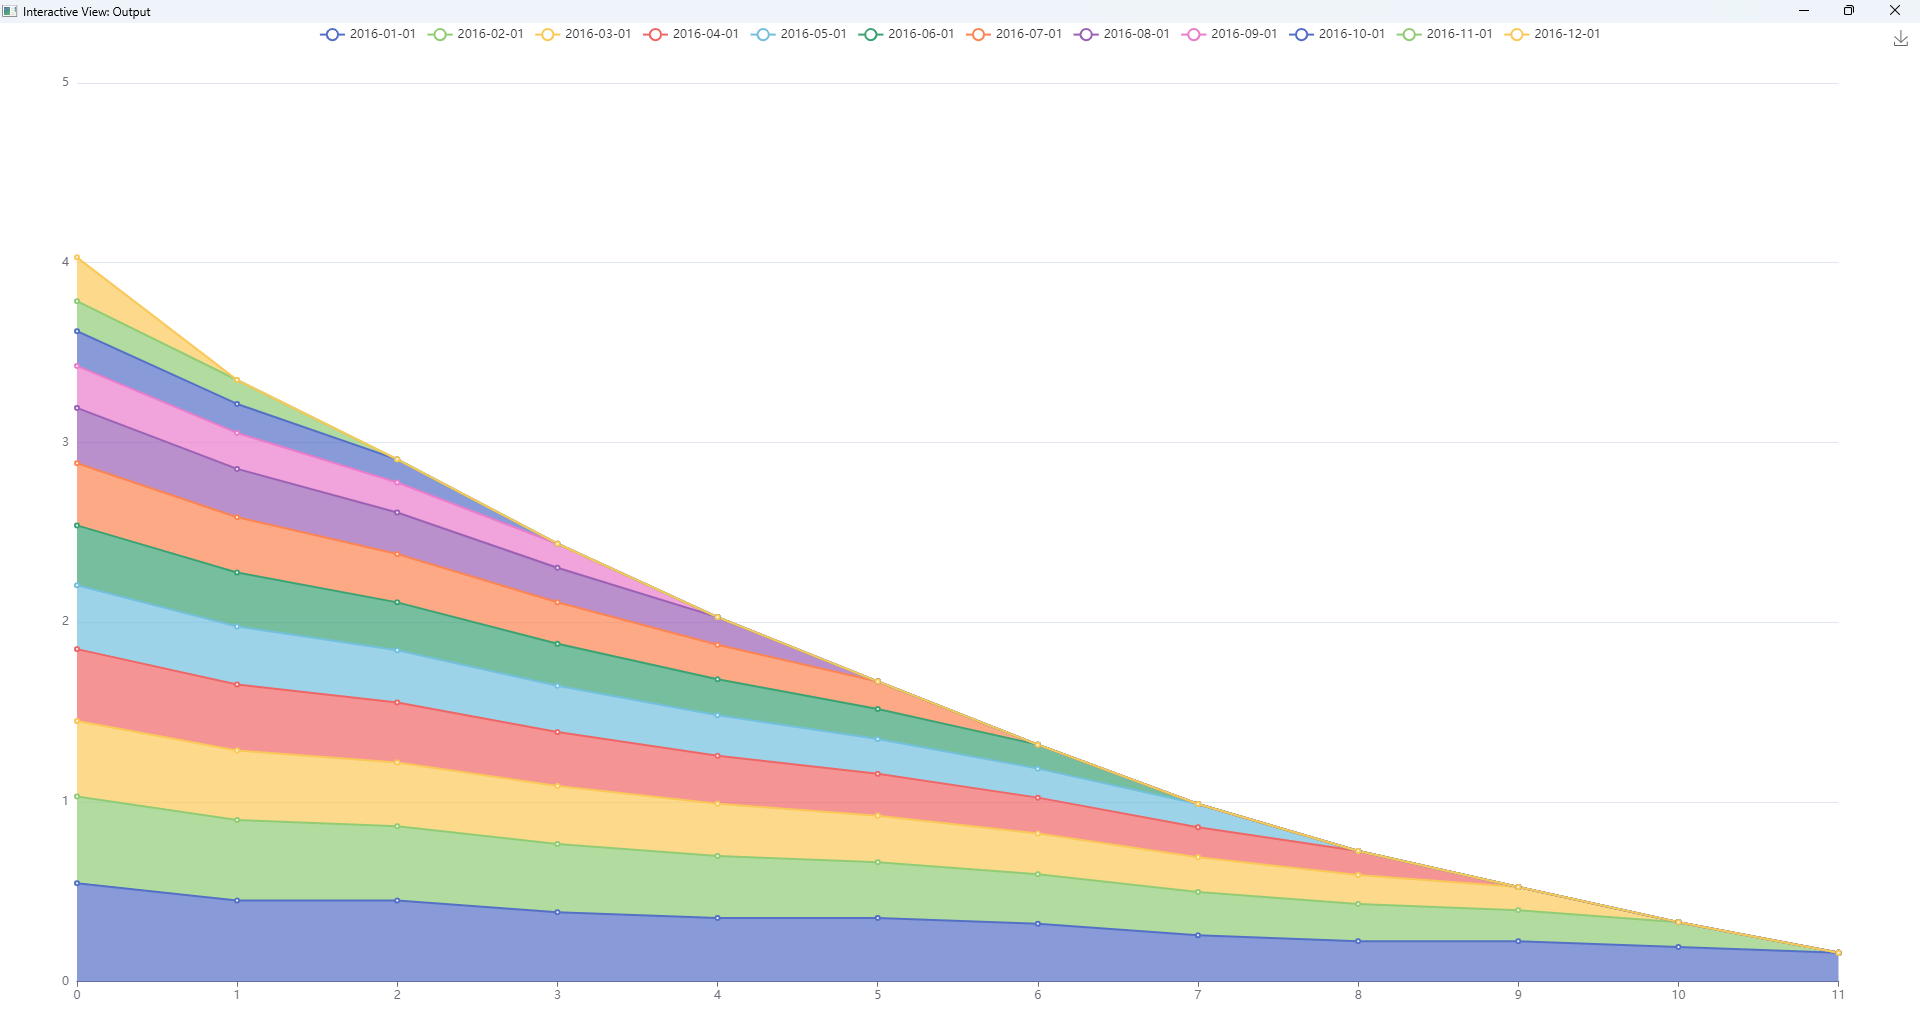
Plot shows behavior of individual customers in a cohort.
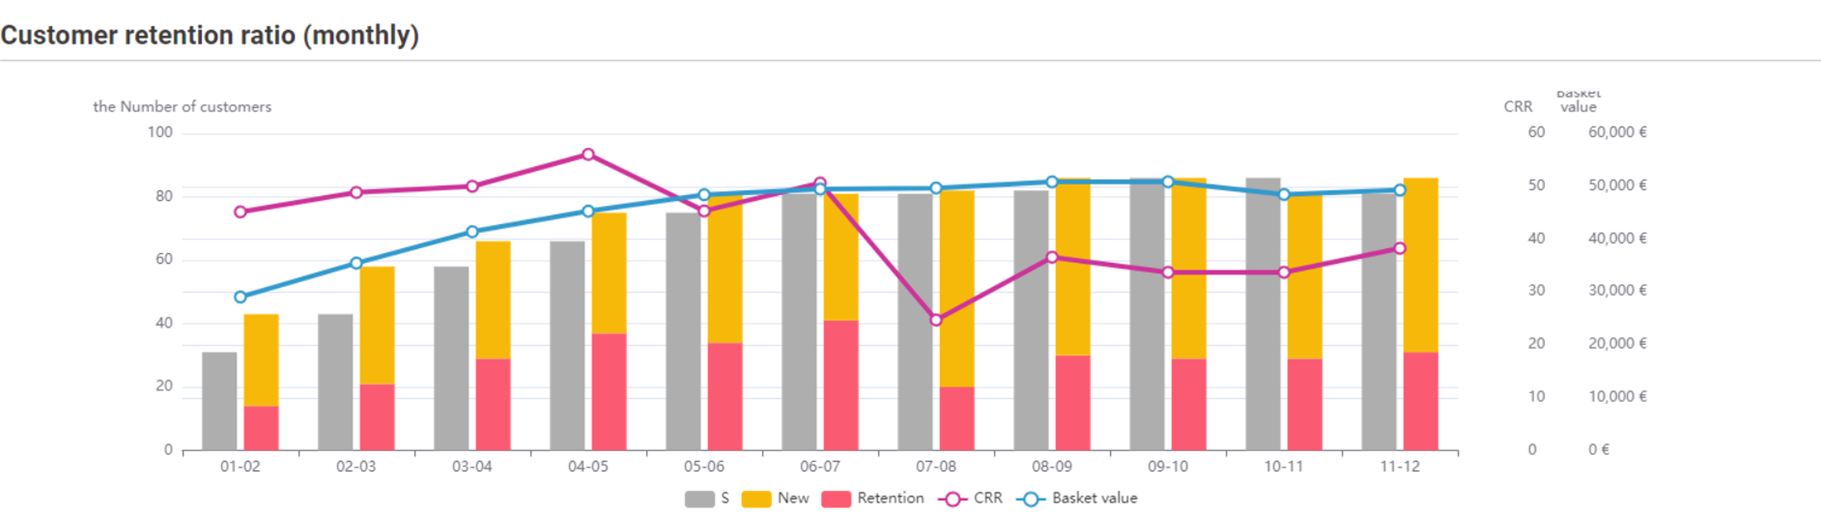
I calculated the CRR for each year (2016) and each month.
Additionally, I created a heatmap to visualize the retention rates of different cohorts over time.
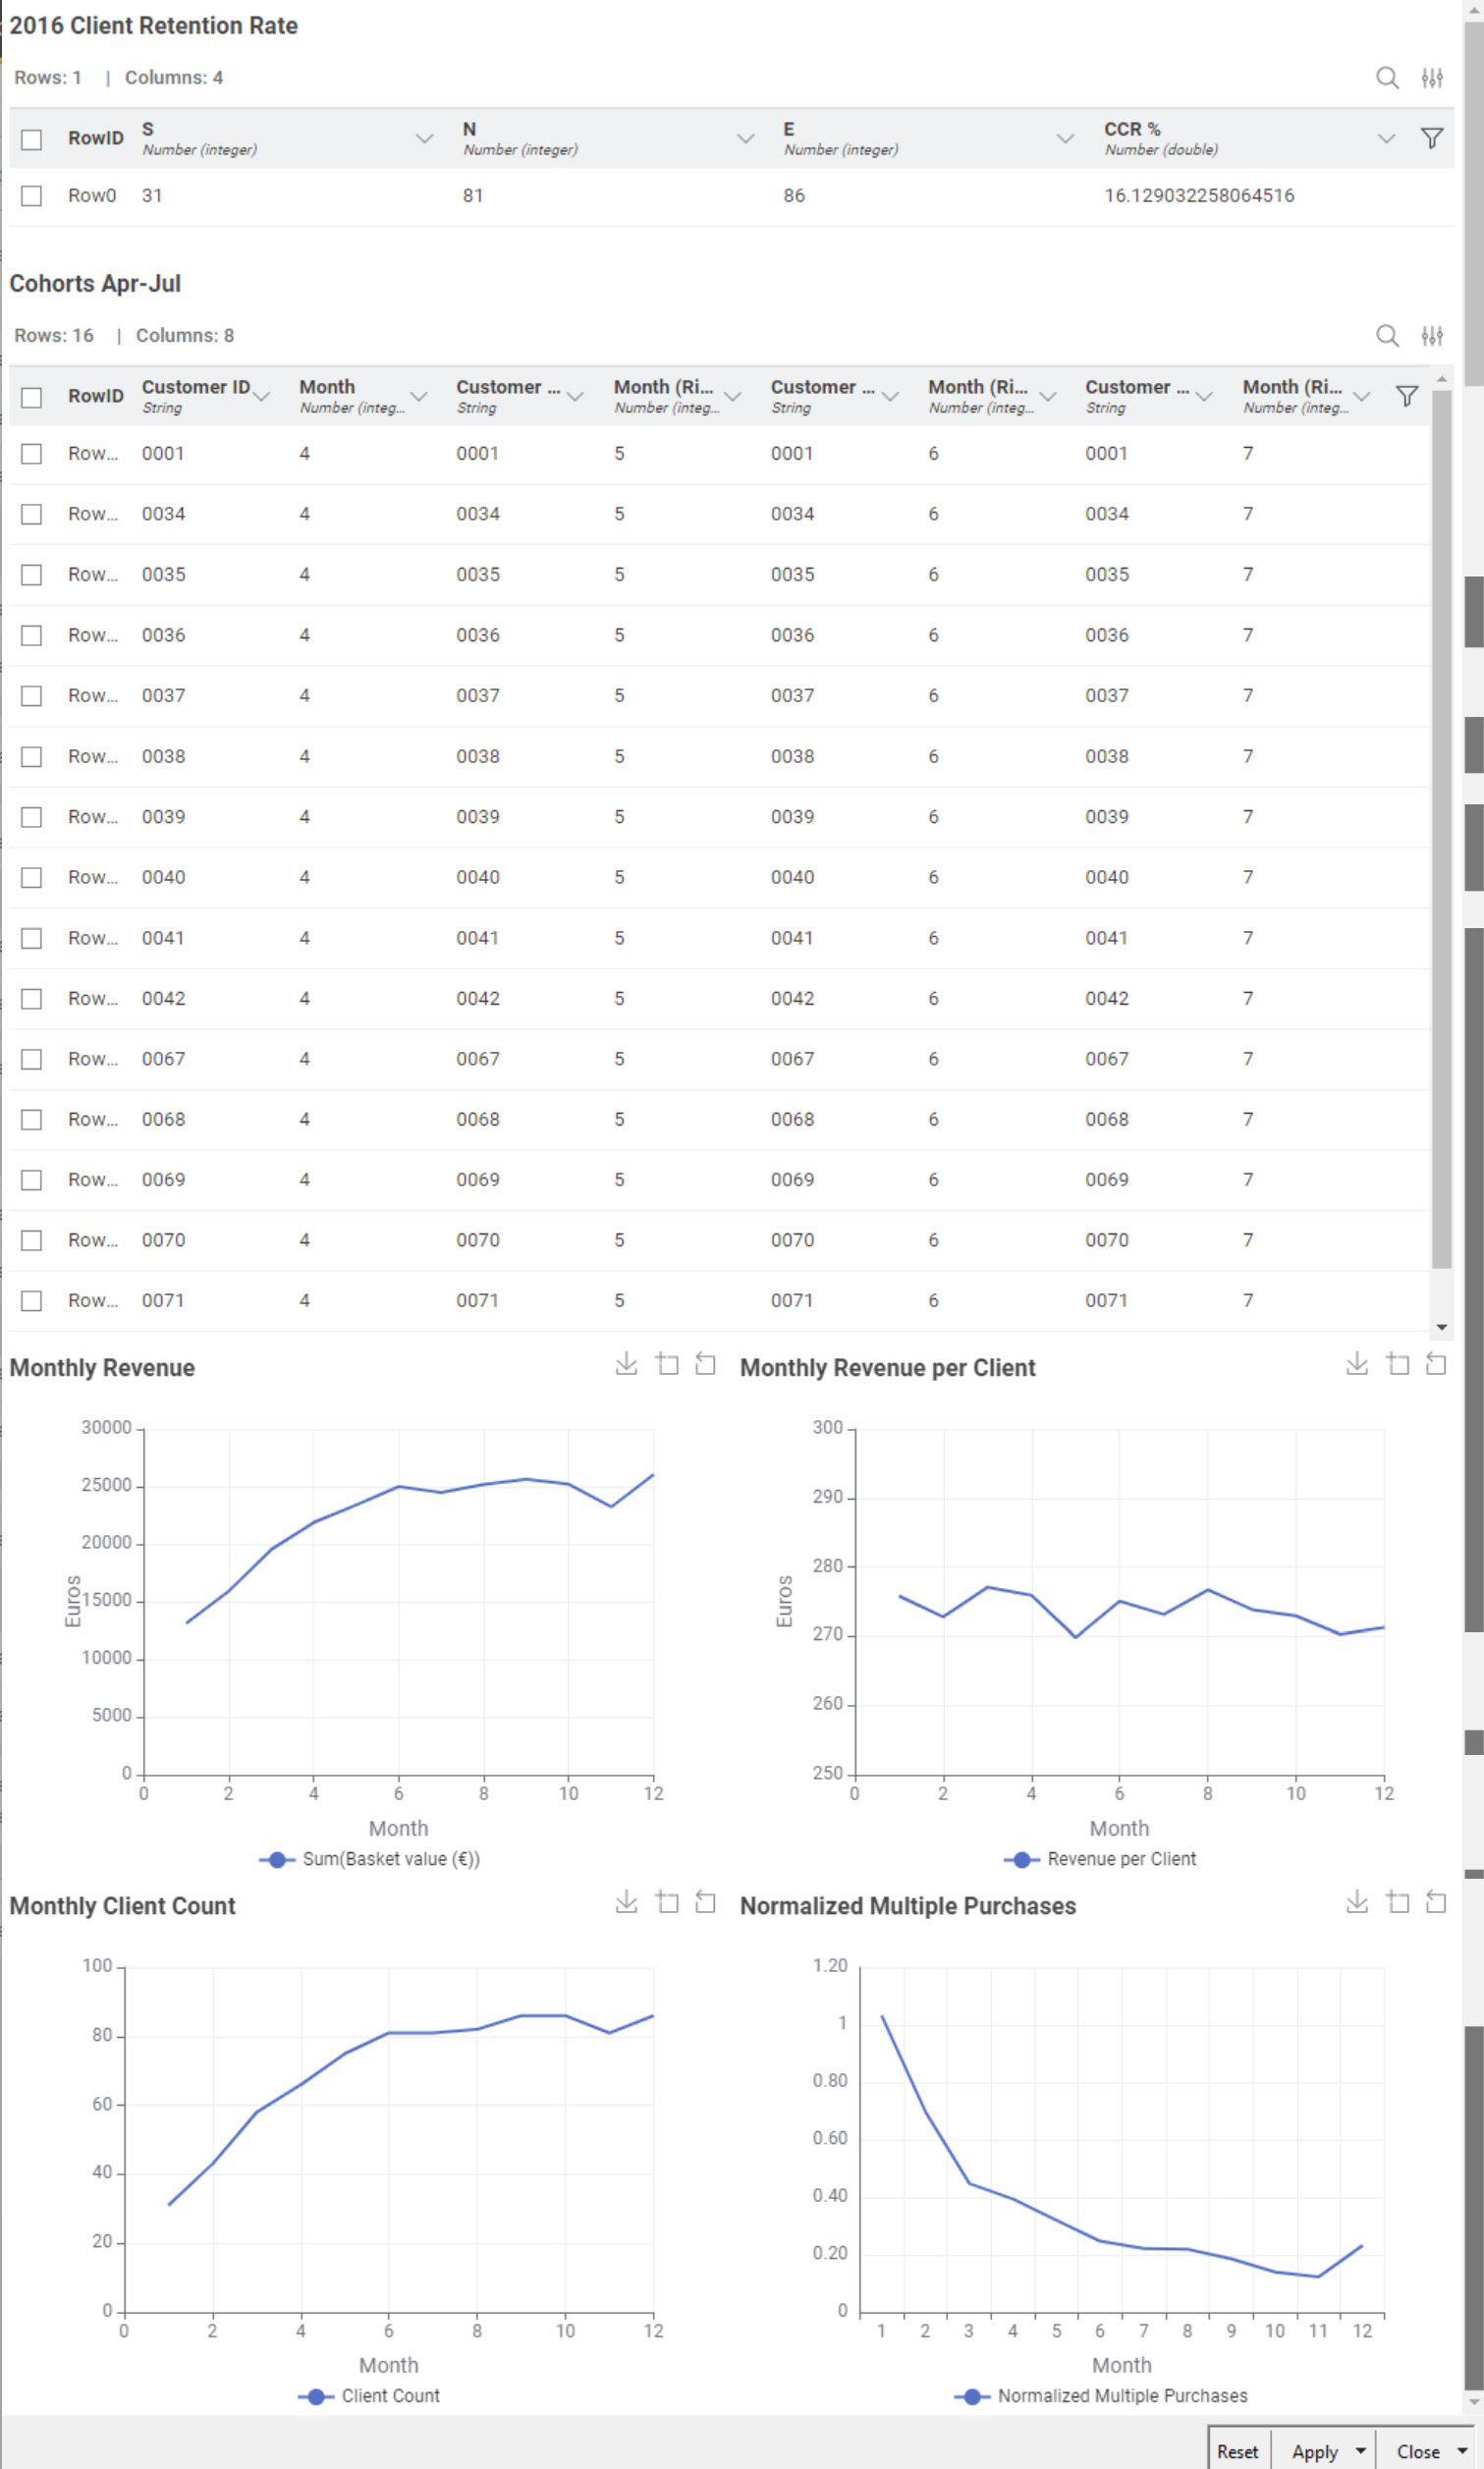
Here’s my solution. Both the month sets for CCR and Cohorts are hard coded but can be easily changed. Report includes:
Annual CCR
Cohorts (Apr-Jul)
Monthly Revenue
Monthly Revenue per Client
Clients per Month
Monthly Multiple Purchases (Normalized for Client Count)
It was really interesting to read about cohort analysis as I didn’t know about this topic before. Great to know one additional puzzle piece we can do with KNIME