This week we have our last easy challenge of the season! Join us and solve a sales management task to hone your data preprocessing skills. How much can you simplify your solution?
This season we will have 30 challenges, so it’s fair to say we can already see the end of it coming! Time to tackle old challenges and score your way into our leaderboard!
Here is the challenge. Let’s use this thread to post our solutions to it, which should be uploaded to your public KNIME Hub spaces with tag JKISeason2-26.
Need help with tags? To add tag JKISeason2-26 to your workflow, go to the description panel in KNIME Analytics Platform, click the pencil to edit it, and you will see the option for adding tags right there. Let us know if you have any problems!
Hello @MoLa_Data
I’ve been very busy these days with work + logistics… then I couldn’t follow up the JKI Challenges as I would like, by delivering out of the box solutions. This CH26 was an easy one, so it didn’t require too much from my side.
I have a couple of unfinished past challenges in my desktop. I would like to complete them before season ends; now that northern hemisphere’s summer already passed away.
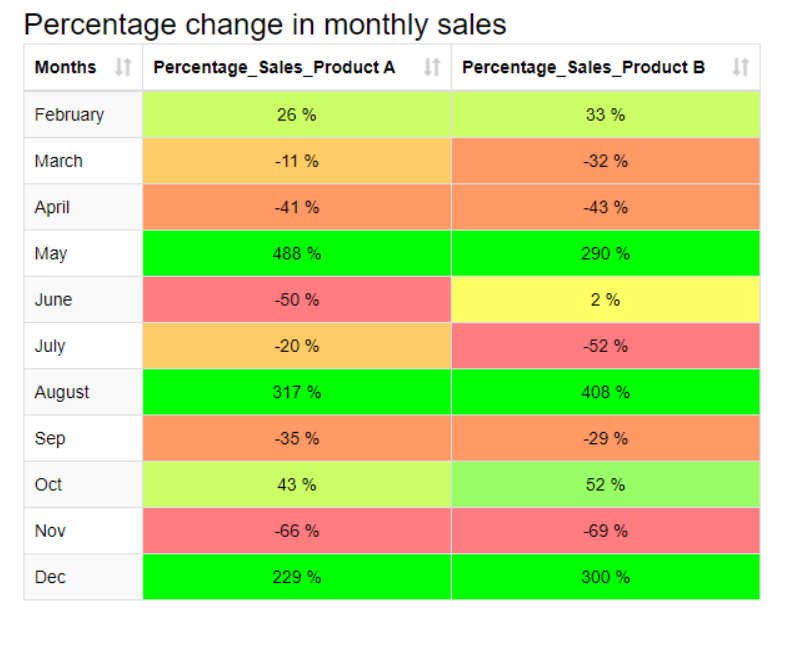
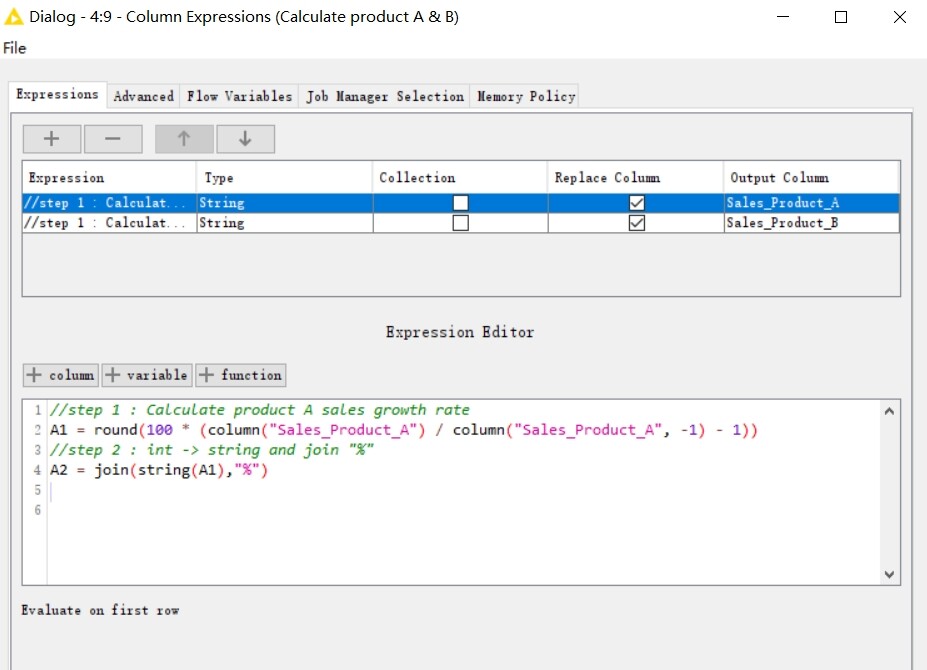
The ‘Column Expressions’ node is a magical node that can replace the’ Math ‘node, the’ String Manipulation ‘node, and even the’ Lag Column 'node. We can also program multiple lines and only return the last line, which can also be annotated.
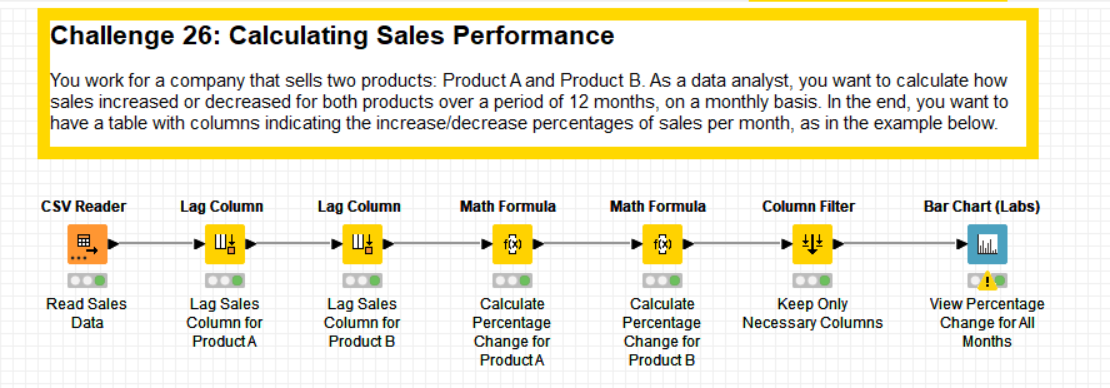
Thank you to @skybe077 for sharing, and also to @sryu for sharing the processing skills of the “Lag Column” node.
As always on Tuesdays, but a little later today due to technical issues, here’s our solution to last week’s Just KNIME It! challenge
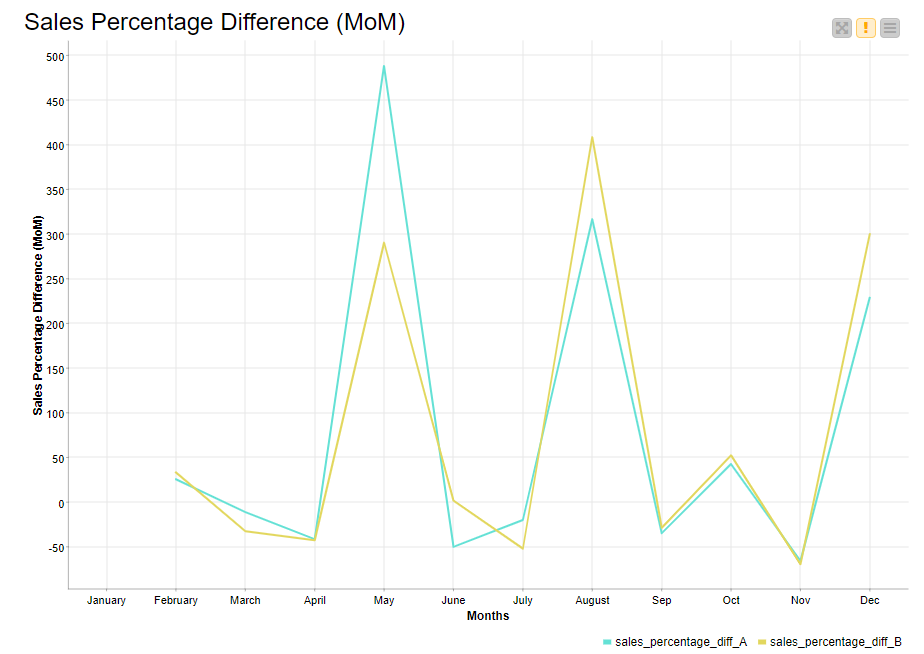
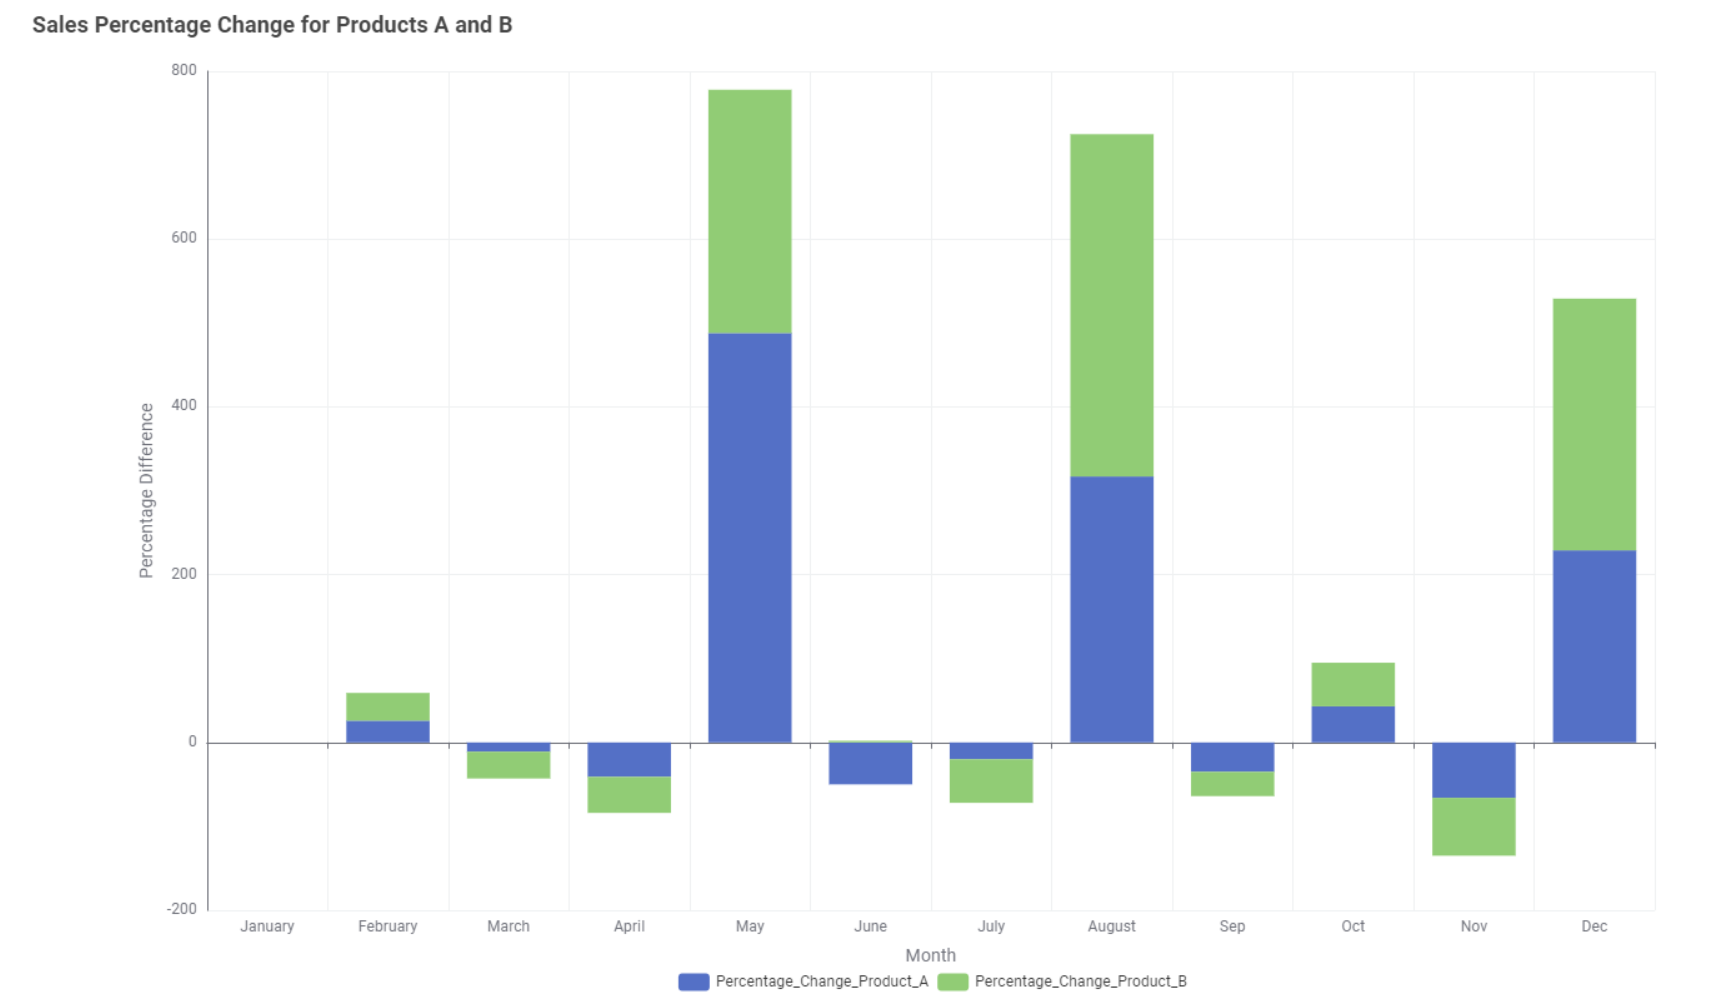
As you can see, our solution relies mostly on a basic loop and lagging operations. Easy peasy! We hope this last easy challenge felt inclusive and honed you a bit for our final stretch. We only have 4 more challenges to go!