Hi Everyone ![]()
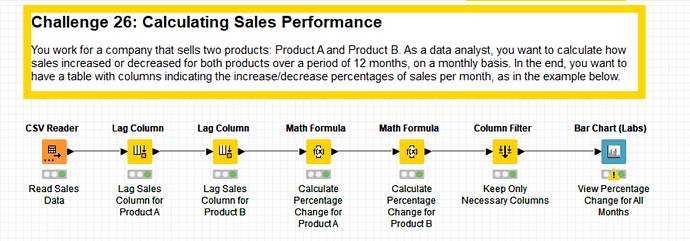
I have done much the same as everyone else this week:
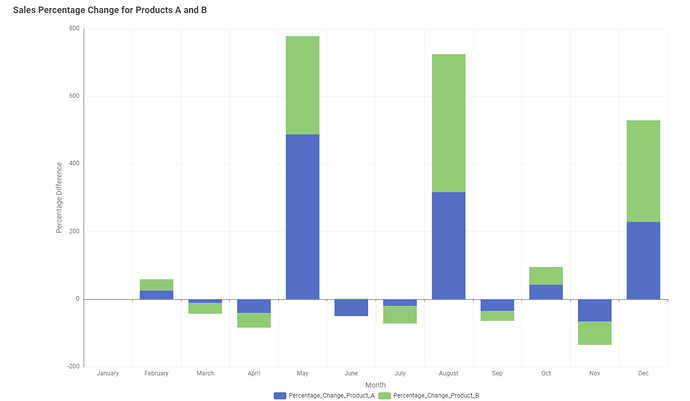
I was inspired by @MoLa_Data to use a stacked bar chart so that the total percentage change for each month can be viewed:
Thanks also to those of you who shared solutions with the -Column Expressions- node, that was interesting to see!
My solution is here:
Best wishes
Heather

