Hello, everybody! Today we have a new Just KNIME It! challenge on data profiling.
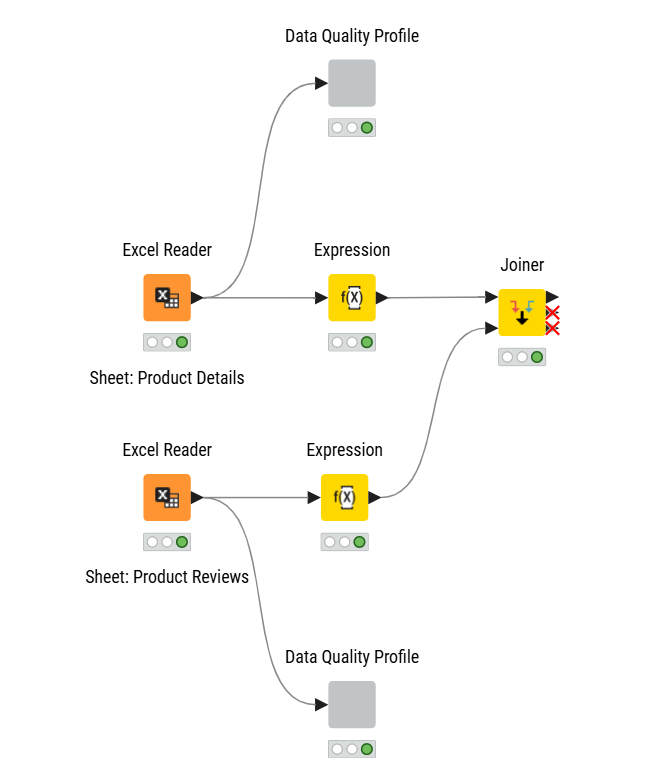
Your company is planning to upgrade its office setup with new chairs, desks, monitors, and other essentials. To help with the decision, someone scraped product details and reviews to start an analysis, but before trusting this data you’ve been asked to assess its quality. Your task is to evaluate two datasets (product details and product reviews) and create a data quality profile for each. Can you trust this scraped data?
Here is the challenge. Let’s use this thread to post our solutions to it, which should be uploaded to your public KNIME Hub spaces with tag JKISeason4-28 .
Need help with tags? To add tag JKISeason4-28 to your workflow, go to the description panel in KNIME Analytics Platform, click the pencil to edit it, and you will see the option for adding tags right there. Let us know if you have any problems!
Just to confirm for Challenge 28, is there only one dataset file available right now? Because the task says we’re supposed to evaluate two datasets (product details and product reviews).
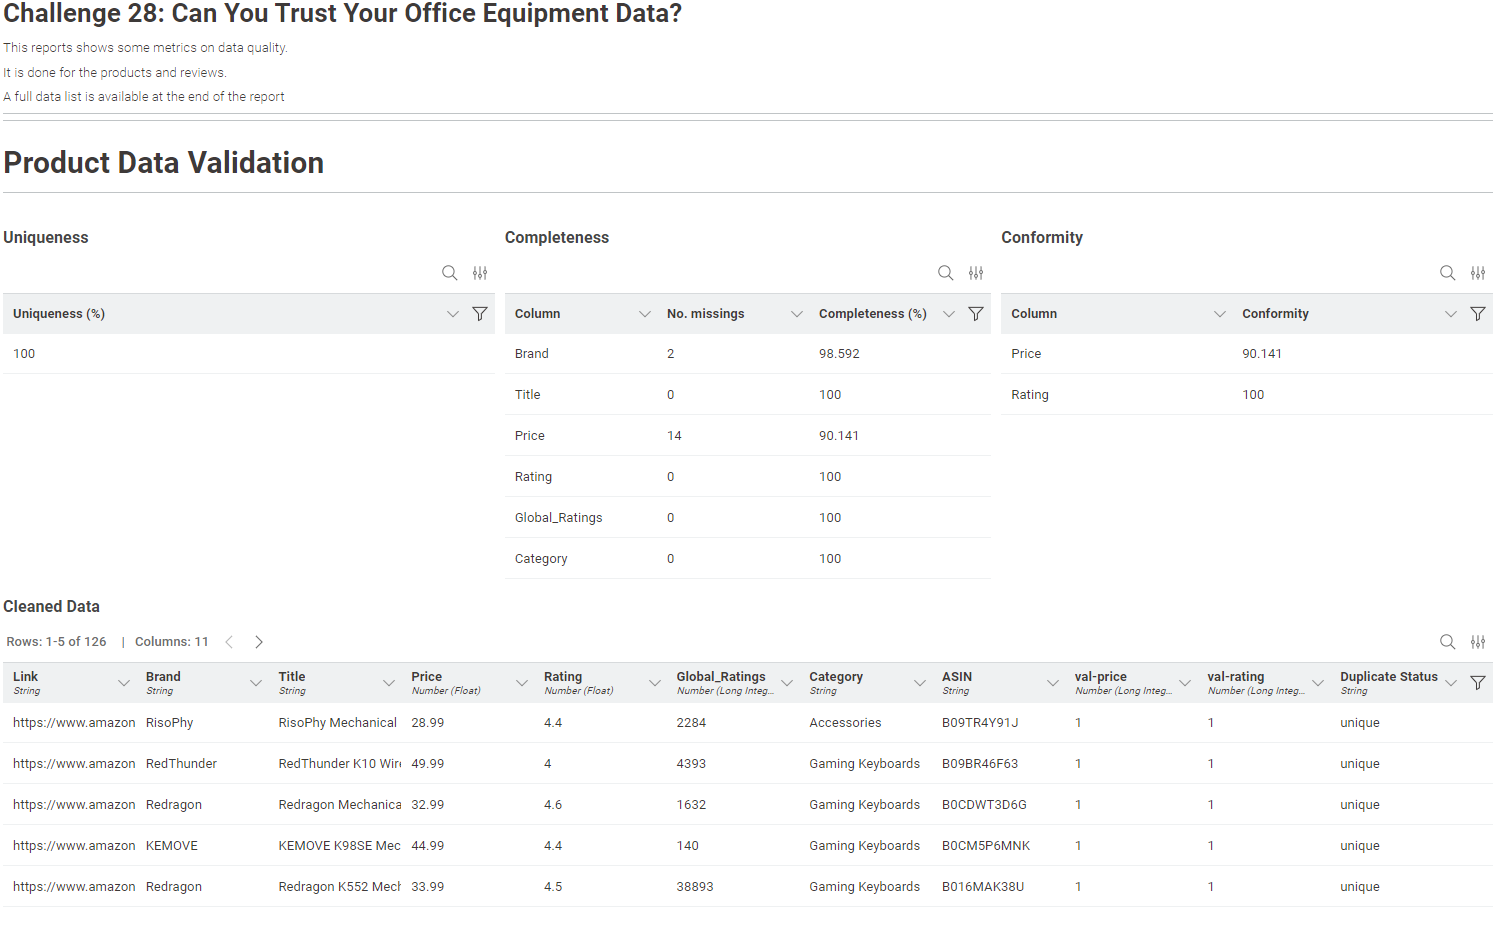
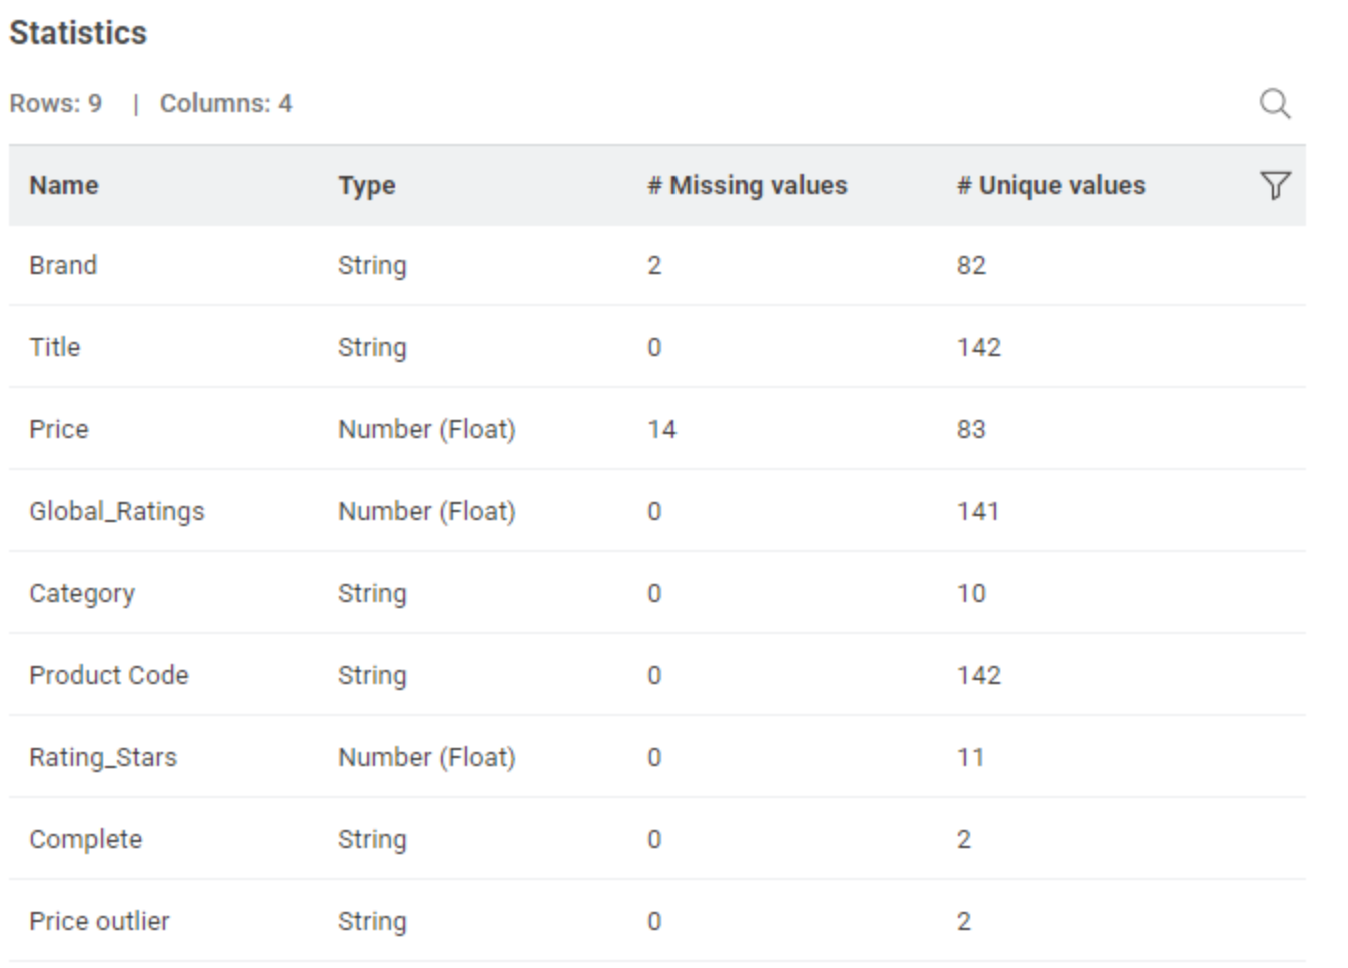
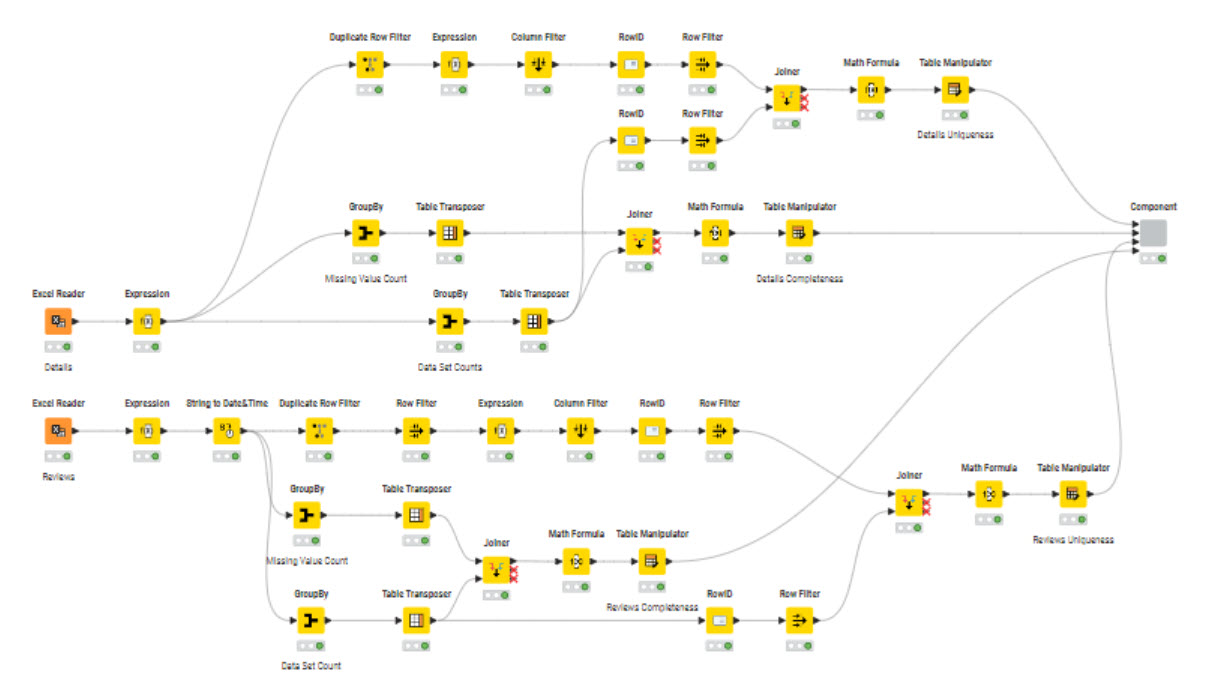
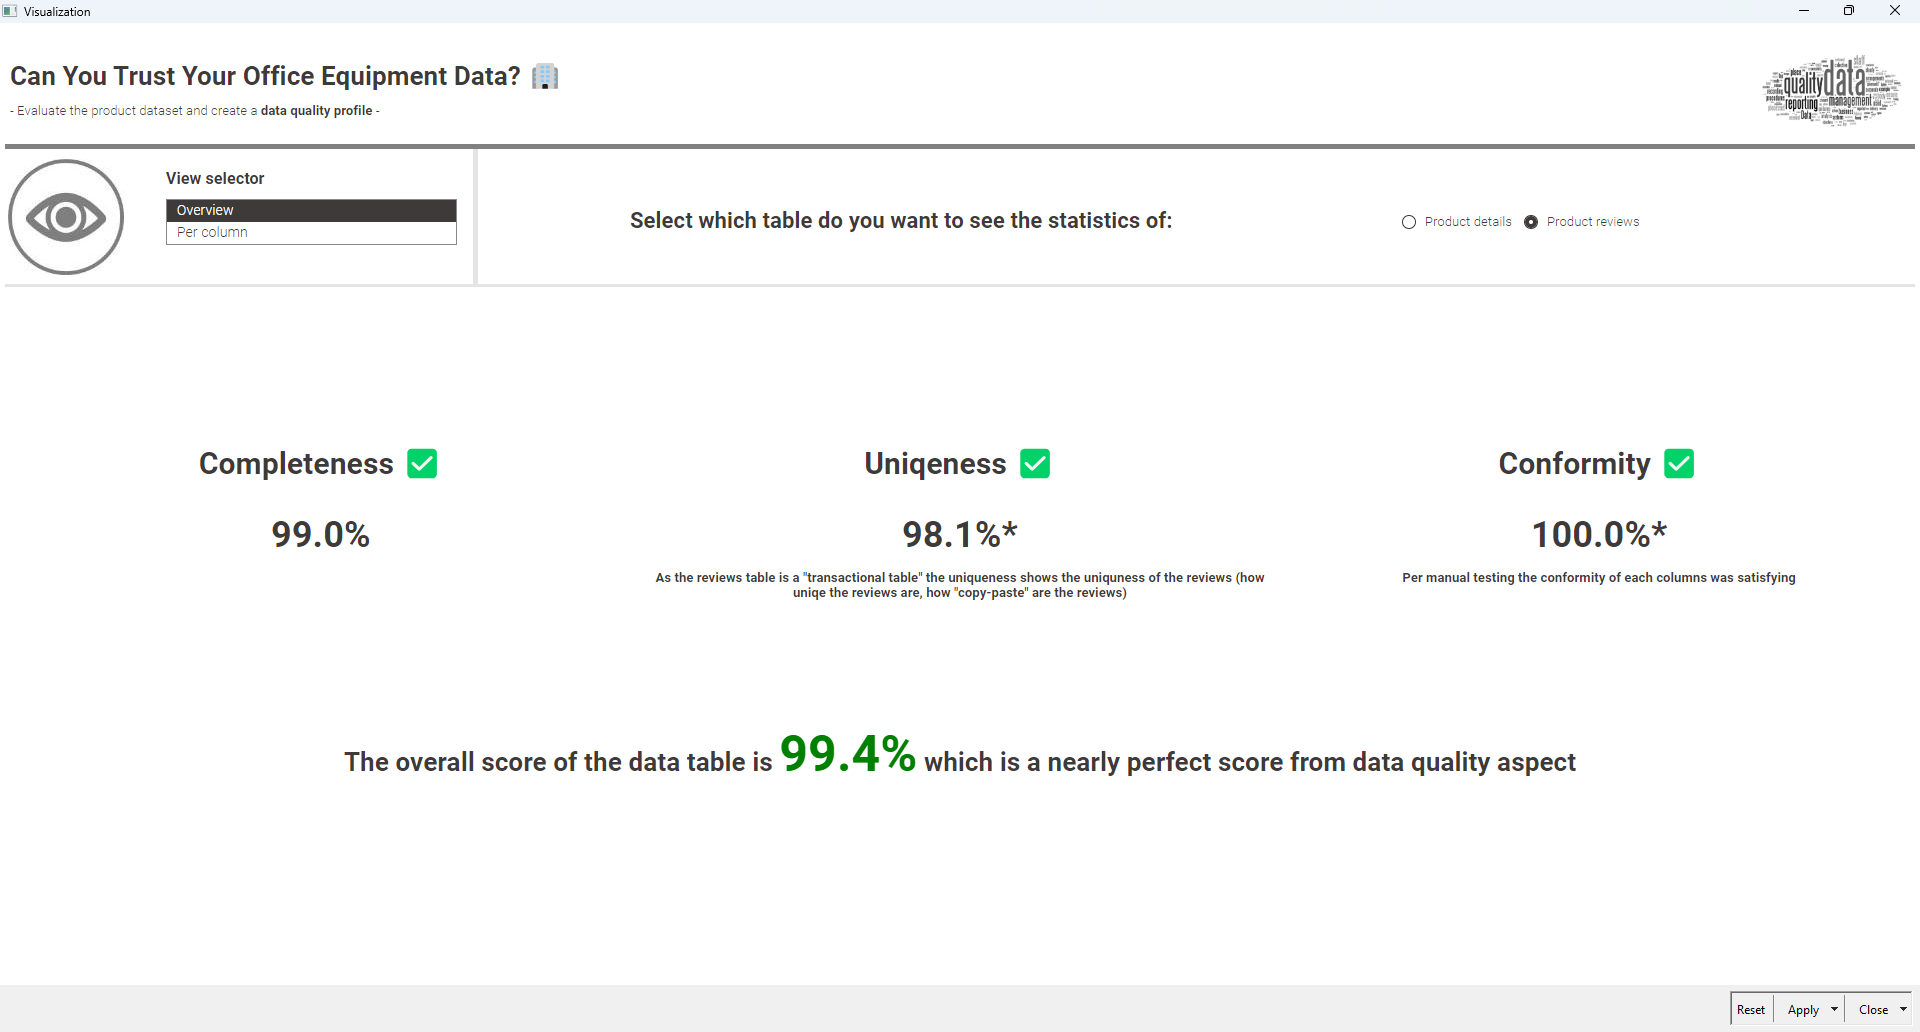
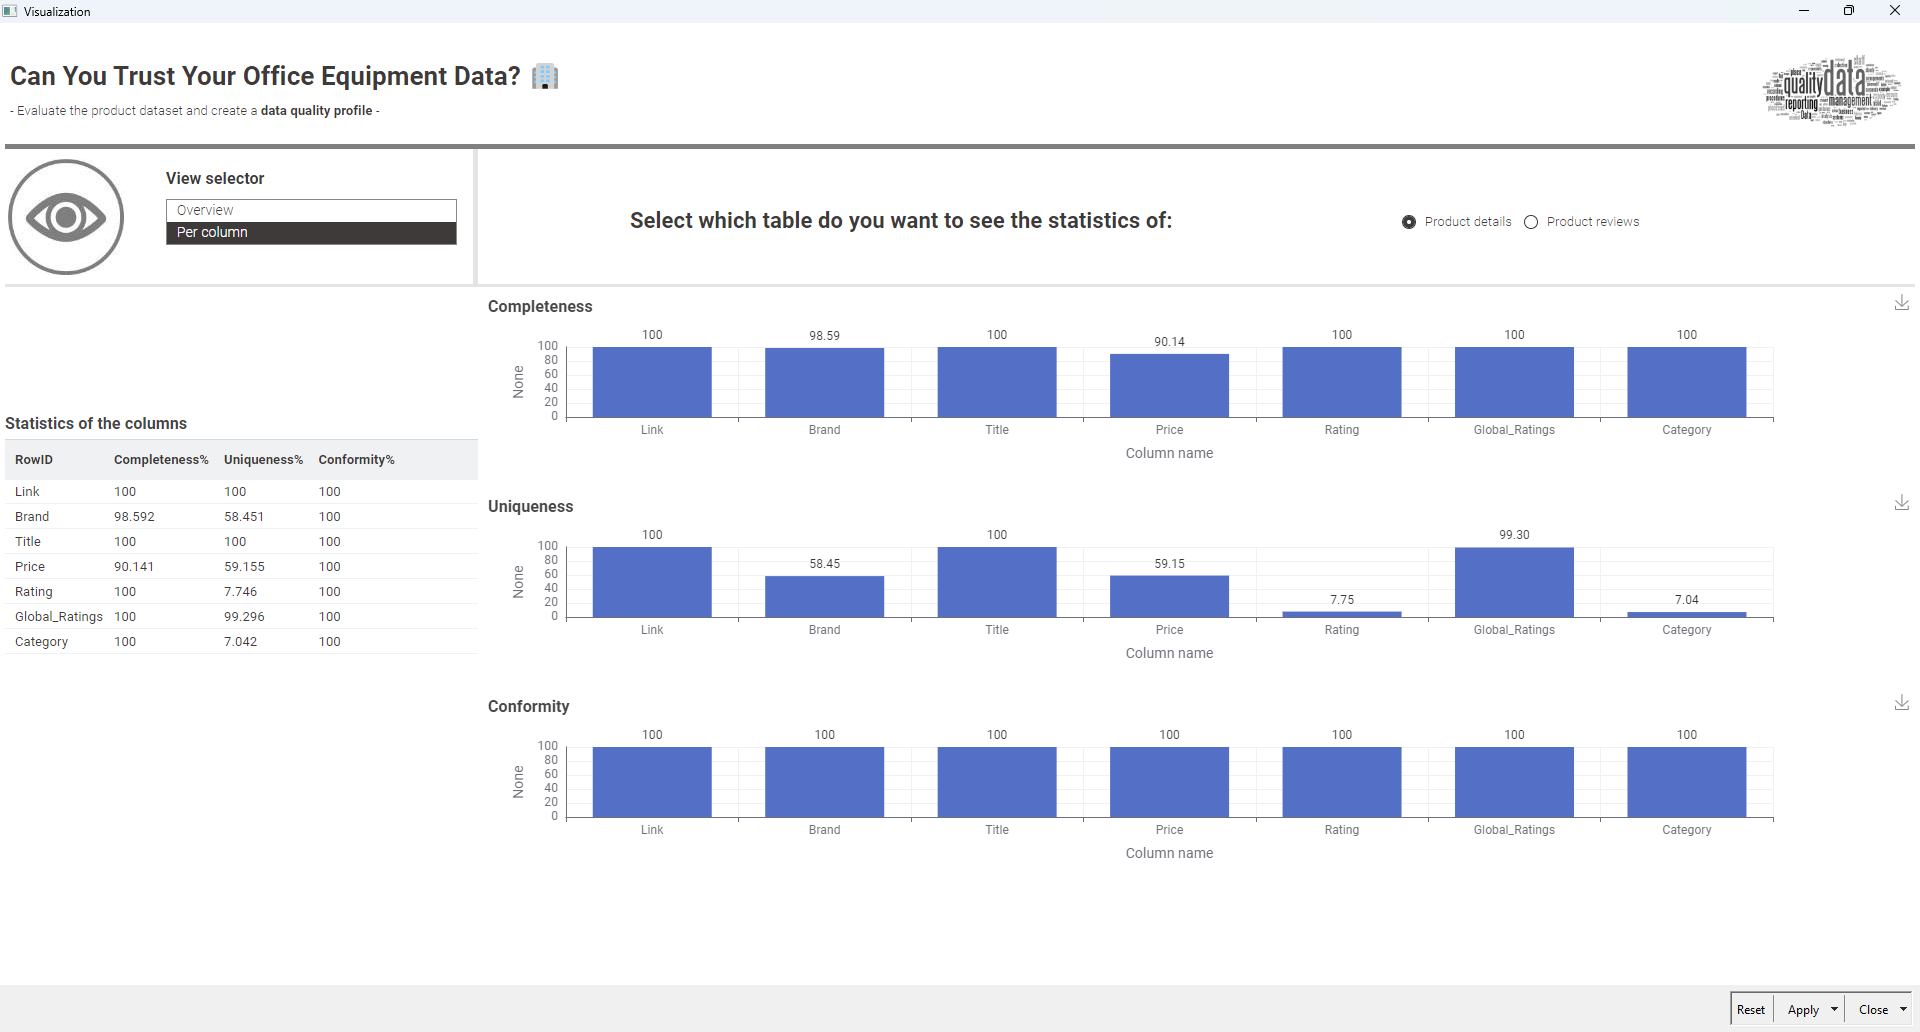
Do the measures of Conformity, Duplicate and Completeness per data. I wanted to avoid doing the calculation on the full data as the product will appears many times once joined with the reviews. Had to process the data and do some pivot to get the percent,
Filter the data based on these criteria and keep “good data only”
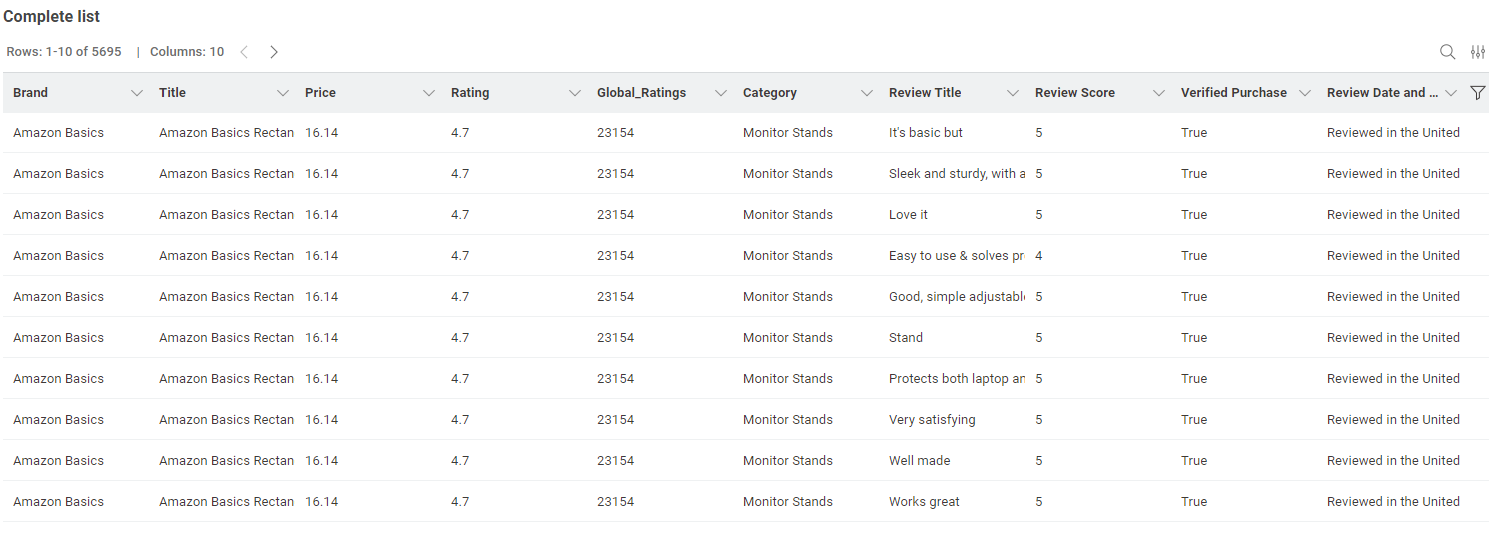
Join the products and reviews to have a final full table.
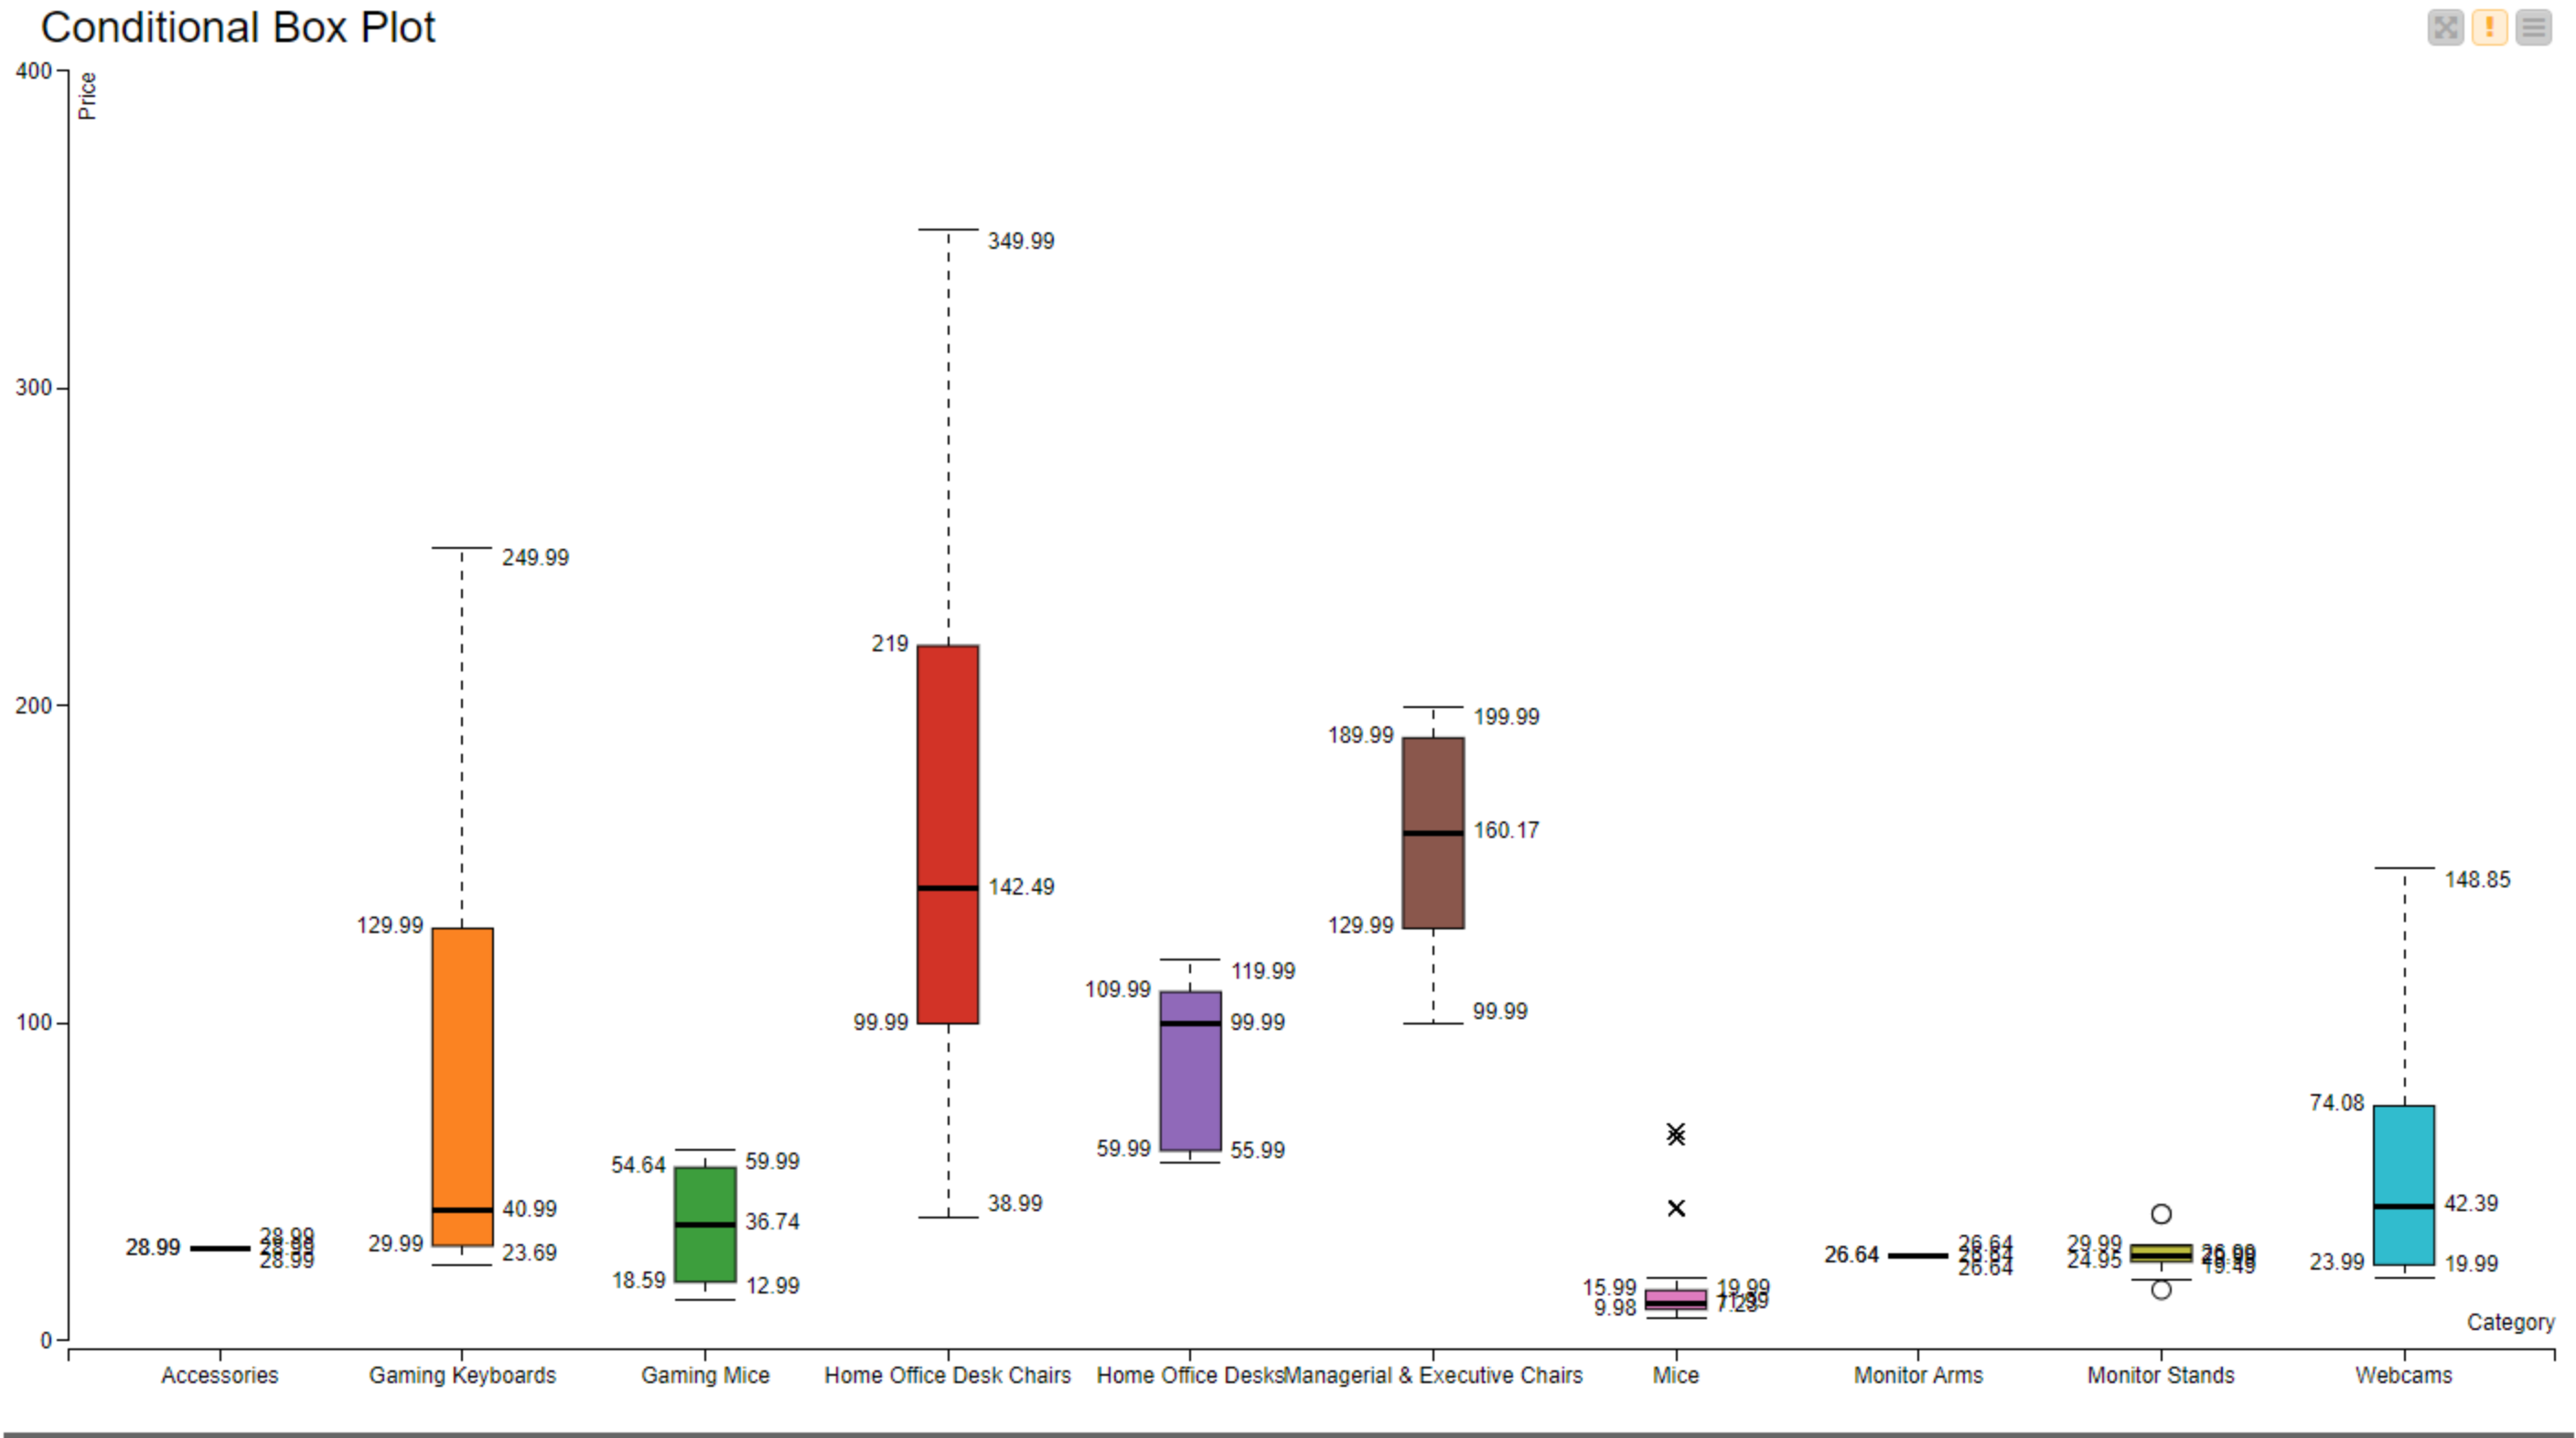
Visualize the results
This is a simple visu, only showing number in tables. It could be improved.
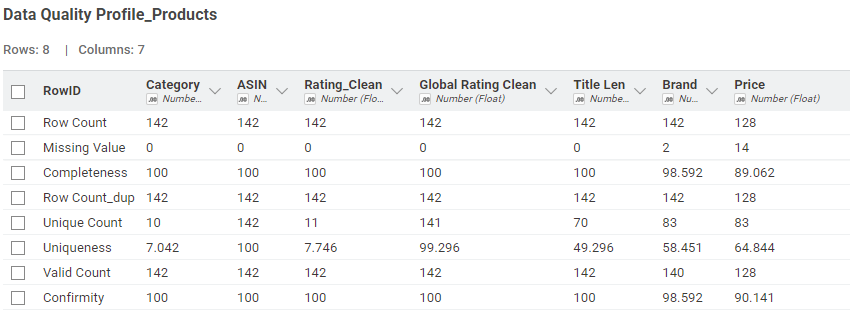
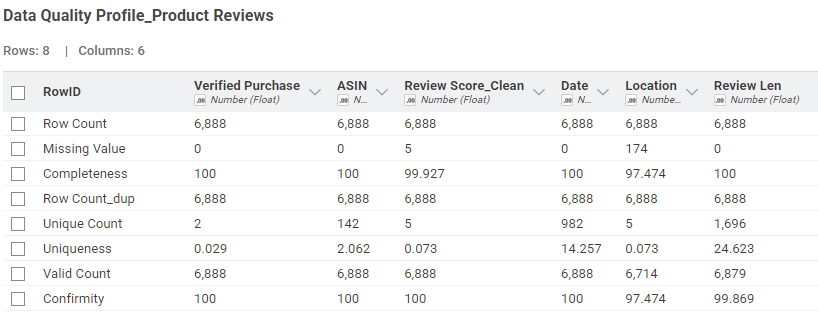
I decided for this one to show the stats per dataset - knowing the quality of each dataset allows the data scientist to improve the part that is not perfect. And when possible, showing the measure per column - again, only for some of them for the exercise. It could be extended way more.
…but the simple Statistics View node gave the best entry into the data.
Some columns are better treated as numbers rather than strings so some processing of the ratings and prices is needed.
Here is my solution to this week’s challenge. JKISeason4-28
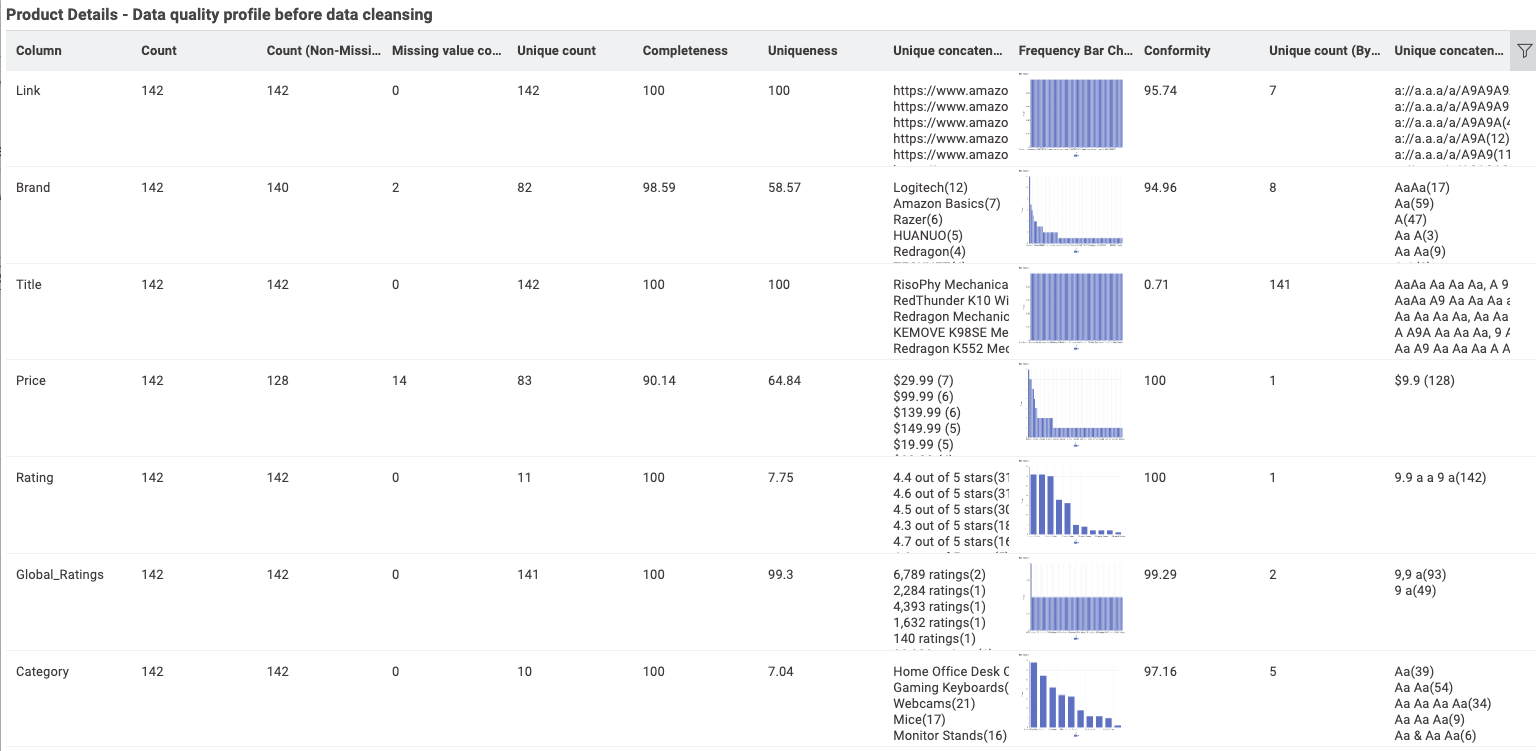
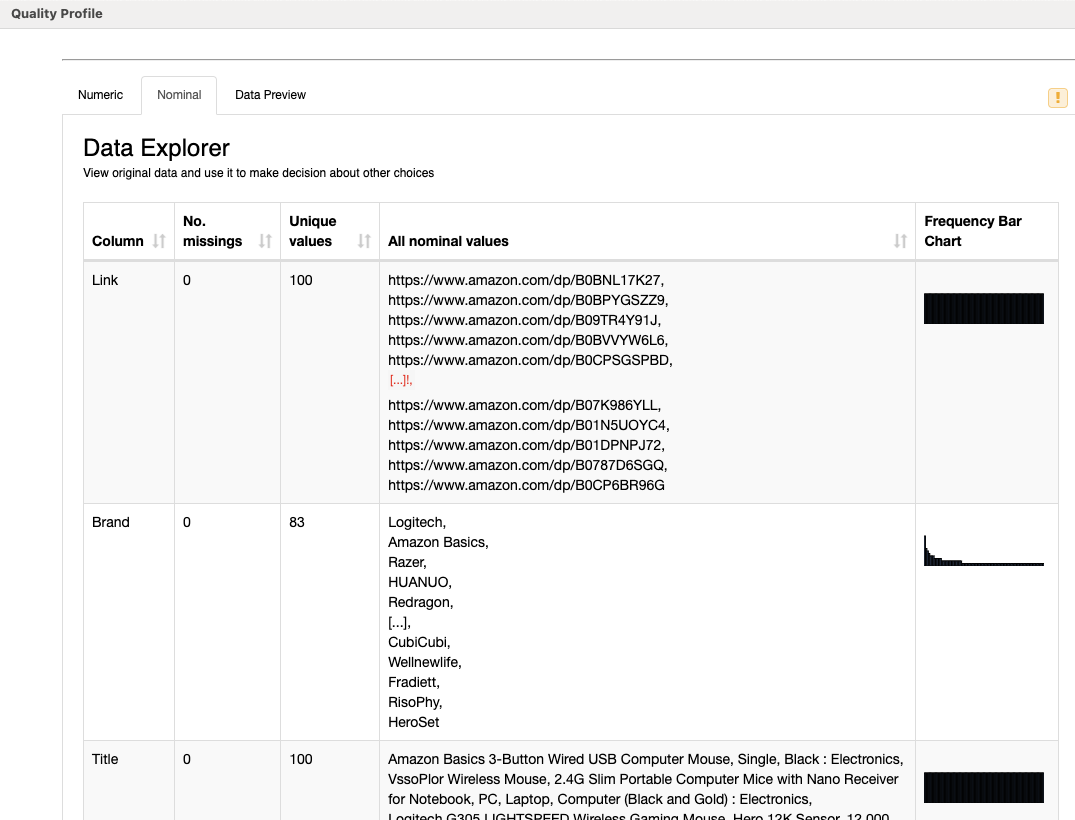
I have to agree with @trj that this challenge was a tough one. I definitely had to leverage from the Lesson 3 self paced L4-DA Data Analytics and Visualization: Specialization and utilize the Data Quality Profile components that were built for this type of data quality metrics (i.e. completeness, uniqueness, etc). @jproudfoot111 also mentioned the use of the interactive data cleansing component and I also leverage this component into my workflow.
My approach to this challenge was to do a before/after data quality analysis based on the component tools provided.
The Data Quality Profile components were used prior to data cleansing tools. The Interactive Data Cleansing component is utilized for the dataset after data cleansing tools.
I then rolled up both component tools into one visualization for a comprehensive quality profile for the datasets.
I’m not sure if this is the correct approach but I had fun trying. Cheers
Here’s my solution. I have no previous experience with these quality metrics. I used the following definitions generated by Gemini:
To calculate data quality, you use a set of metrics. Completeness is calculated by dividing the number of fields with data by the total number of fields. Uniqueness is measured by dividing the number of unique records by the total number of records. Conformity (or validity) is calculated by dividing the number of records that conform to predefined rules by the total number of records.
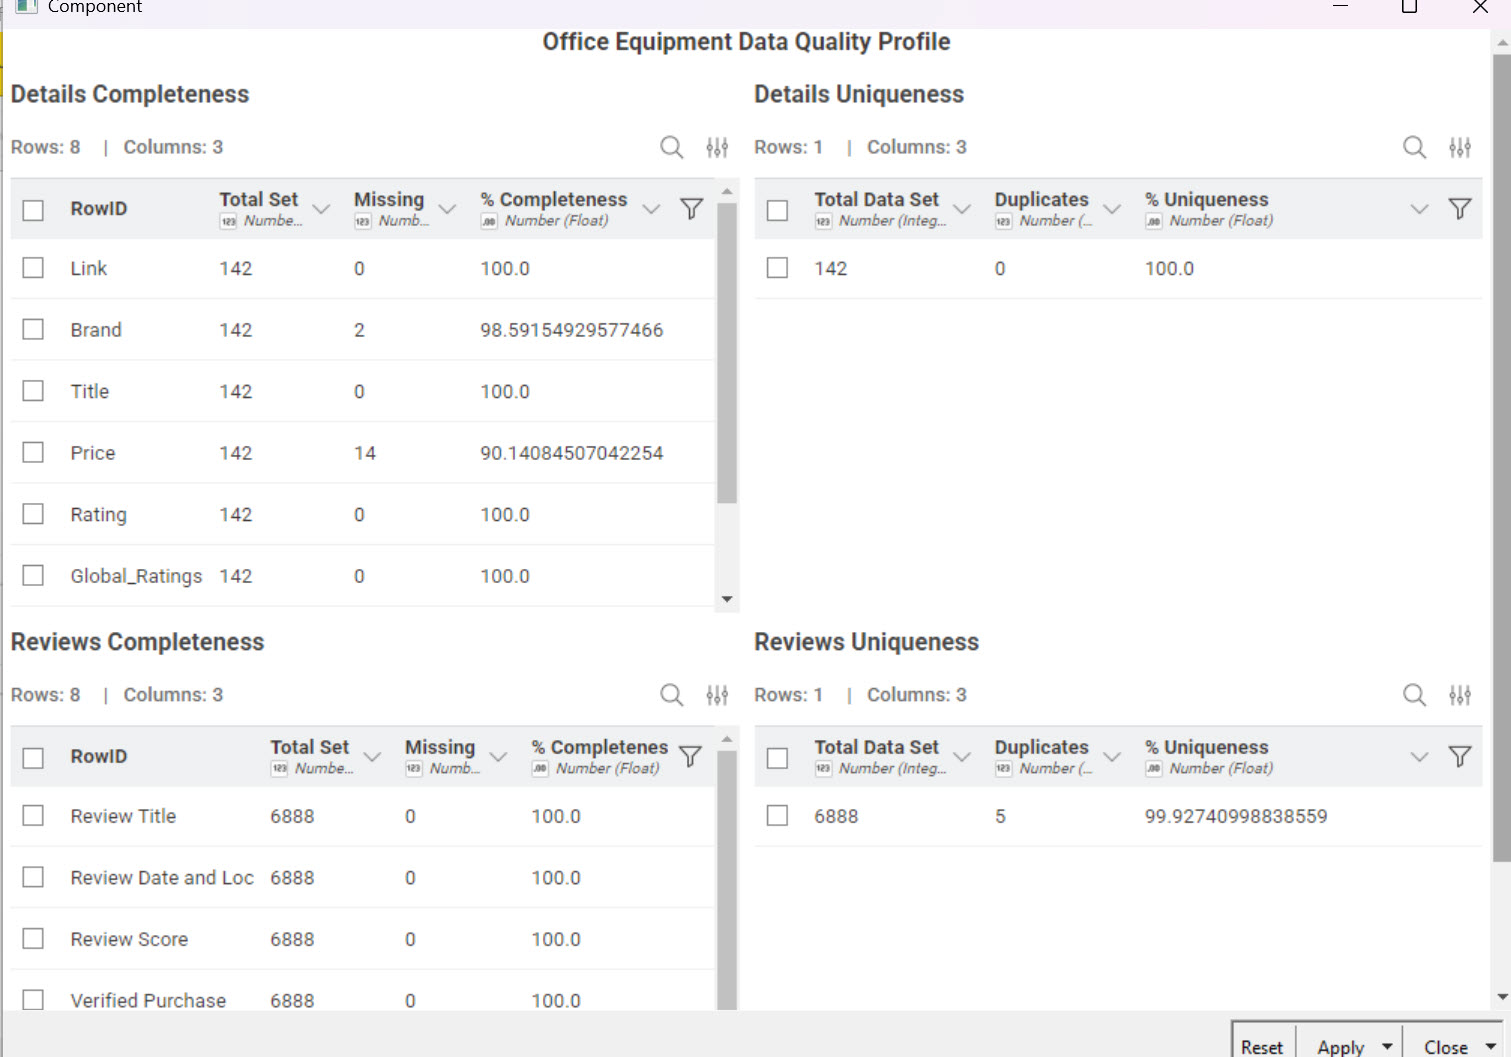
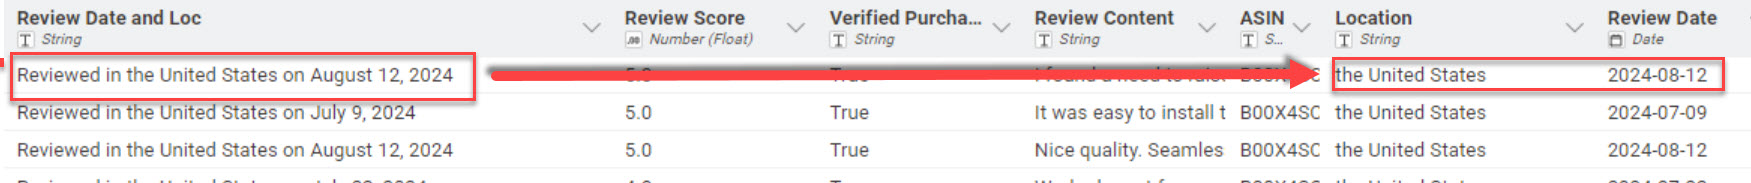
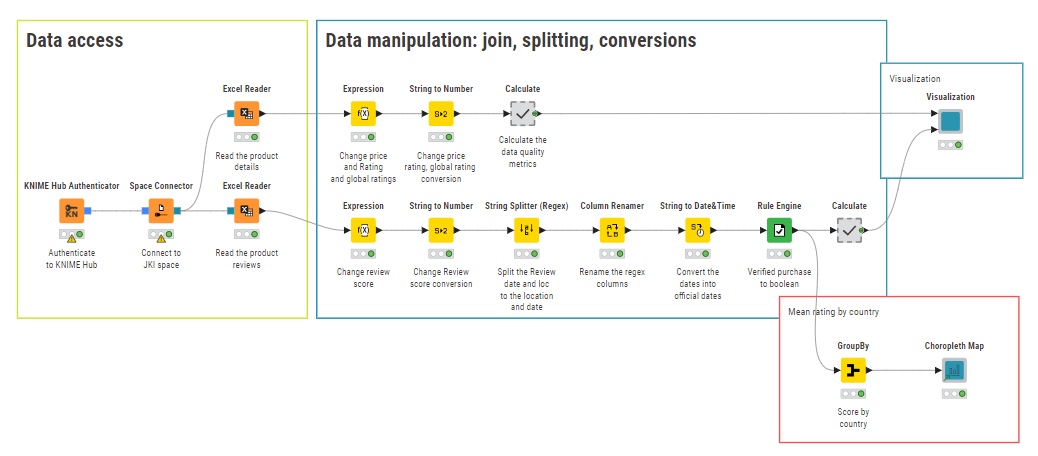
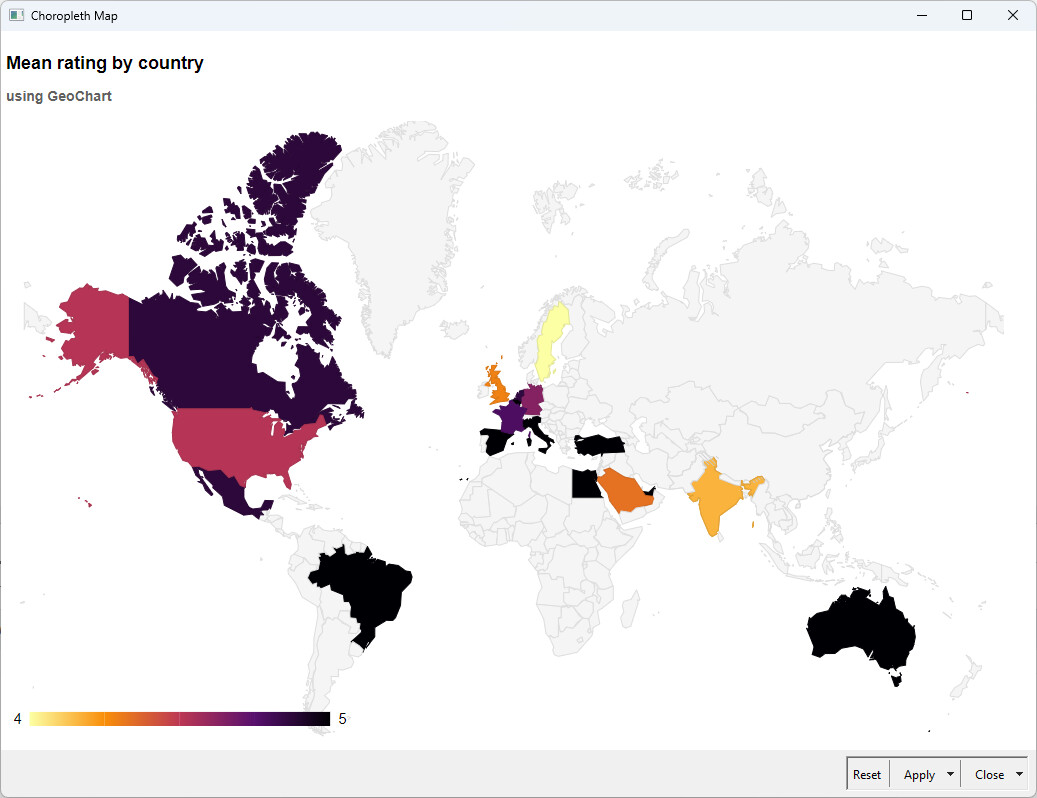
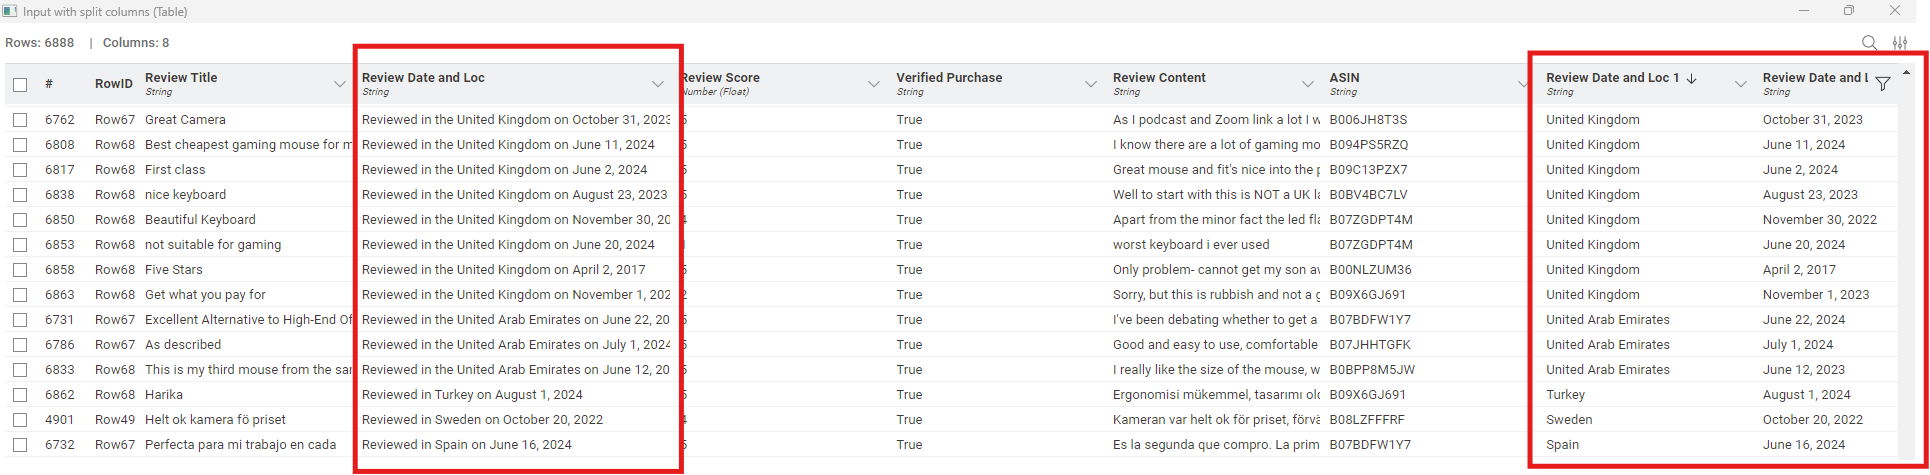
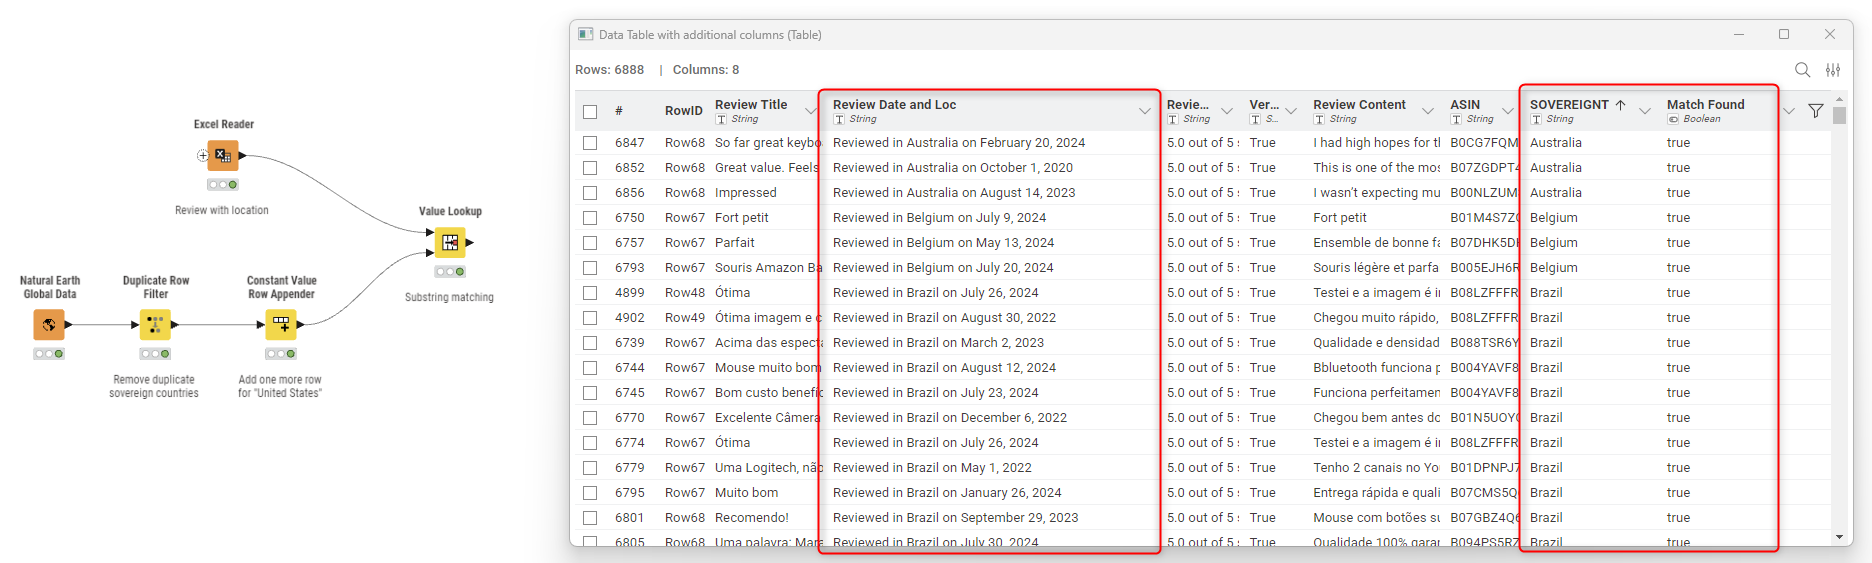
Taken literally, there were no predefined rules provided, so I didn’t attempt to calculate Conformity. By manual inspection, all of the data sets were the same. so Conformity should be 100%. Although it wasn’t part of this challenge, I extracted the review locations and dates so they could be included in further modelling (see below.) The biggest problem would appear to be that ~10% of the item prices are missing.
As I have extracted the locations I wanted to use some geo analytics (which could be expanded if I had more time), but I have created a map regarding the countries (it’s just the extra )
The location extraction was a real challenge for me as well. Ultimately I have used the string splitter (regex) node, which can split the text based on rules:
I used the node with this regex: “^Reviewed in (?:the )?(.*?) on (.+)$”, which is criptic as it can be, but chat gpt has no problem to understand (or generate) it
Here is my solution, I really did the bare minimum this week. I have simply copied the component from the L4 course and cleaned the data with the Expression node. It took me a while to understand the Bytefreq column from the component. I am quite happy to have this component now. It is also a great workflow to teach basic data management concepts as well as data stewardship. Many thanks for this challenge!
Our solution to last week’s Just KNIME It! challenge is out!
This was a tough challenge, but you all went above and beyond with composite visualizations that really helped assess the datasets’ quality. It was also interesting to notice that even simpler nodes, such as Statistics View, brought a lot of value to some solutions.
Now an important announcement: there is no new Just KNIME It! challenge coming out tomorrow! Just like last year, we are giving ourselves and our community a Thanksgiving break. We will be back with a new challenge on December, 3rd – stay tuned!
Hi folks, thanks for sharing your solutions - great ones!
I see that some of your shared different approaches concerning the country extraction - something not so trivial. I want to share (yet another) approach that uses a relatively new node in the Geospatial Analytics extension. The node is called Natural Earth Global Data ( Natural Earth Global Data – KNIME Community Hub ) and, among other things, retrieves the full name of sovereign countries.
In this way, you have a full list of country names in seconds and can perform a substring match with the Value Lookup node (check the advanced settings to find this config).
I noticed a Java heap space error on the Data Quality Profile component for the “Review” dataset that is sourced Metanode for Frequency Bar Chart processing. I had to remove the Sorter node in this part of the workflow and that seemed to work for me when running the workflow.