Link updated : KNIME_Challenge-3 – KNIME Hub
The dataset is messed up. In fact, “Prostate” is the most frequent male cancer site in 2017, but the whole “Male Genital System” section is not present in the dataset, so “Prostate” does not rank in the top 5 sites.
Here is my solution. I get a lot out of this (KNIME it) by 1) make my own solution 2) look at other solutions 3) see the differences and learn.

1 Like
Hi everyone,
Here is my solution.
1 Like
Hello KNIMErs,
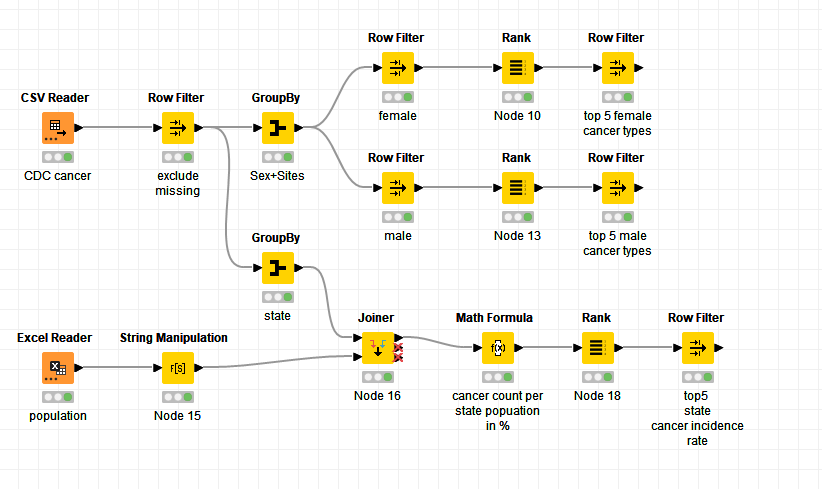
Here is my solution to #justknimeit-3 :
KNIME Hub > gonhaddock > Spaces > Just_KNIME_It > Just KNIME It _ Challenge 003
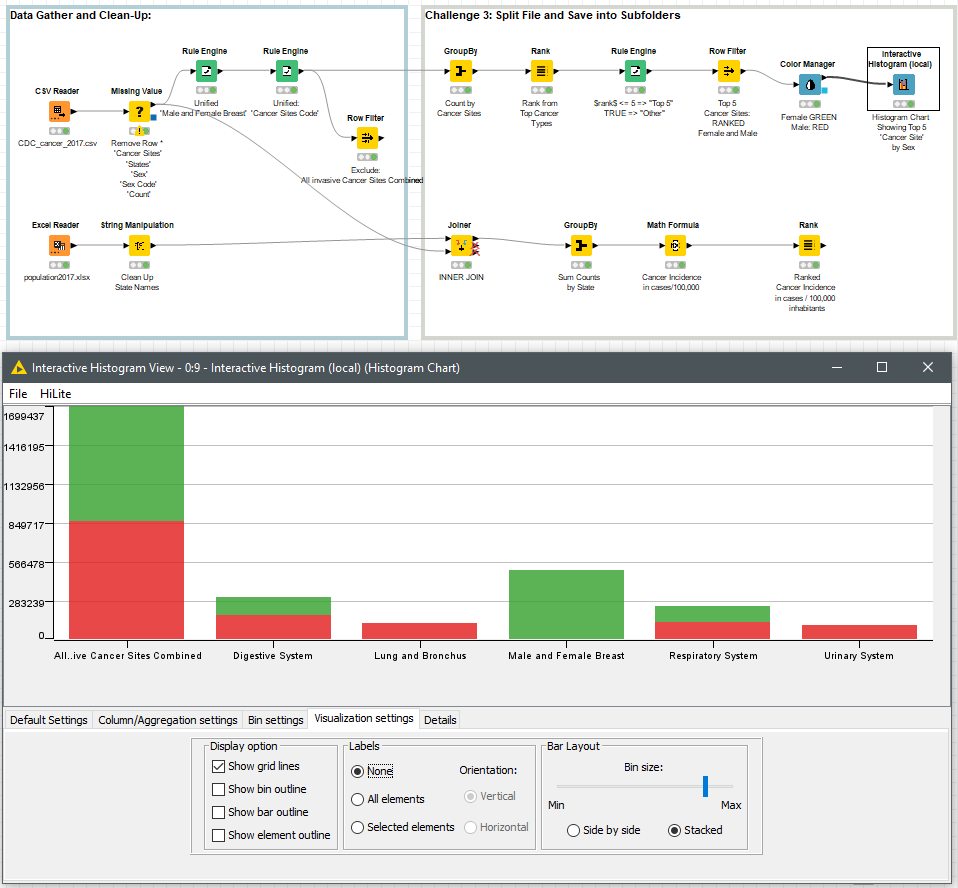
Female: GREEN
Men: RED
BR
4 Likes
I’ve tried to correct the dataset. This is my solution
KNIME_challenge_3.knwf (69.6 KB)
2 Likes
4 Likes
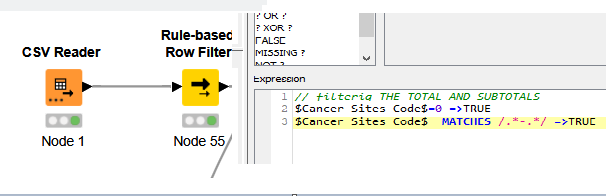
After reading some of other solutions I noticed that I missed it out that the data were mixed with the totals , I think now it is working fine
We should exclude the true in bellow
1 Like
Hello,
I did some updates and modifications to the workflow. Some literature has been added order to clarify my results as well:
- An error on 'Cancer Site Code’s Rule Engine has been amended.
- It has been connected the exclusion of ‘All invasive Cancer Sites Combined’ site type, aiming to avoid bias in final results.
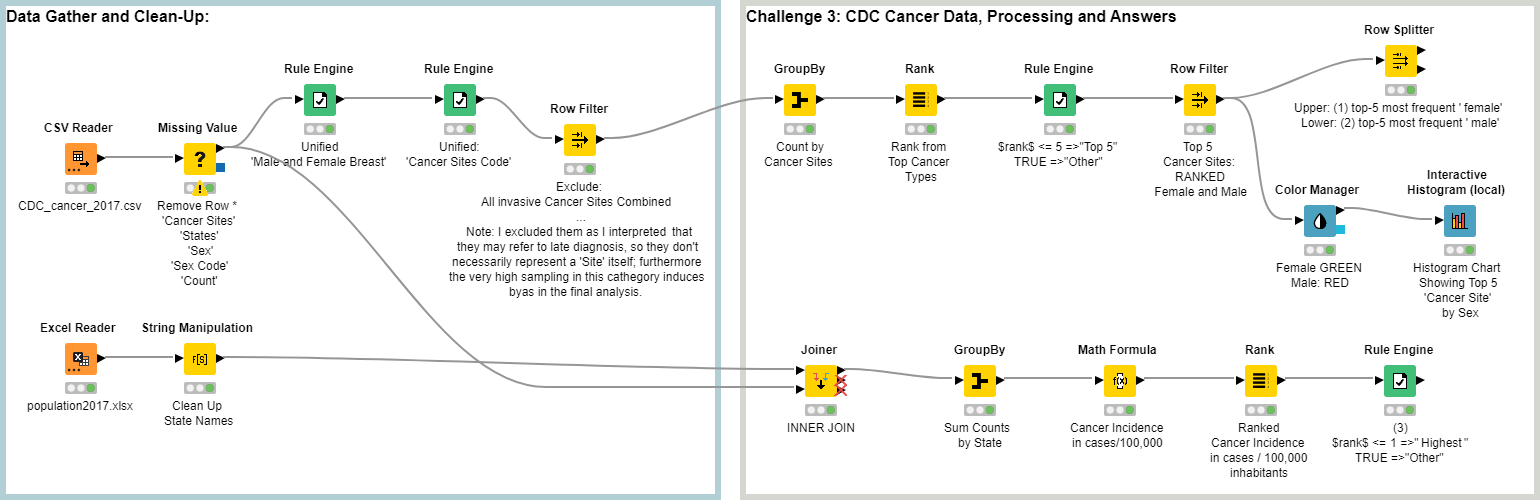

Female: GREEN
Male: RED
BR
3 Likes
My solution on Knime Hub KNIME_challenge_3 – KNIME Hub
2 Likes
I’m (finally) not the author of this week’s challenge, so I can participate and share my proposed solution!
Thank you guys for pointing out your assumptions and concerns in this thread. I have also included mine (i.e. I excluded some cancer sites since they are “aggregations” of other counts).
I also got inspired by the picture in the challenge page and came up with a Choropleth map showing the incidence rate by state.
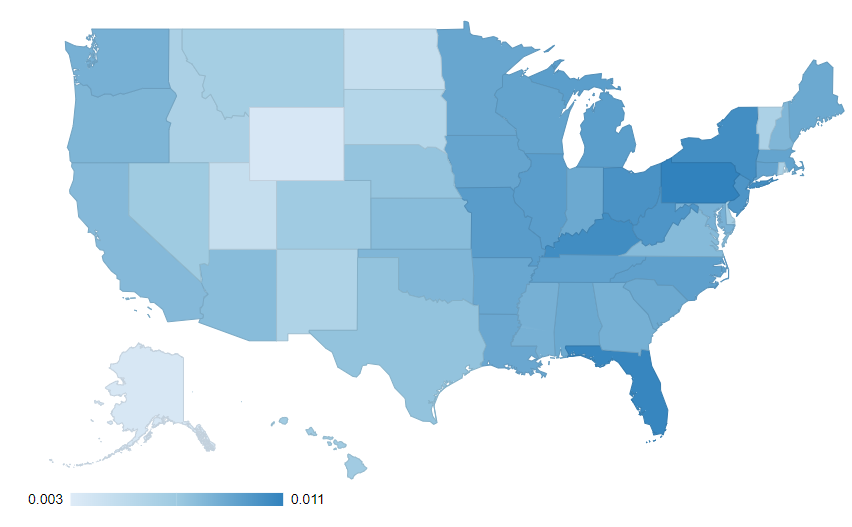
To do that, I used the Choropleth World Map component available on the KNIME Hub and modified the JavaScript code adding the option resolution:“provinces”.
9 Likes
here is my solution for this week’s challenge
I grouped the different breast cancer types distinguishing between male and female into one category and estimated the missing values as group means, based on gender & age to get an accurate estimate
3 Likes
Hi all,
Here is my solution ![]() to this challenge and my very first contribution on the KNIME Hub!
to this challenge and my very first contribution on the KNIME Hub!
4 Likes
Hi @duristef,
Thanks for your contribution!
Yes, as you’re hinting at, the results are going to be as good as the data is. It turns out that the data has problems that are going to end up reflecting on the solution. Our main goal here, however, is on how to answer the frequency questions by processing the data. How to clean the data, or how to improve its quality, are secondary (and more advanced) goals.
Cleaning and fixing datasets is definitely paramount for serious data science, and although we had not set out to focus on this here, we are pleased to see that our community is paying attention to it. ![]()
5 Likes
Here’s our team’s solution to the challenge!
As mentioned yesterday, results may vary depending on how you process or interpret the data. A detailed explanation to our solution is here: Just KNIME It! | KNIME
We’re very happy with the diversity in the answers! Big shout-out to everybody who participated and see you tomorrow with a new challenge.
#justknimeit #justknimeit-3
4 Likes
Hi! Here is my solution ![]()
2 Likes