Hi there
I finally and proudly present my go on the challenge.

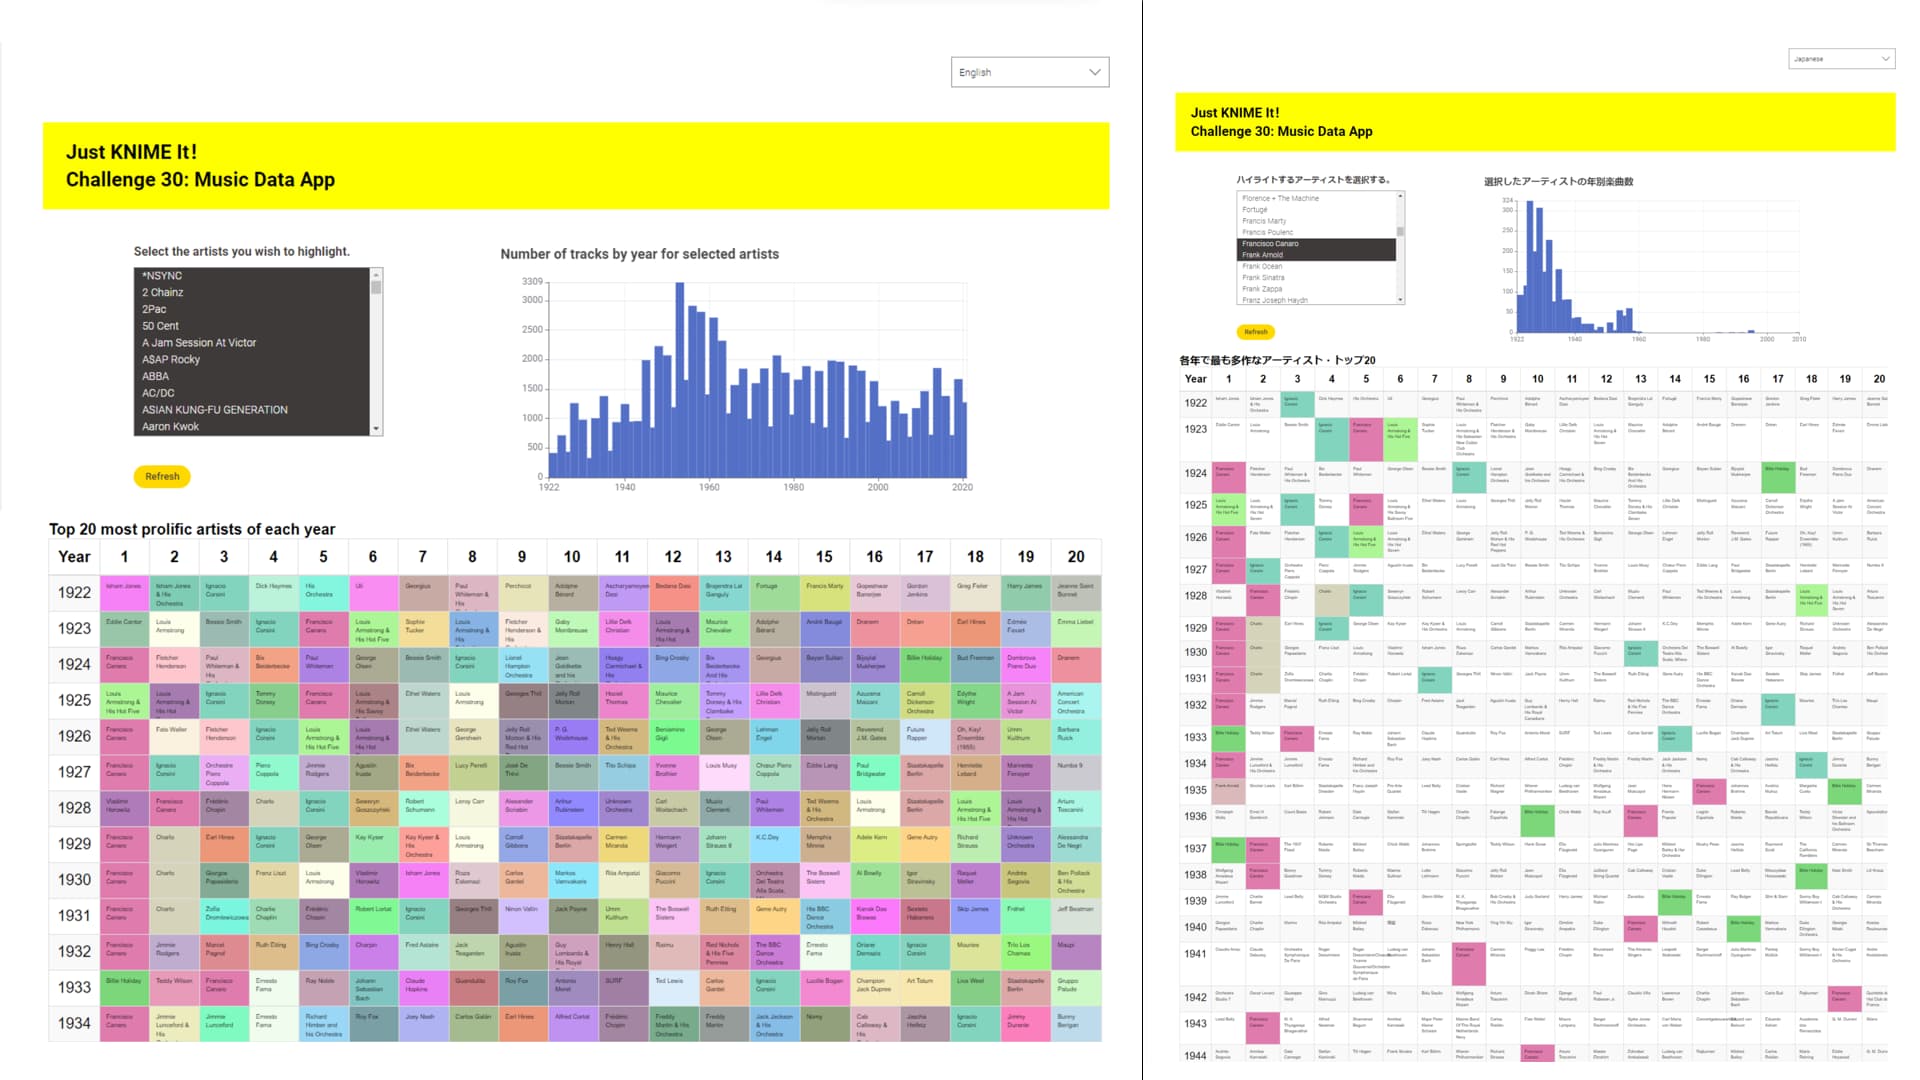
Firstly, I developed it with the modern UI so, annotation boxes are sized for that. In the classic view, well, it is not really readable.
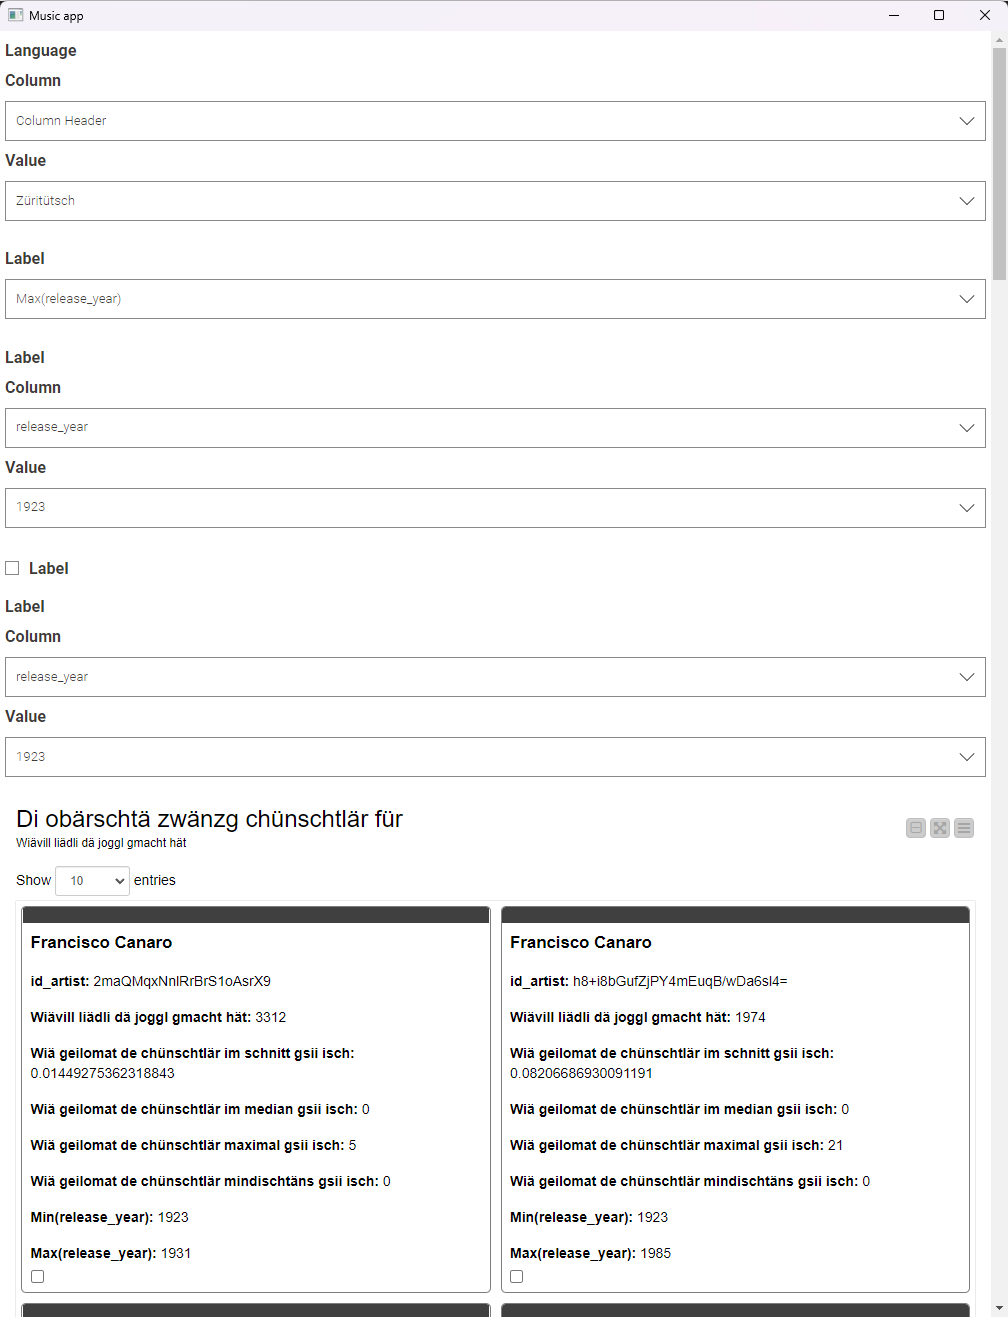
Then, as others have, I have put in my dialect as preselection. Have fun with it. Maybe you want to guess where it belongs to.
[Edit]
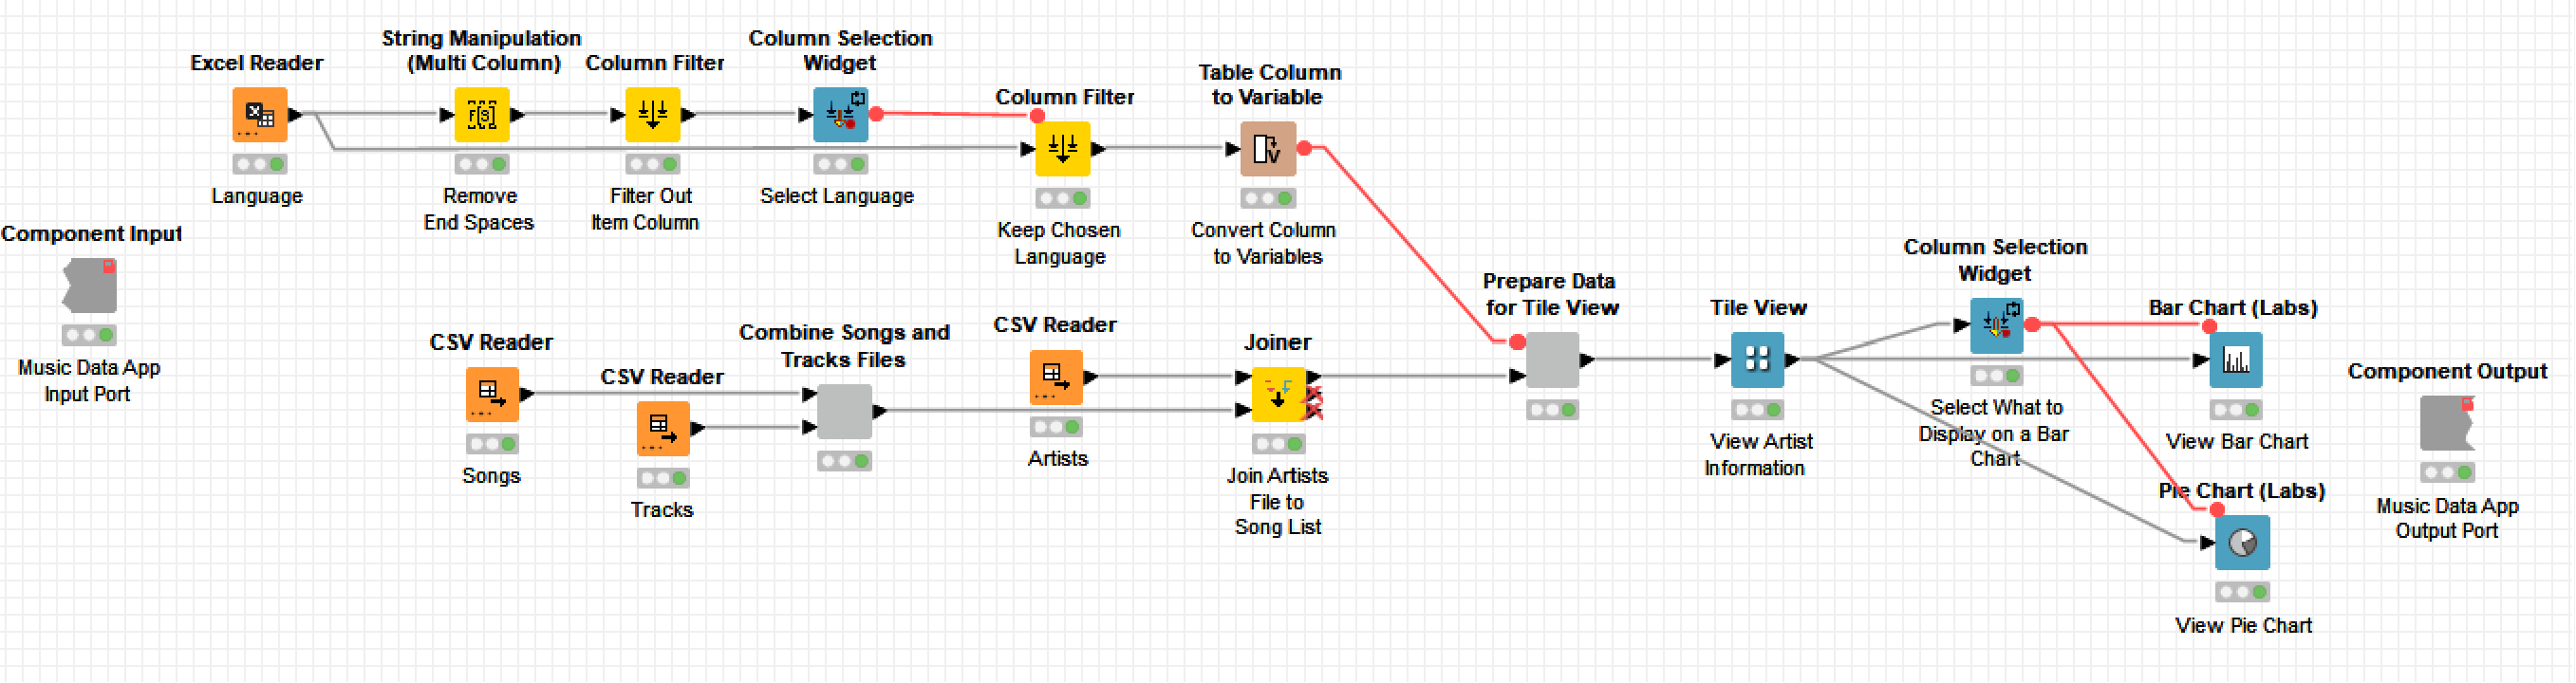
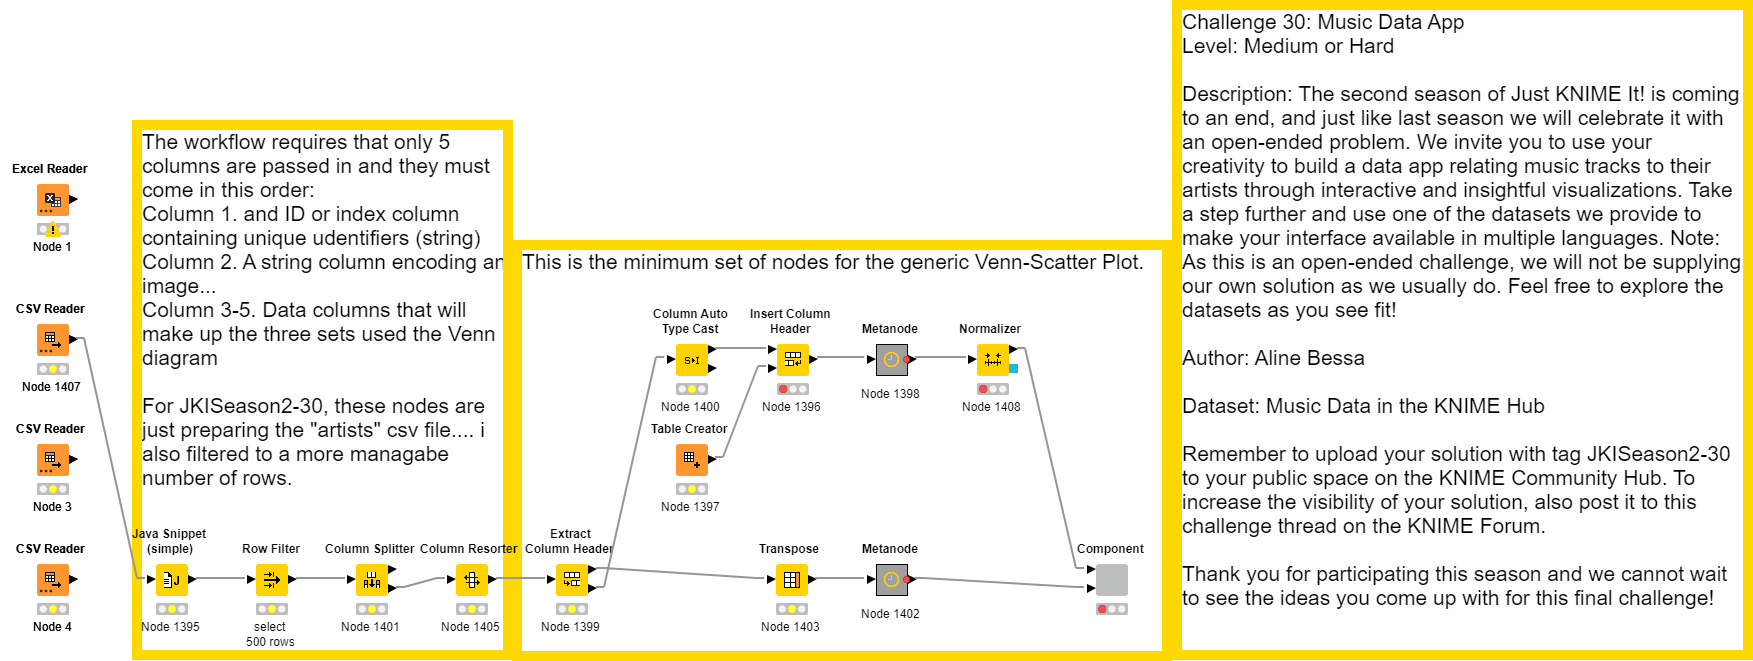
To me, my development workstation is rather powerful, having 24 GB of RAM. So, I developed the workflow to run entirely in memory. However, on my laptop when I presented my solution to my wife, I had to reduce the amount of data (facilities in the meta node for the entities) and make the group bys of the component run on disc instead of memory.
Last but not least, as I am quite new to creating other workflows than those of the courses, I was quite often having a glance at other solutions. Many thanks to the creators of them. The insights have been helpful. Having that said, my work probably has not much “finesse”. Please bear with me.
Further more, I have come across some questions while doing so. I probably should compile independent posts. I documented them, however, in orange annotations. If you feel the urge to reply to those questions, I would be happy to listen.
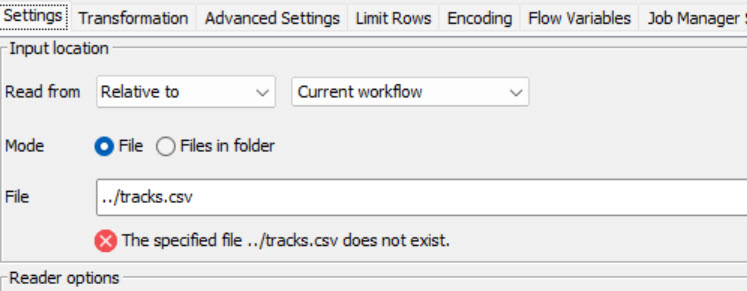
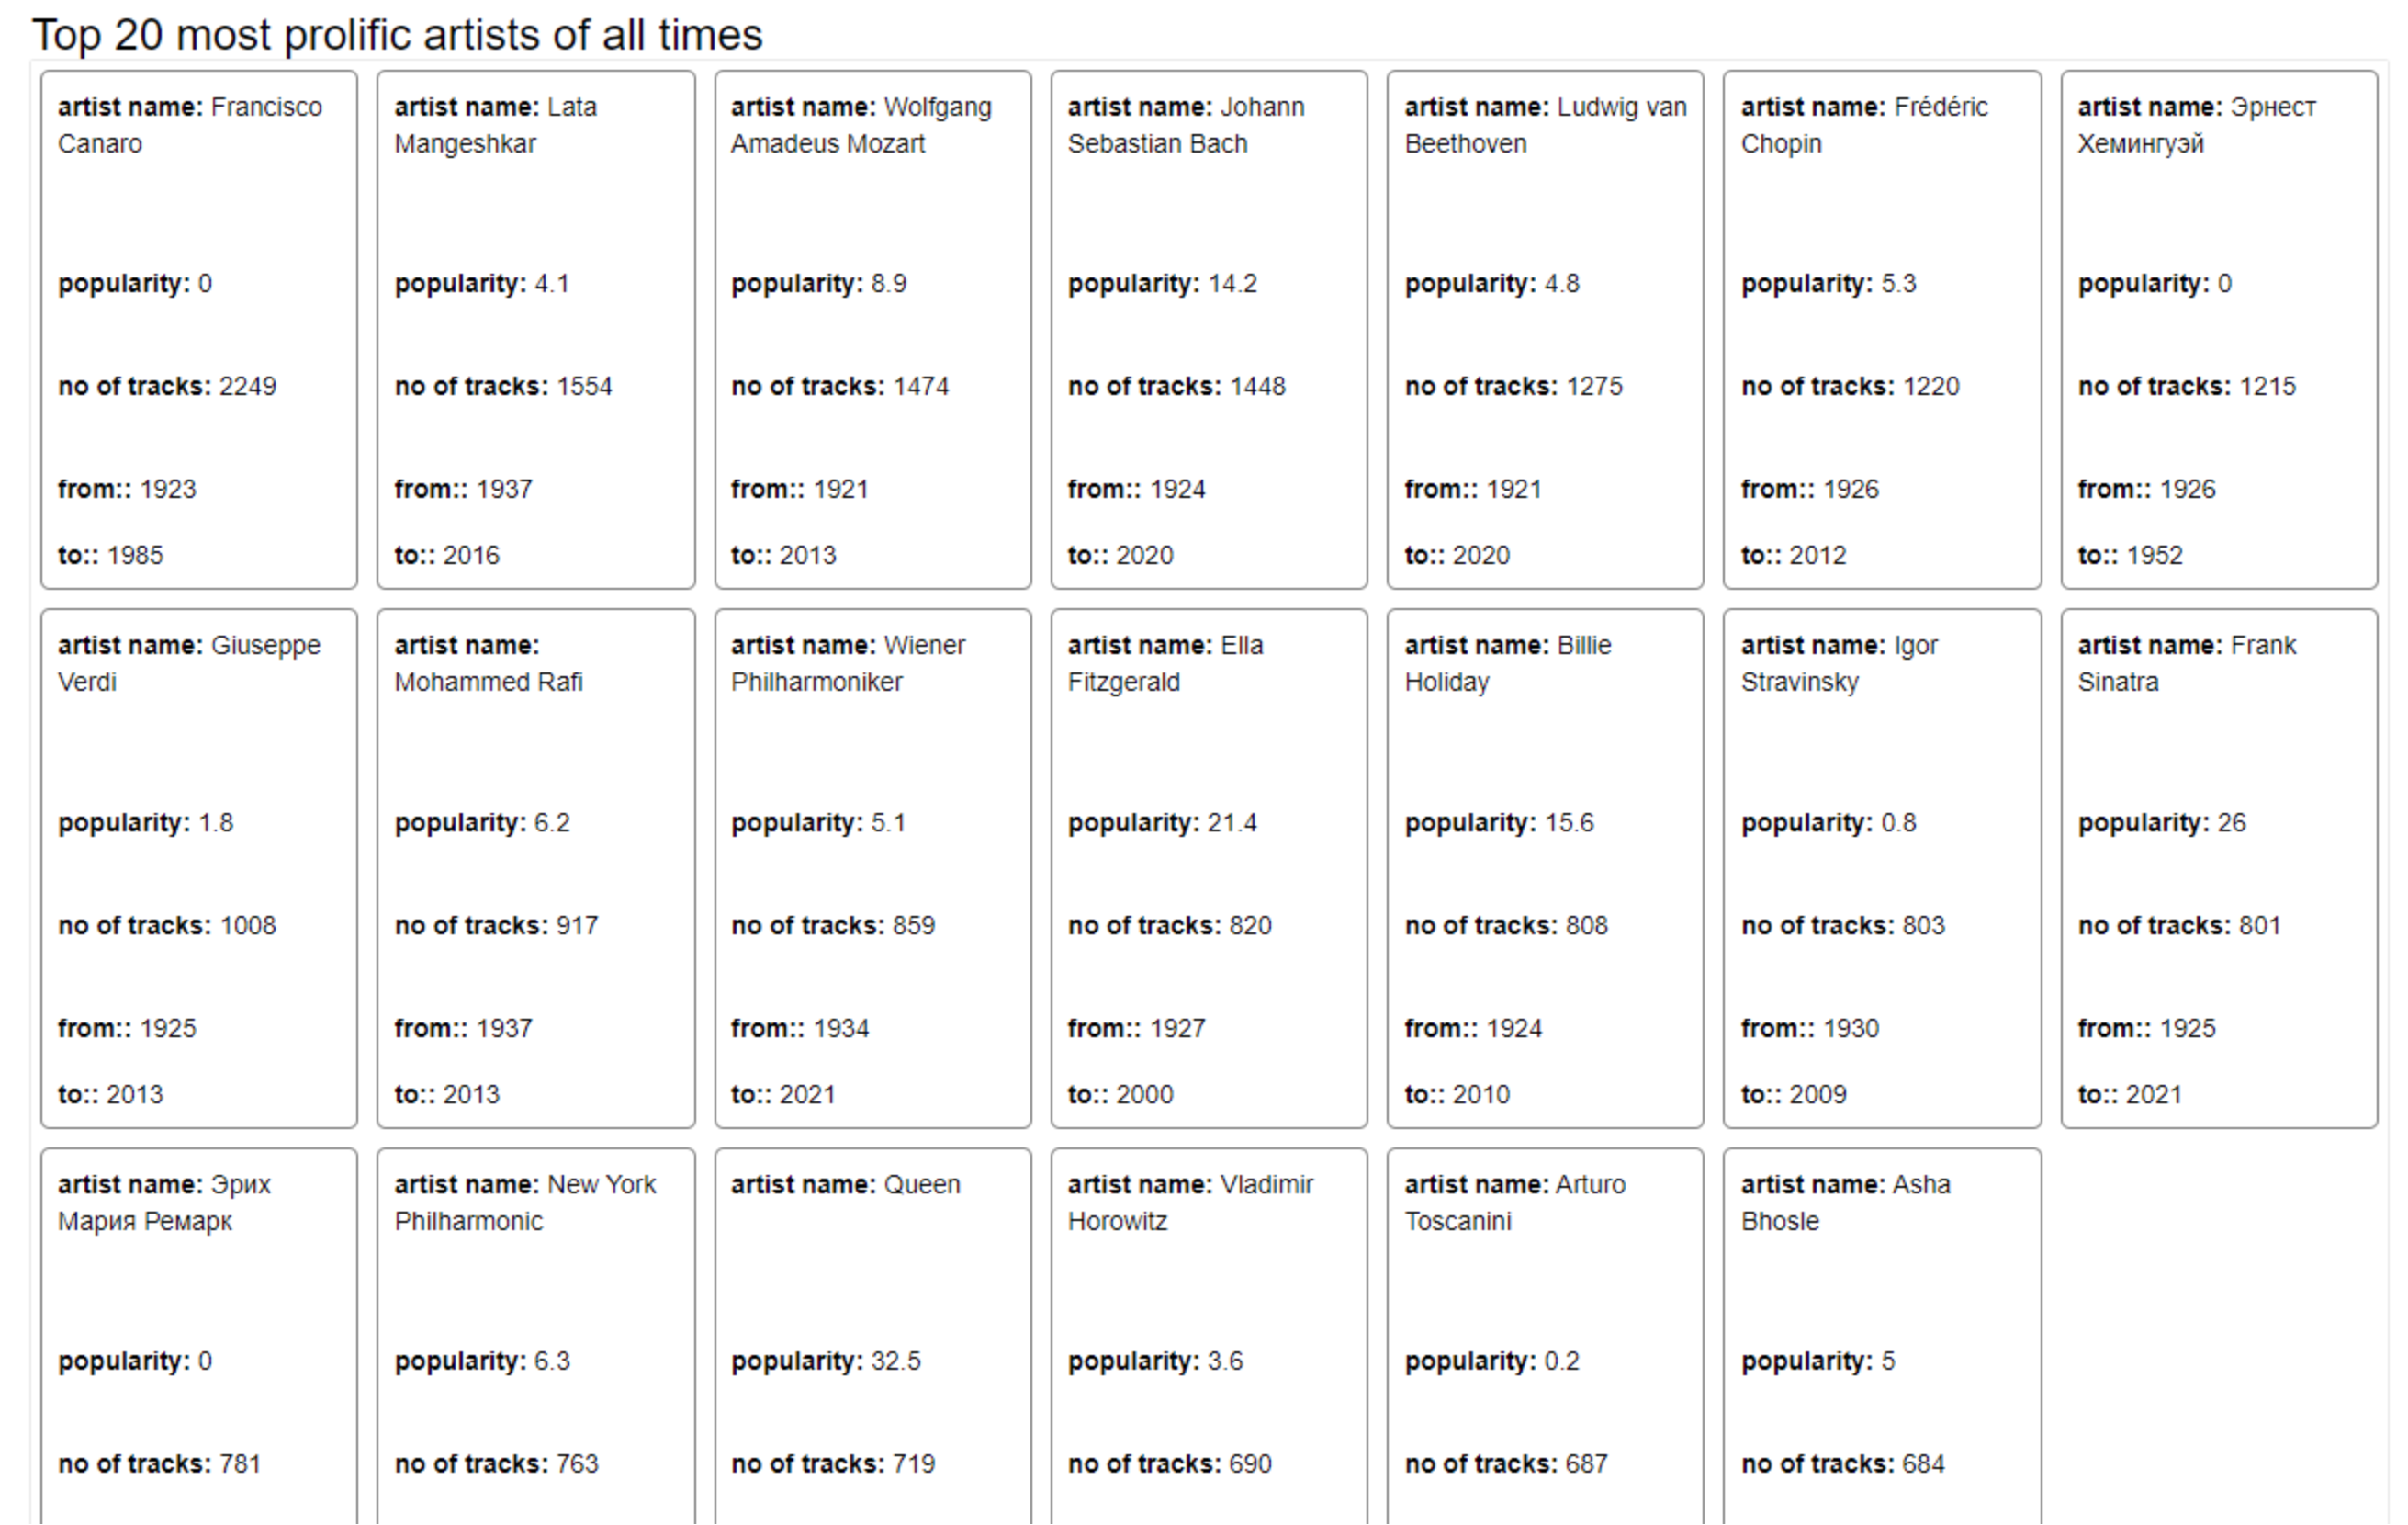
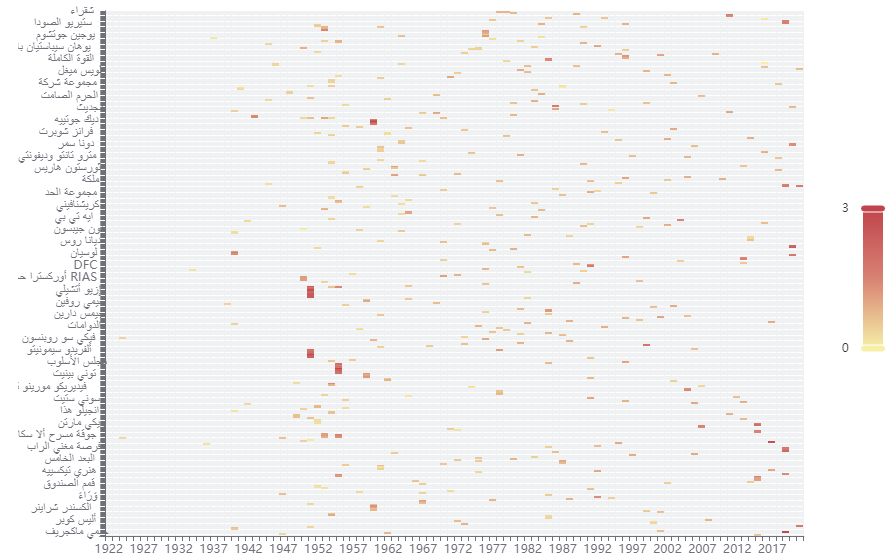
I could not make sense out of the artist data file, so I ignored it and compiled the information from the tracks and songs file. I had to wrangle the data quite a bit, but did not want to spend endless hours for the “perfect” solution. E.g. some songs do not have the artist’s id. So I plainly invented those, even though there might have been other songs with the same artist name and its id. Another thing is, that in my end data, some of the artists seem to share the same id. I did not investigate into that. It might be faulty data, it might be faulty implementation on my side. Please bear with me.
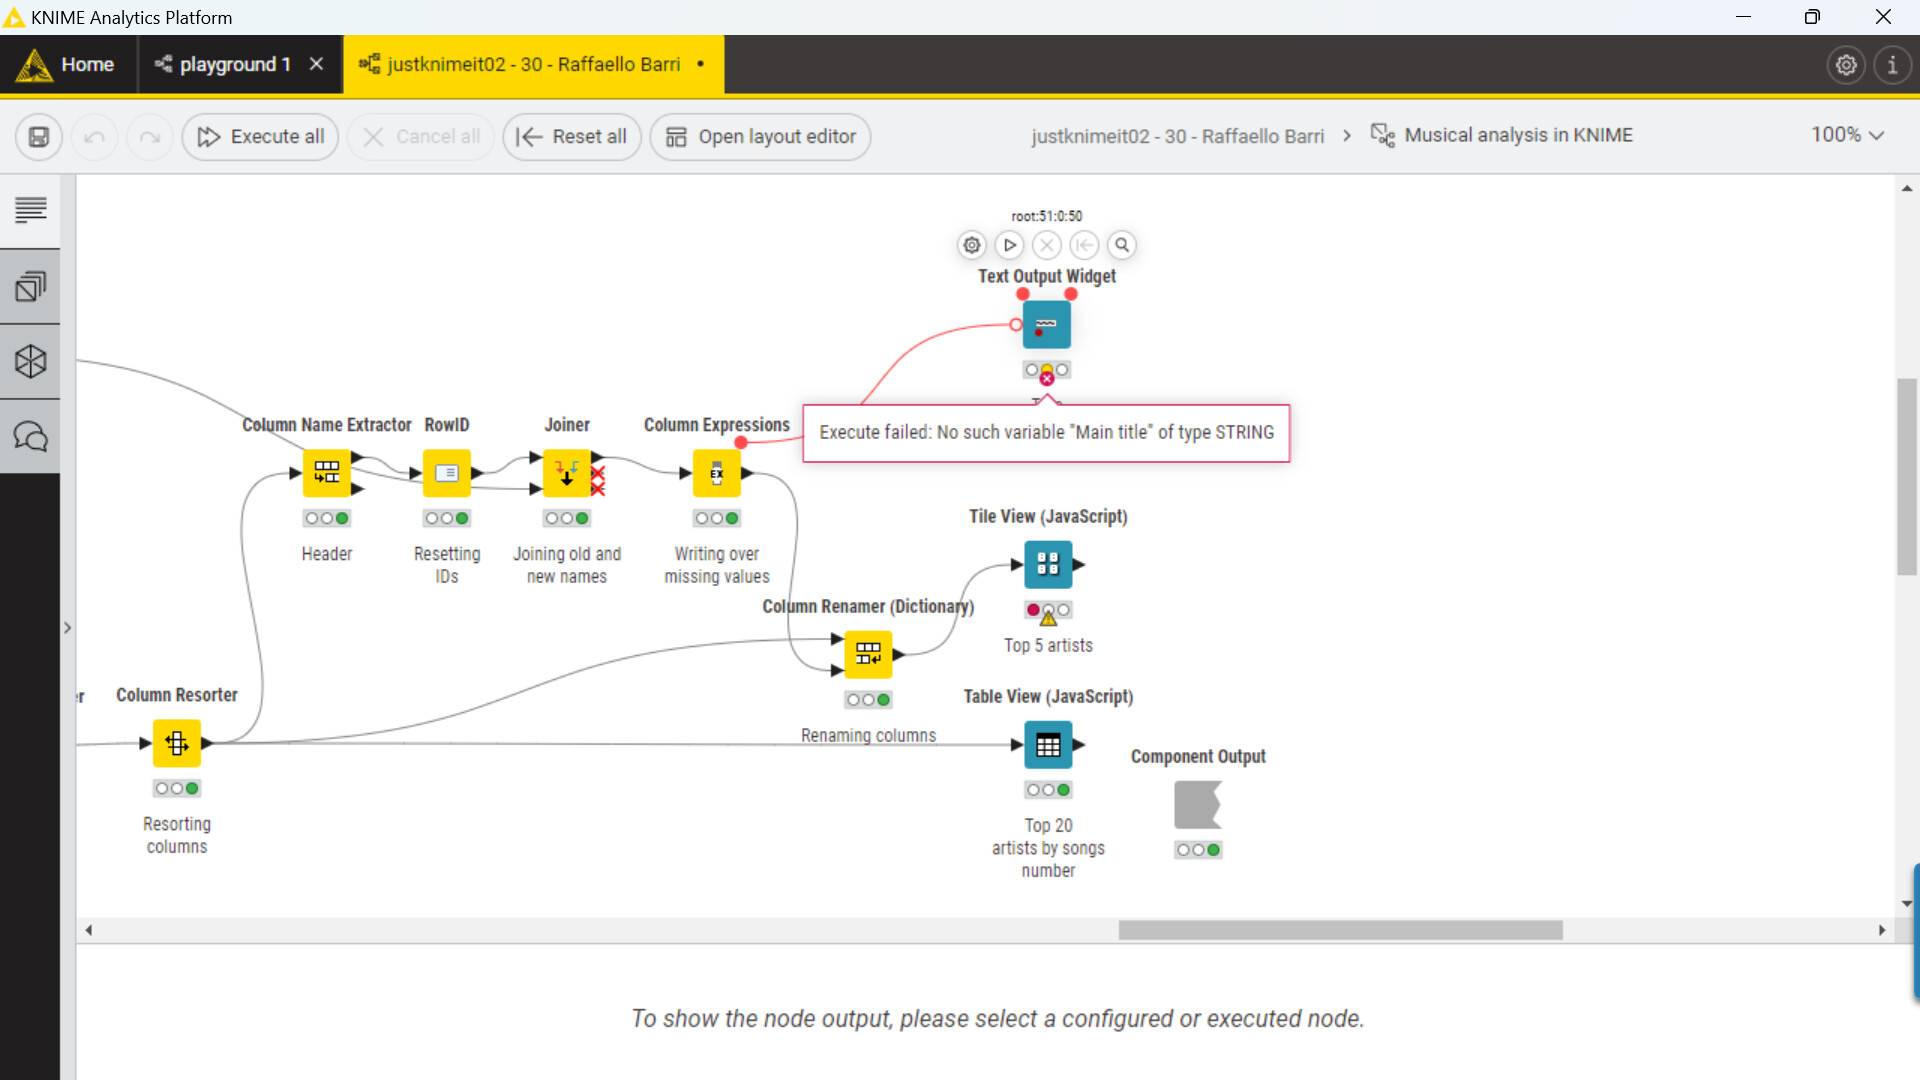
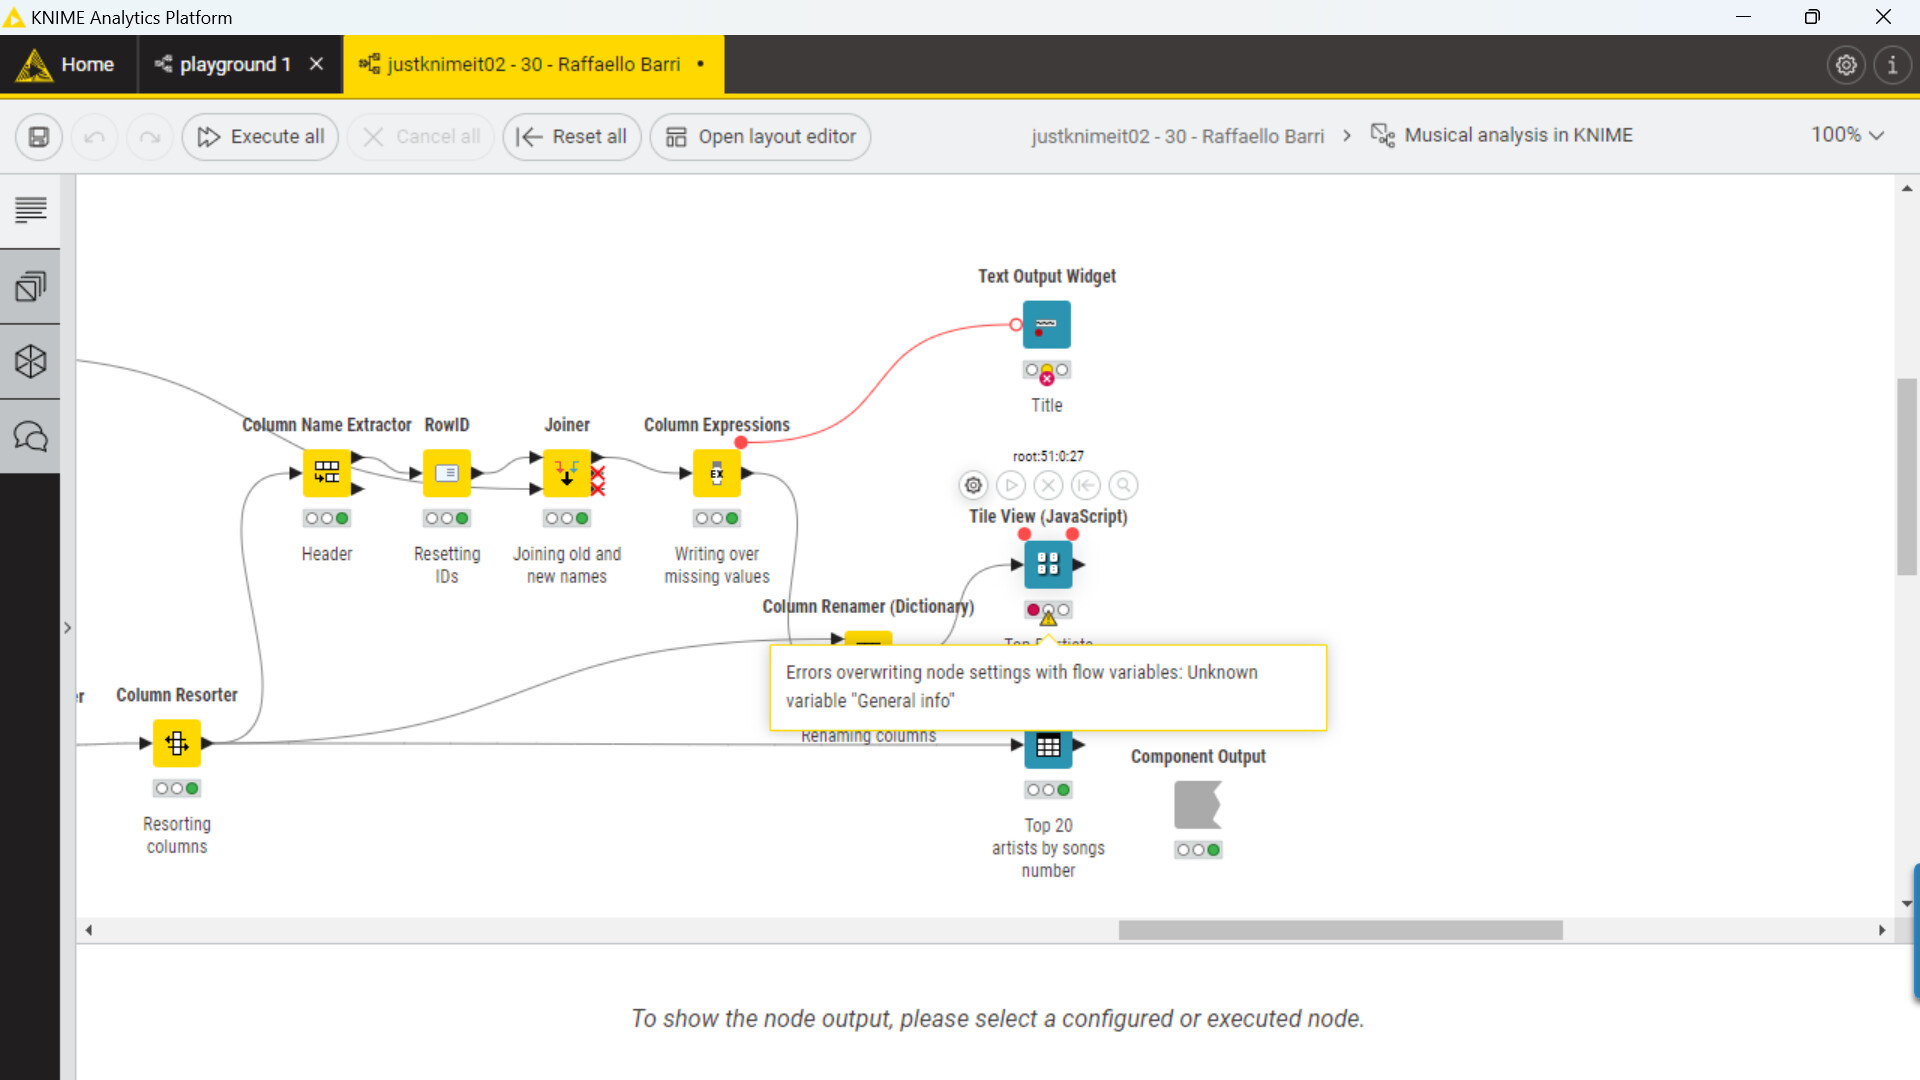
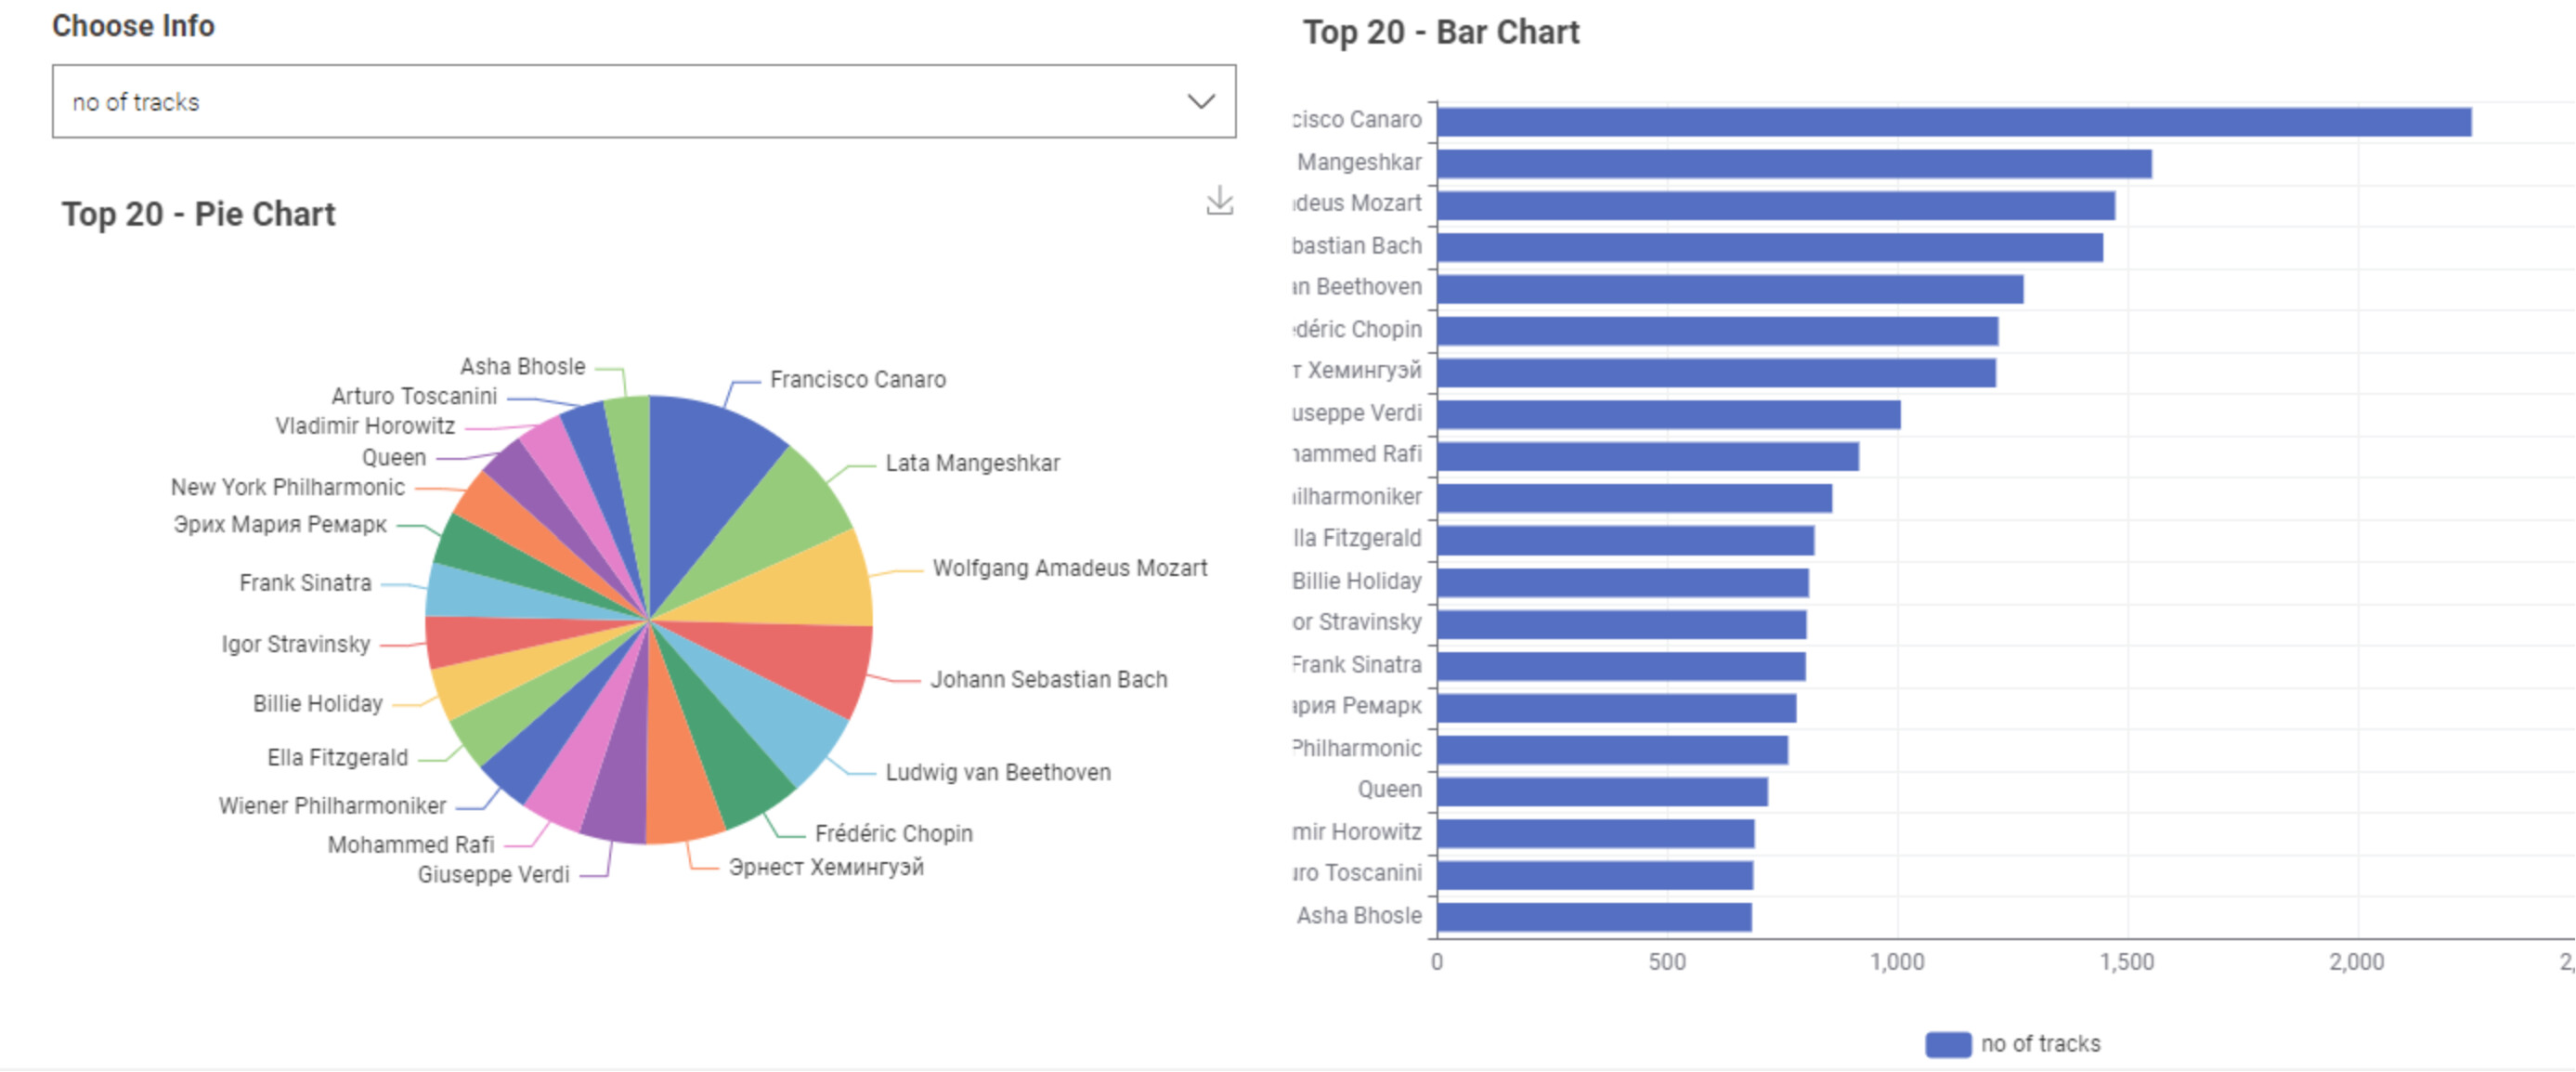
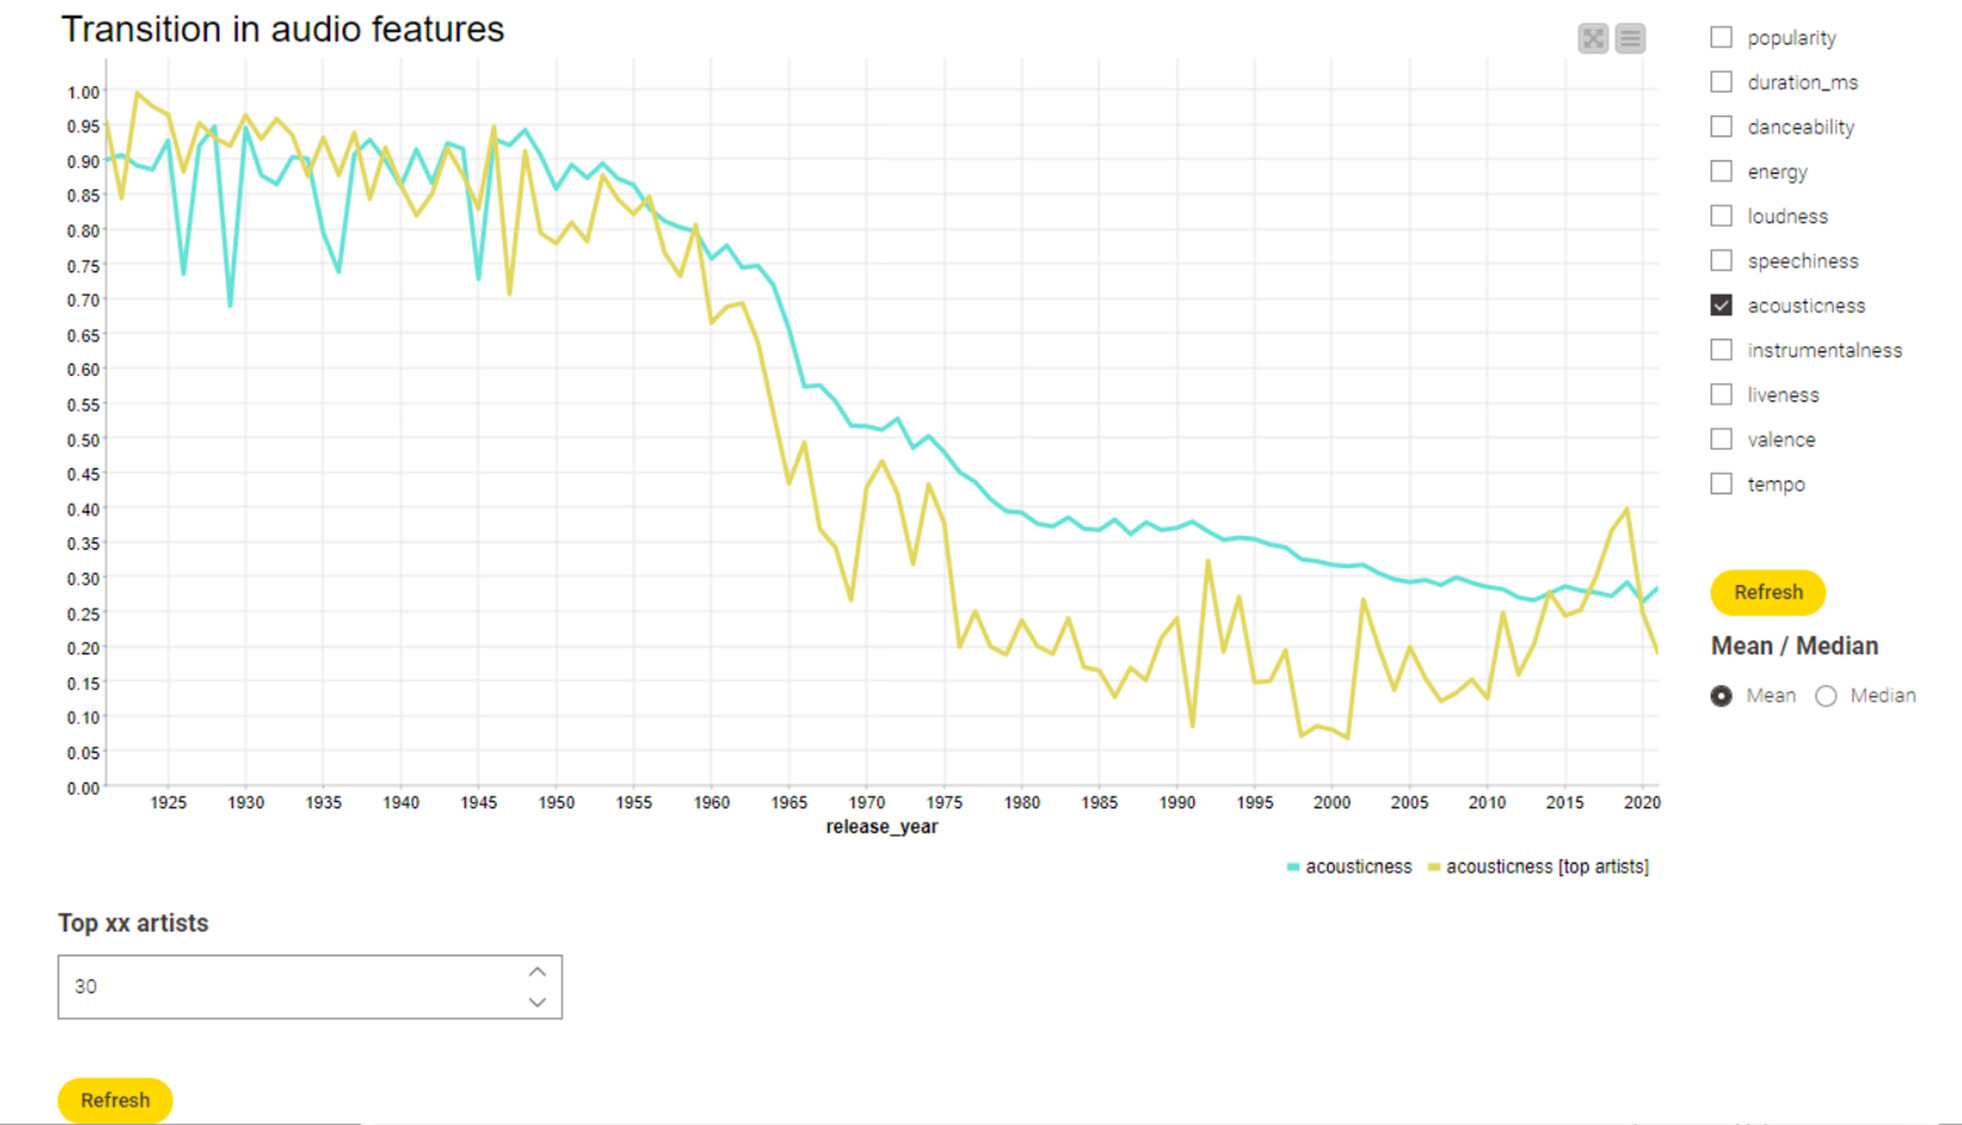
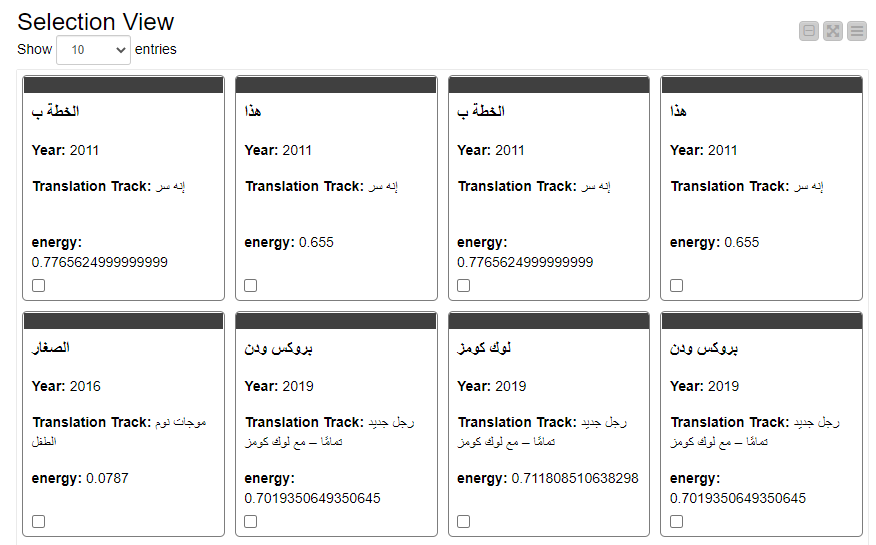
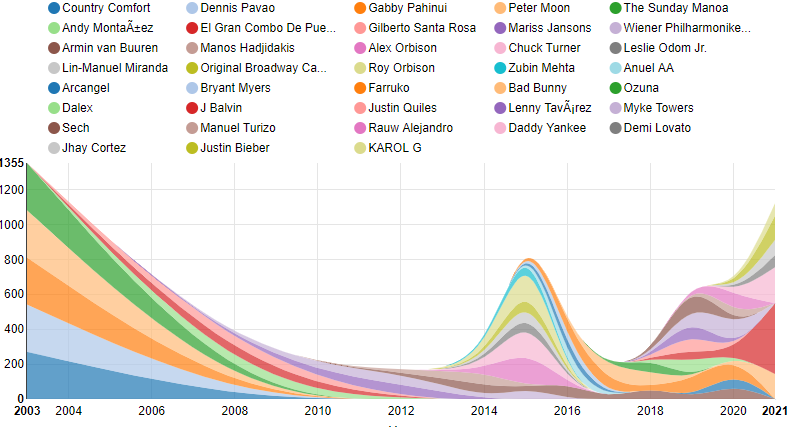
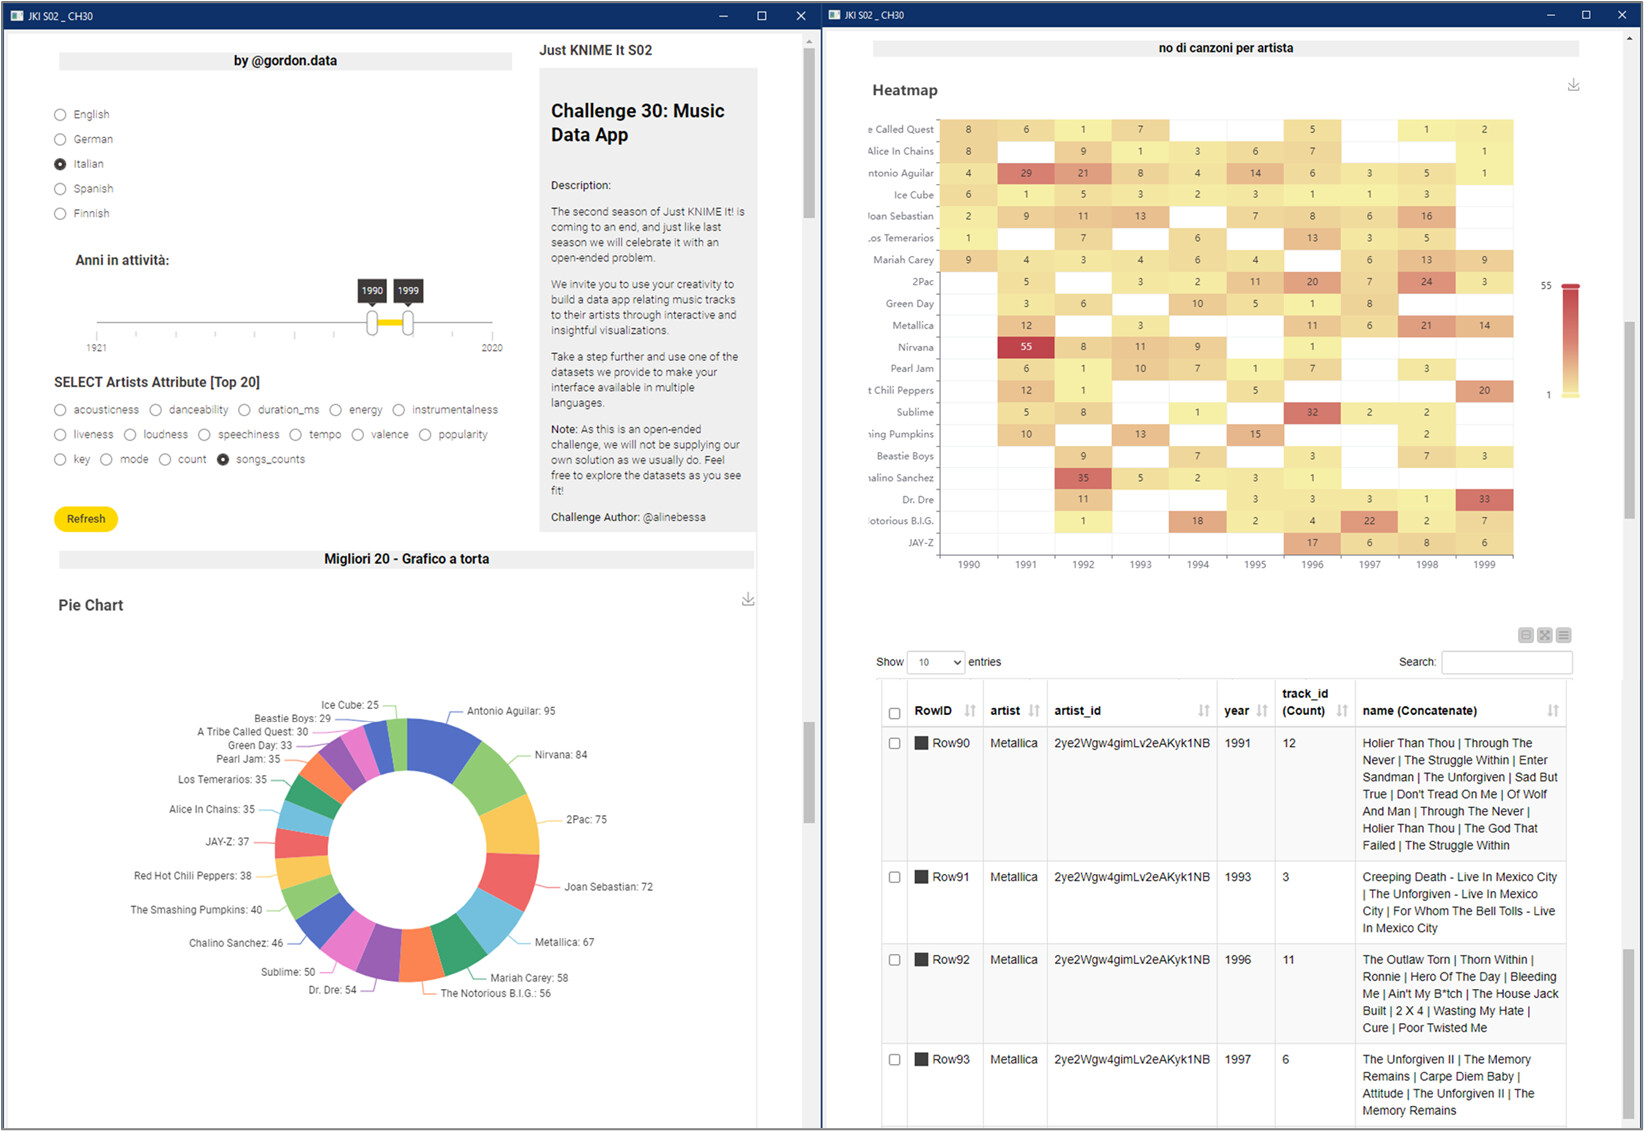
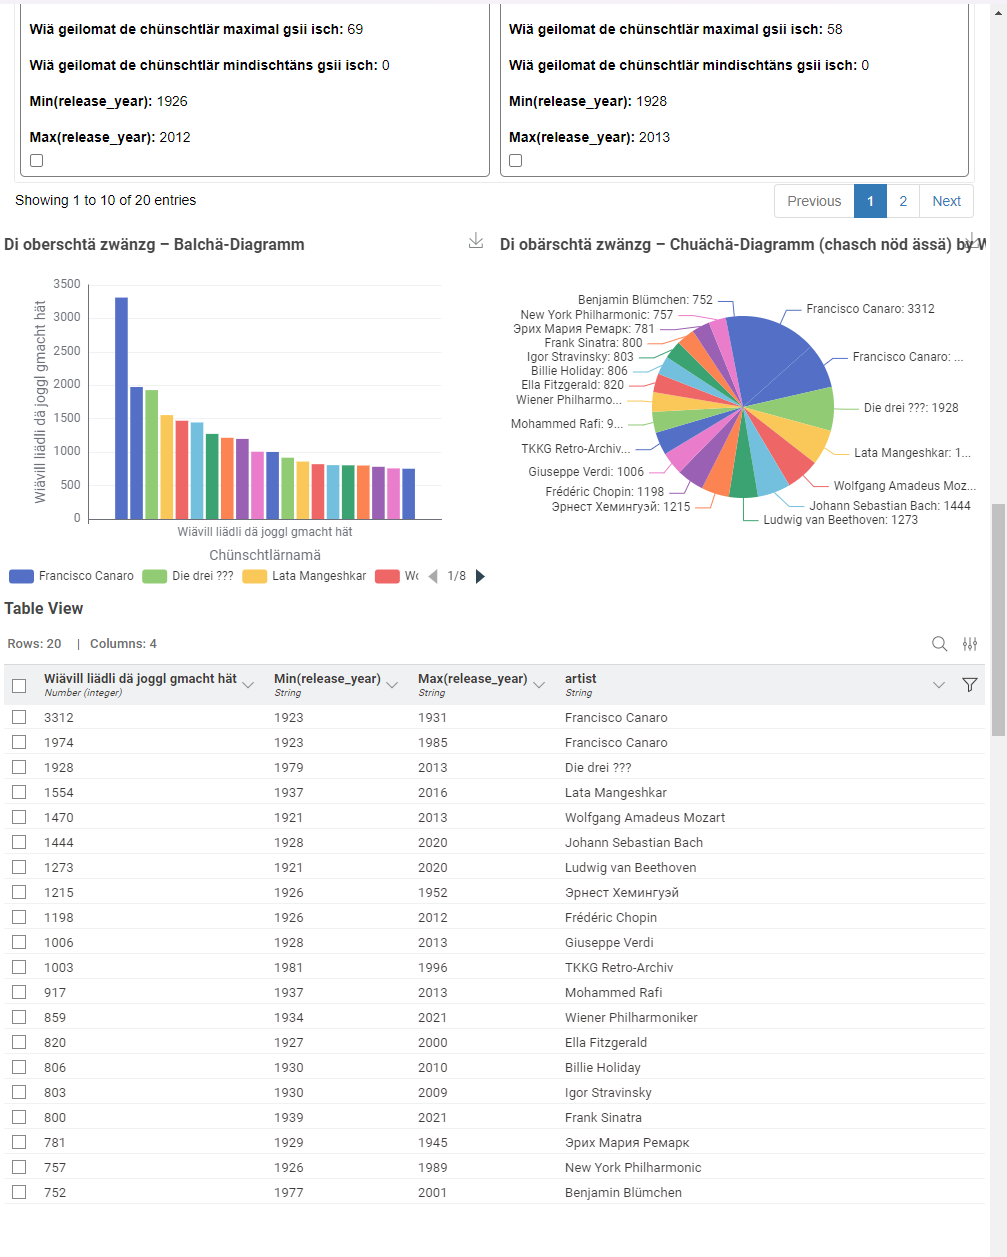
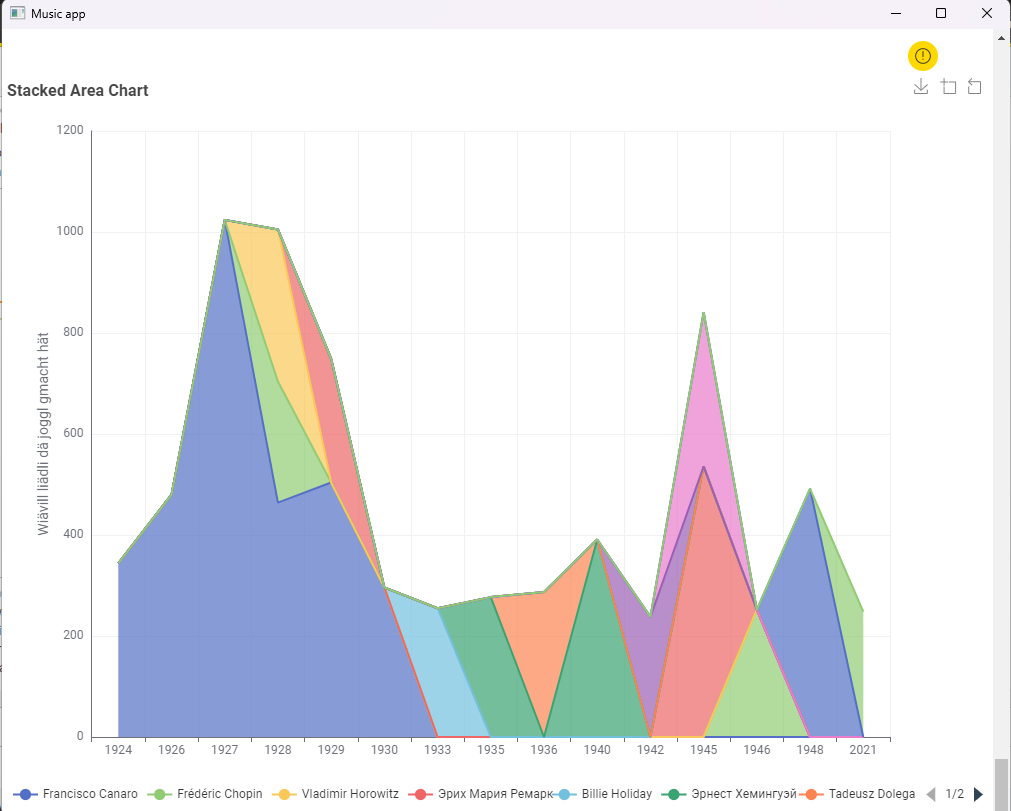
My UI is quite overloaded and anything else but elegant. I changed the layout a bit, but I am also sure, I should be able to make it better. Once again, I did not want to invest more time into this work. Here, some gruesome details.