Hi Everyone ![]()
Wow the last challenge! Thank you @alinebessa, KNIME and my fellow JustKNIMEIT participants… what an interesting 30 weeks we’ve had!
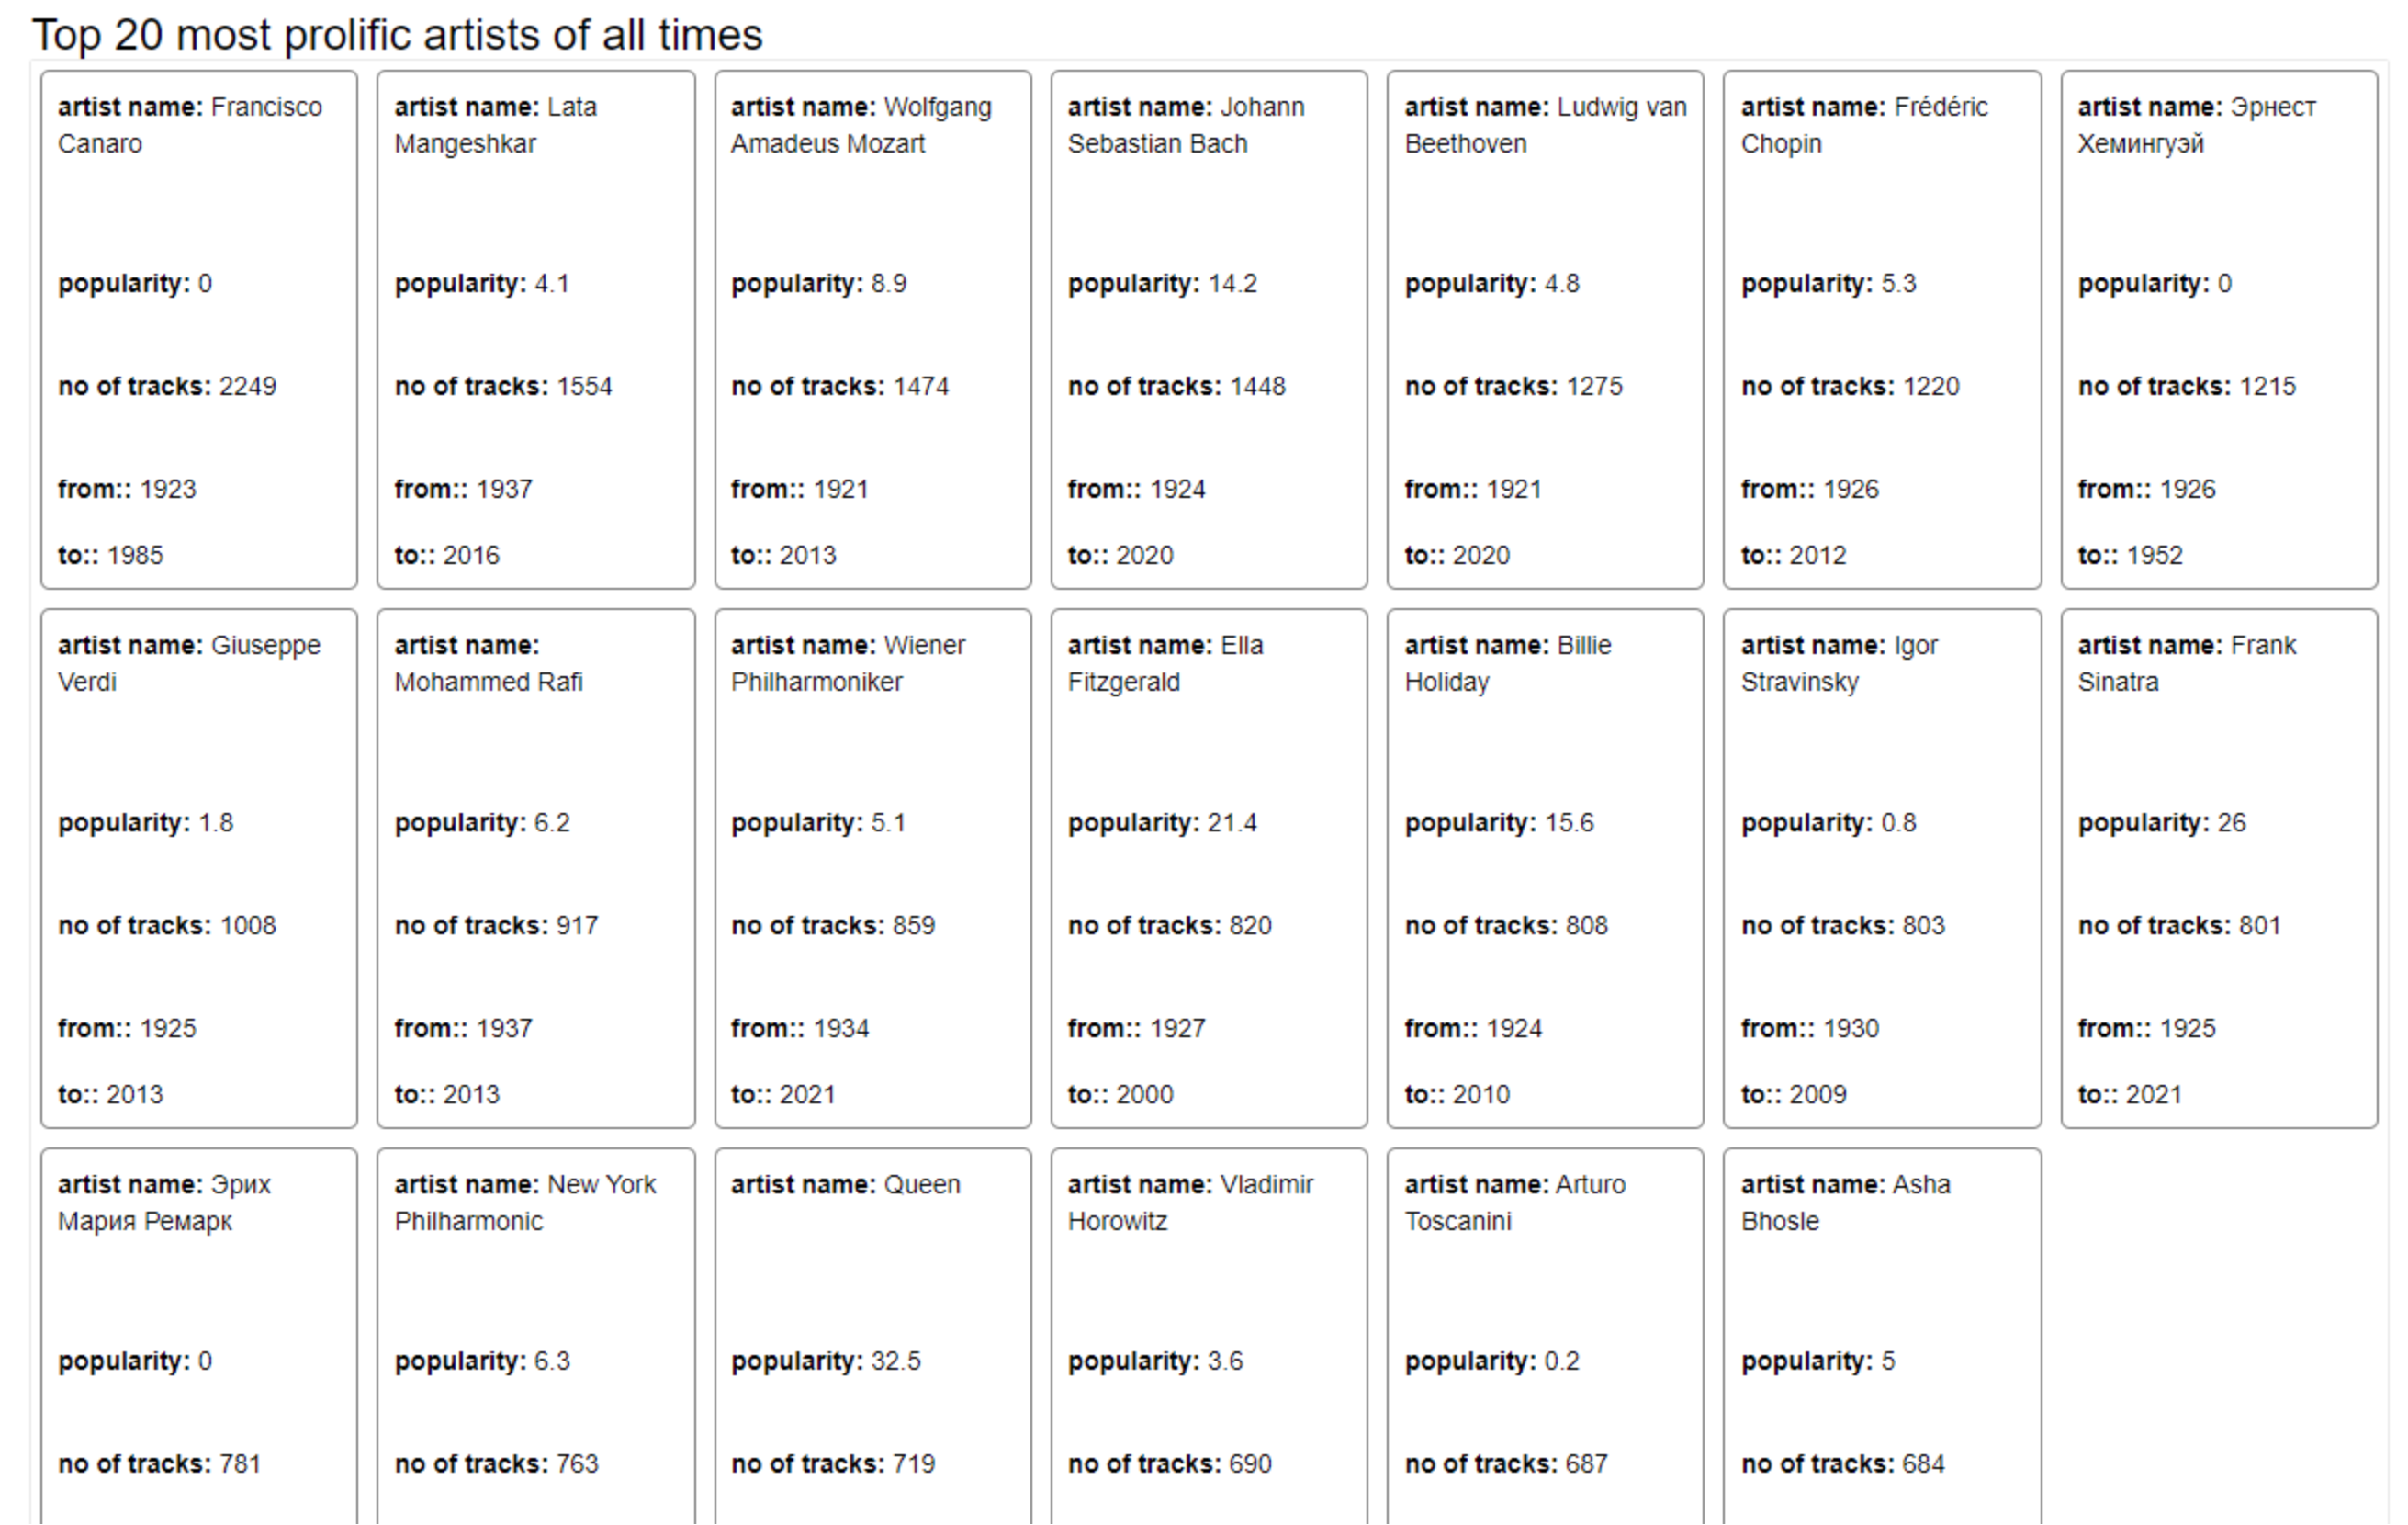
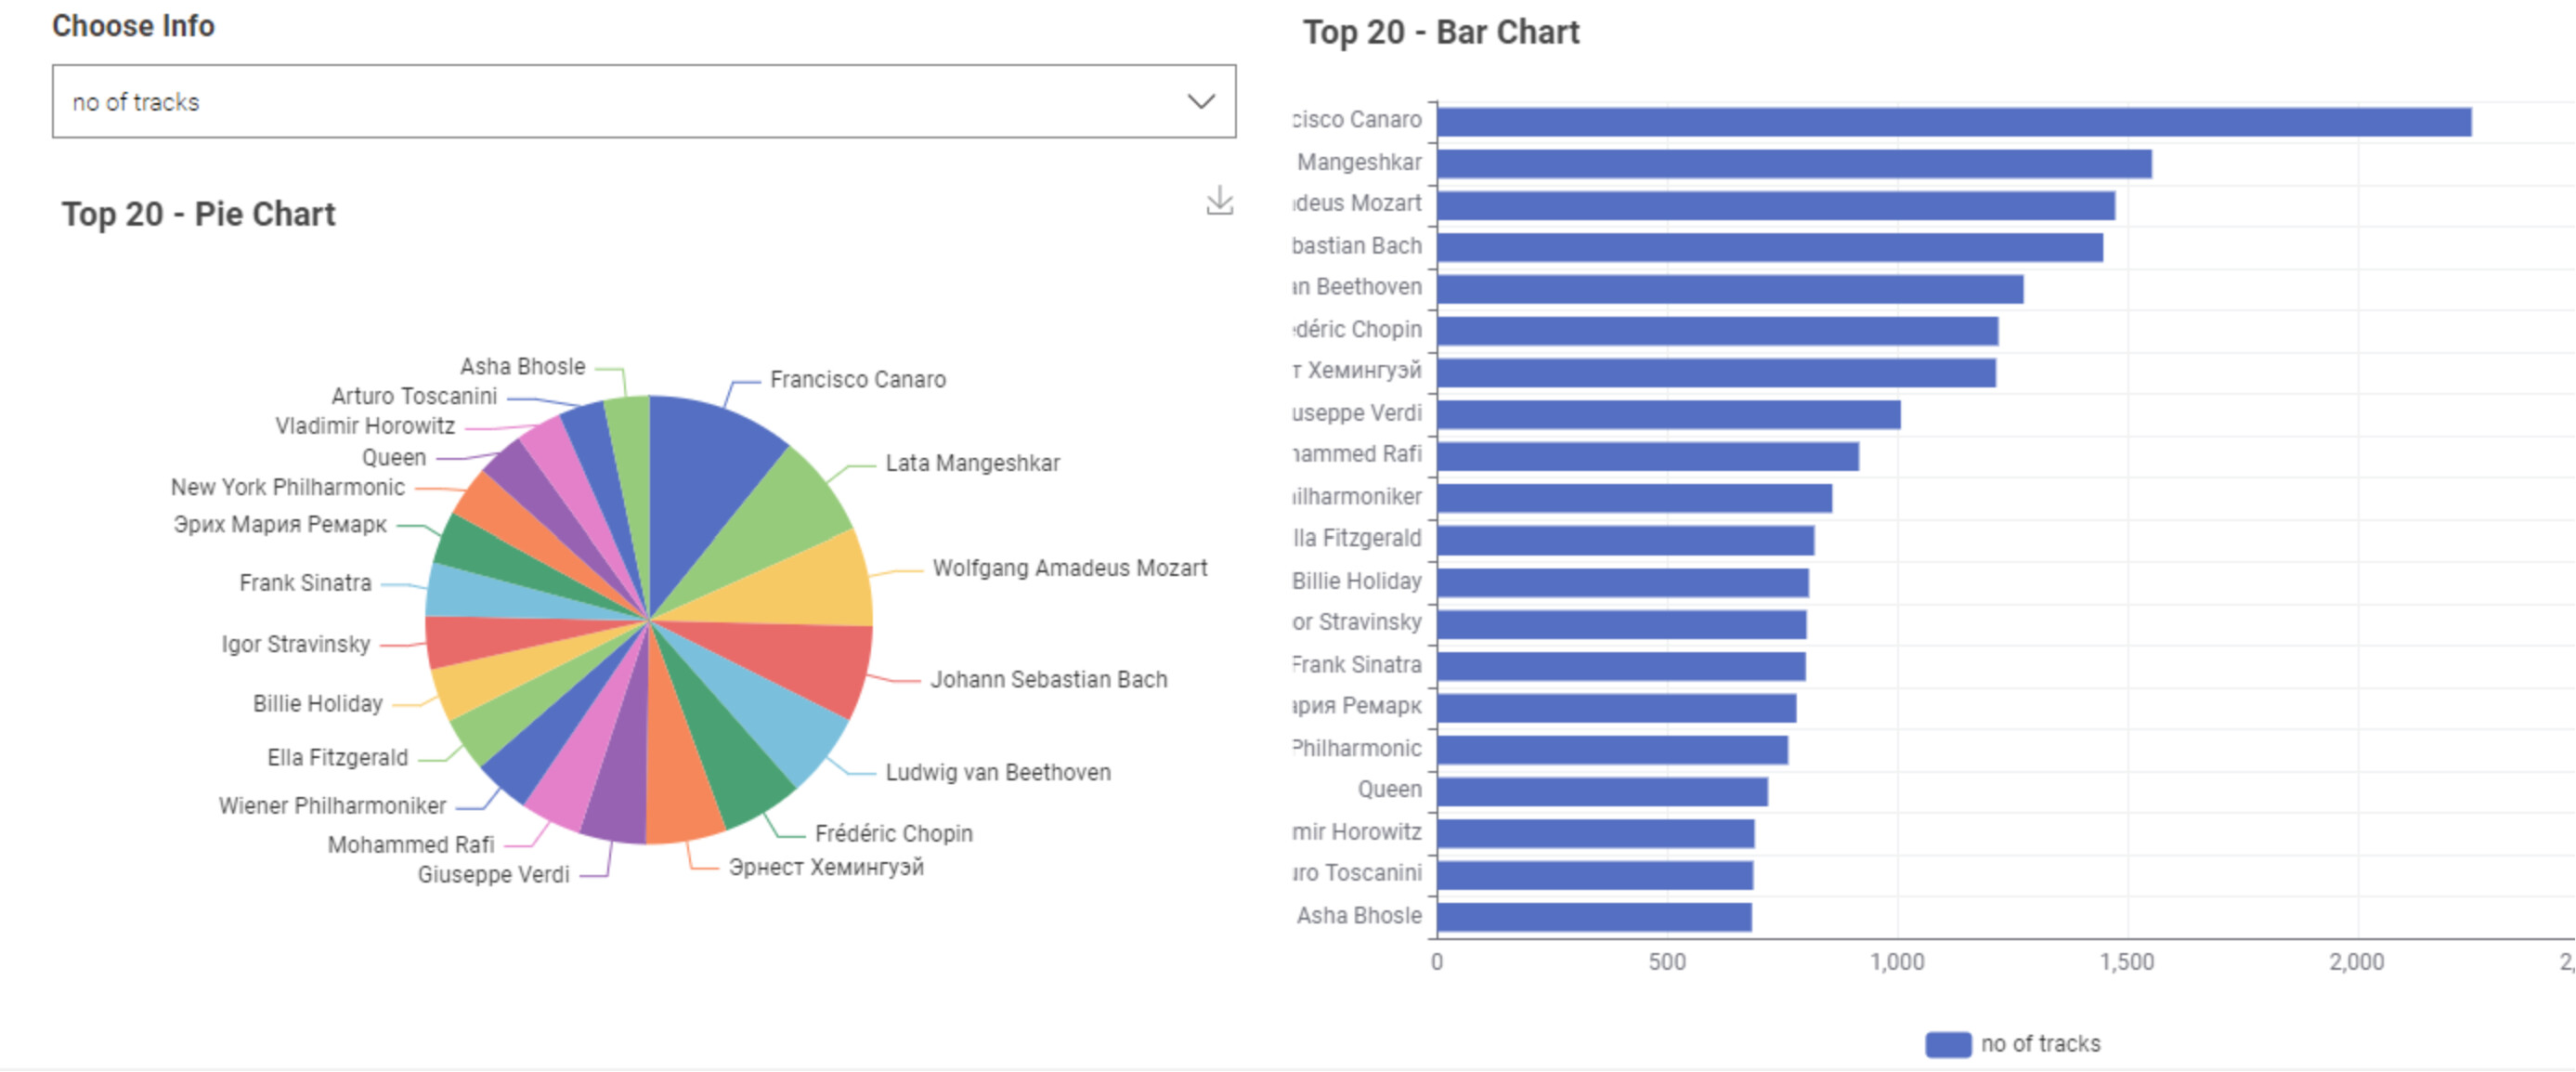
For the final challenge, I used the languages file as a hint to decide what info/charts to create. The user can select their language and then view information about the most prolific artists (most songs) using the Tile View, a bar chart and a pie chart.
I have a bit of an issue displaying the bar chart and pie chart when the language is in German, but I’m not sure why. Maybe the umlaut in the column name. I will keep investigating ![]()
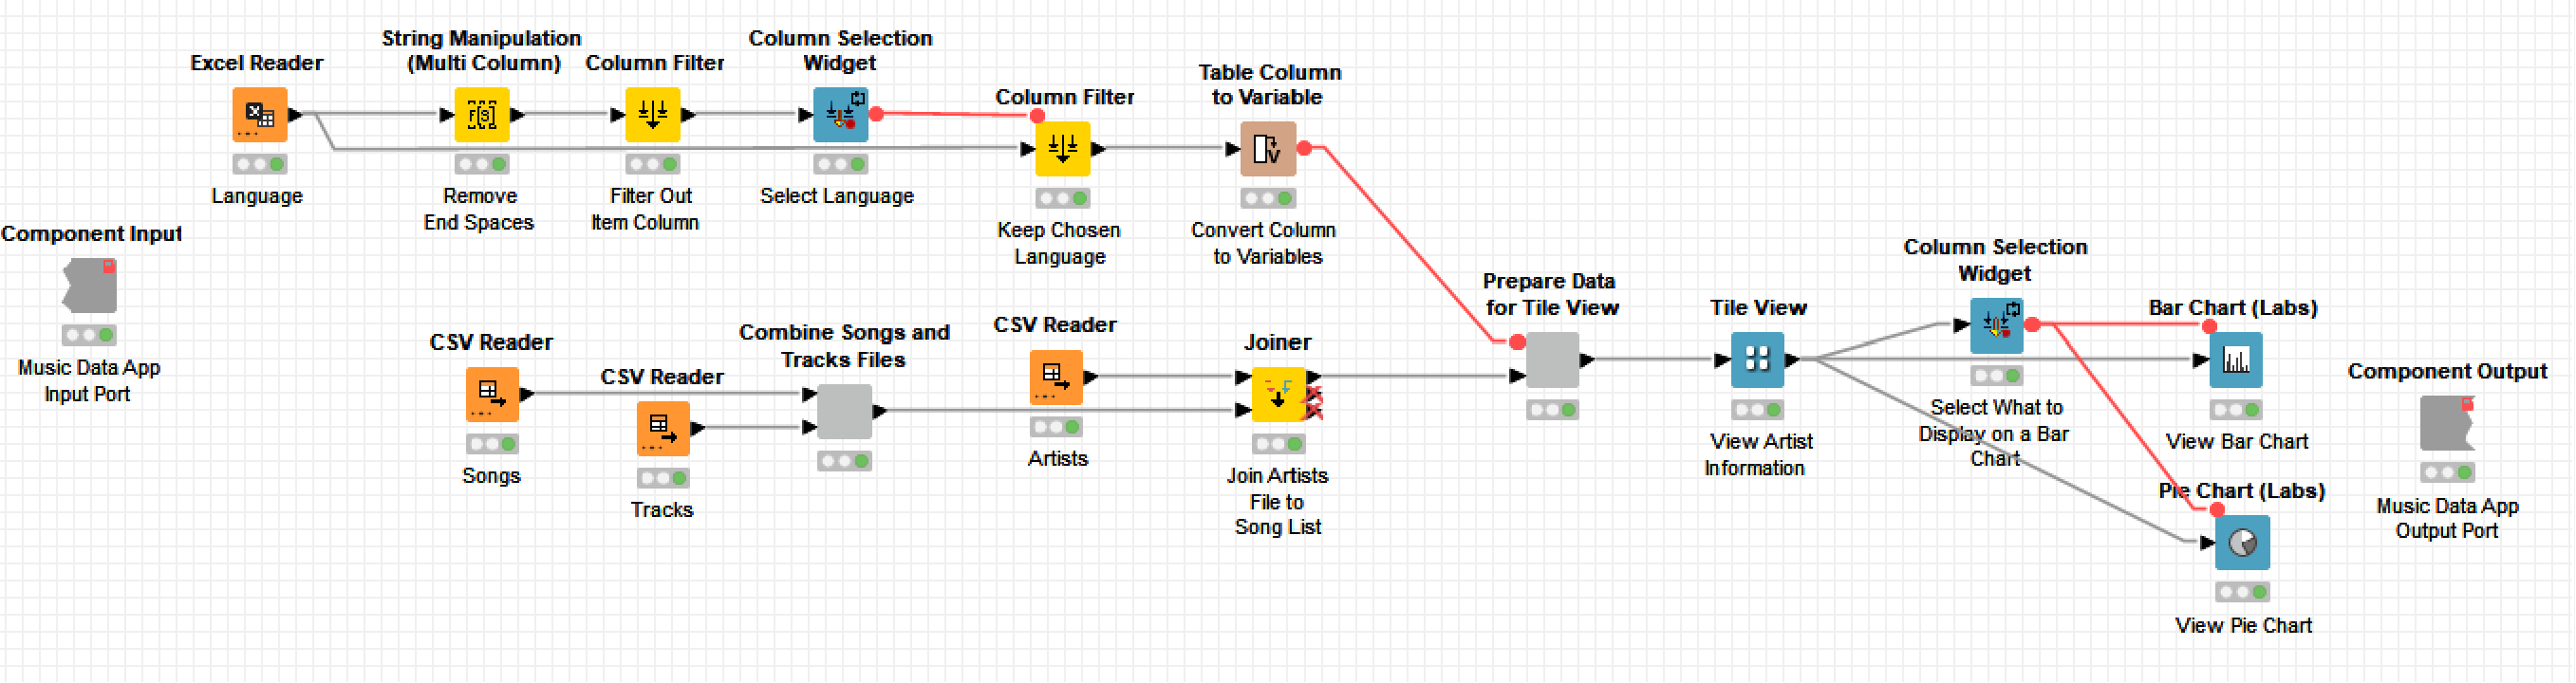
You can find my workflow on the hub here:
Thanks again
Heather