Solutions to “Just KNIME It!” Challenge 30

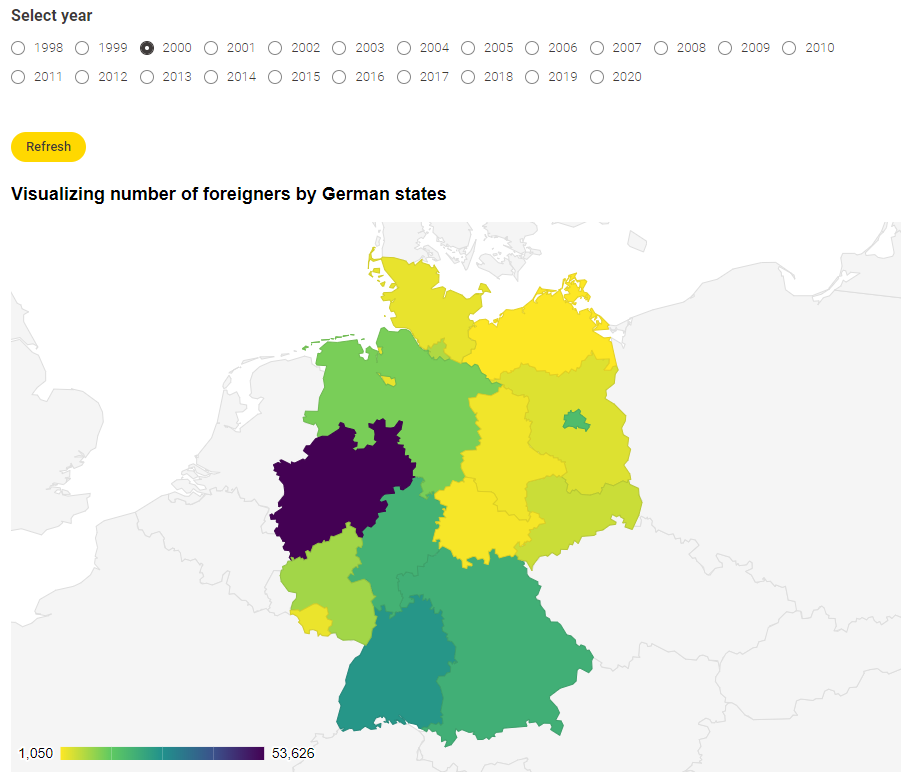
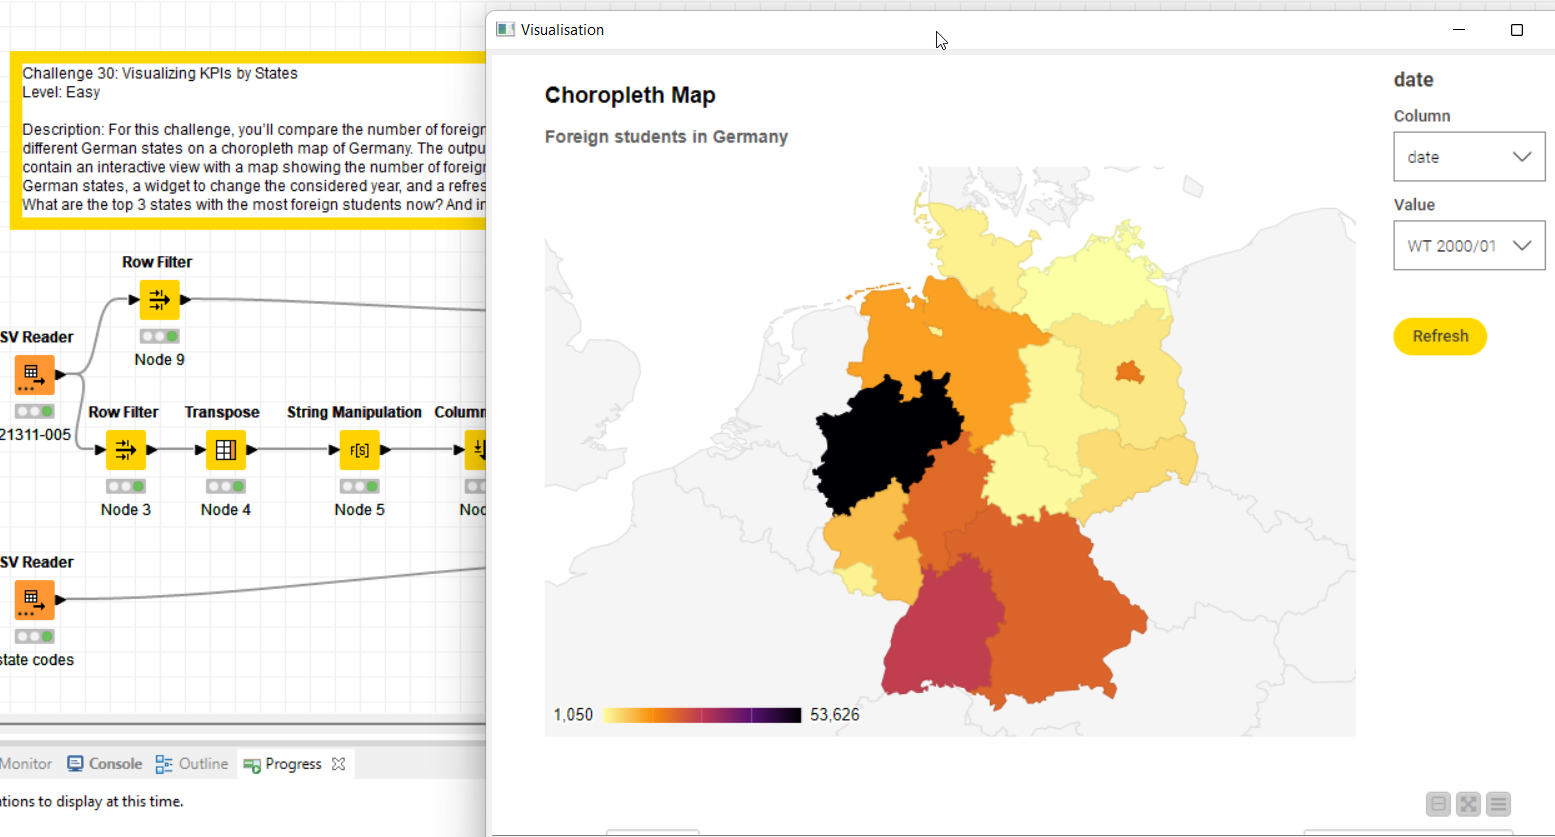
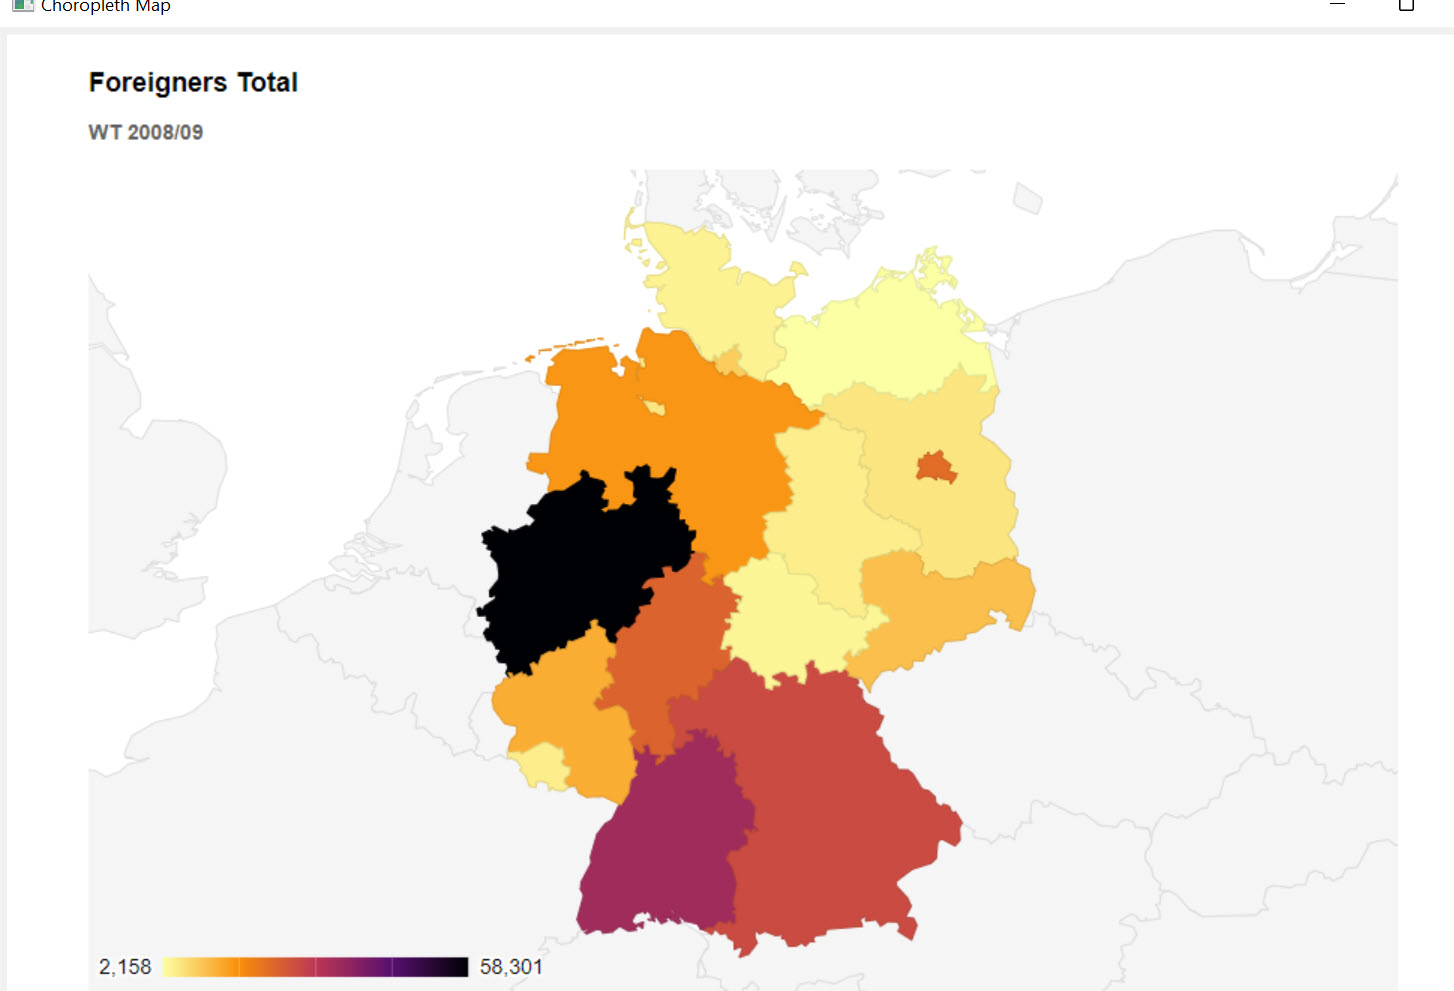
This thread is for posting solutions to “Just KNIME It!” Challenge 30. This week we will compare the number of foreign students in different German states over the years :apple: :woman_student: :man_student:

Here is the challenge: Just KNIME It!

Feel free to link your solution from KNIME Hub as well!

And as always, if you have an idea for a challenge we’d love to hear it! :heart_eyes: Tell us all about it here.

Hello everyone,

here is my solution:

I decided to show states in both absolute and relative numbers.

Have a nice day,
RB

4 Likes

Here is my solution for Challenge 30

image

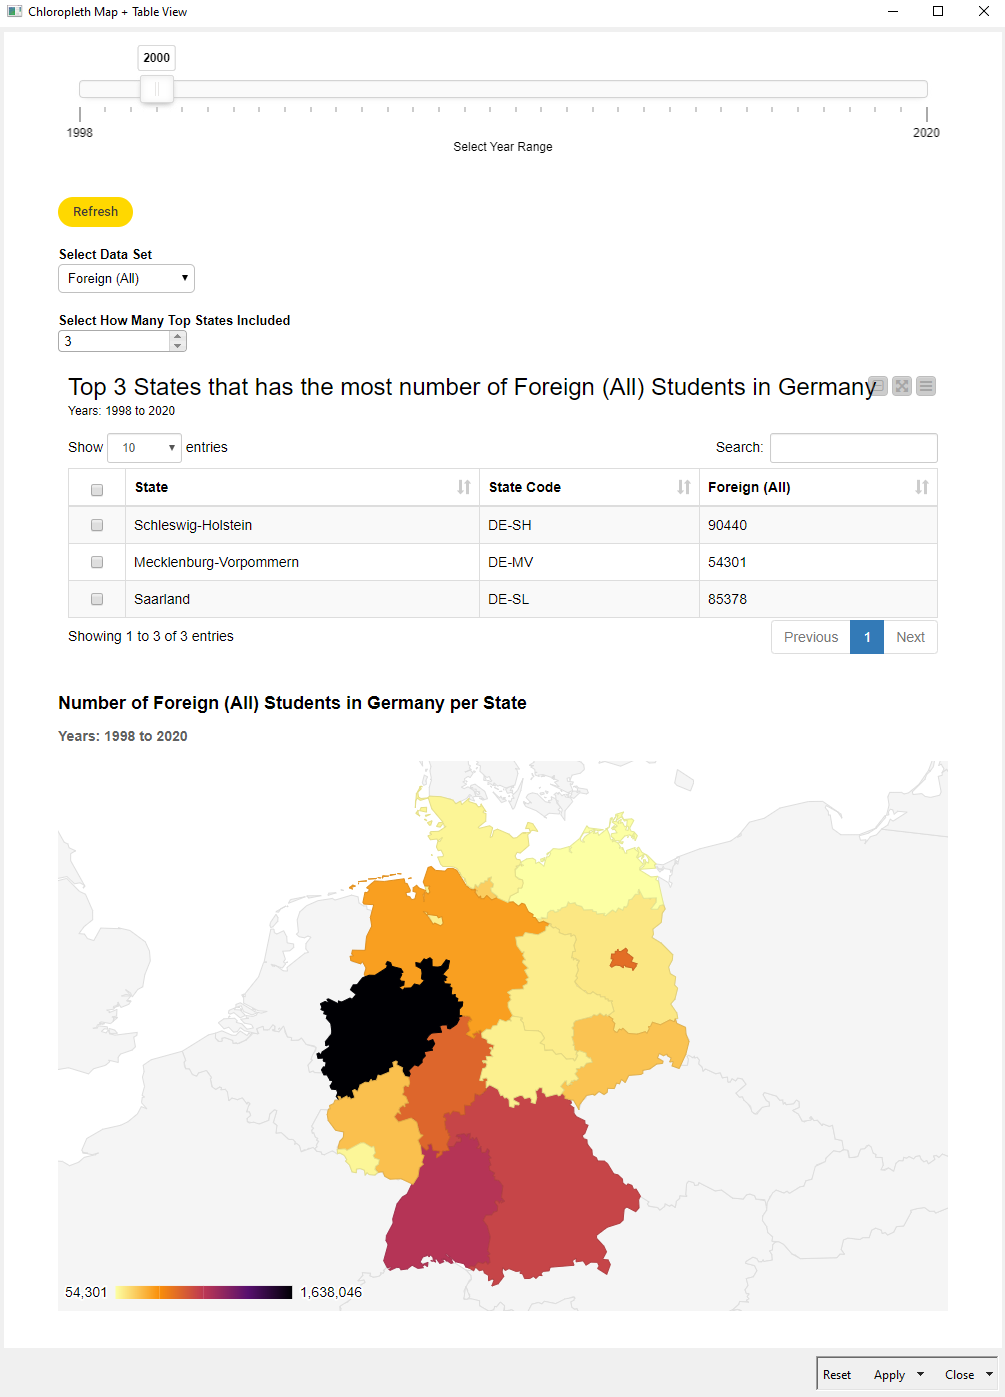
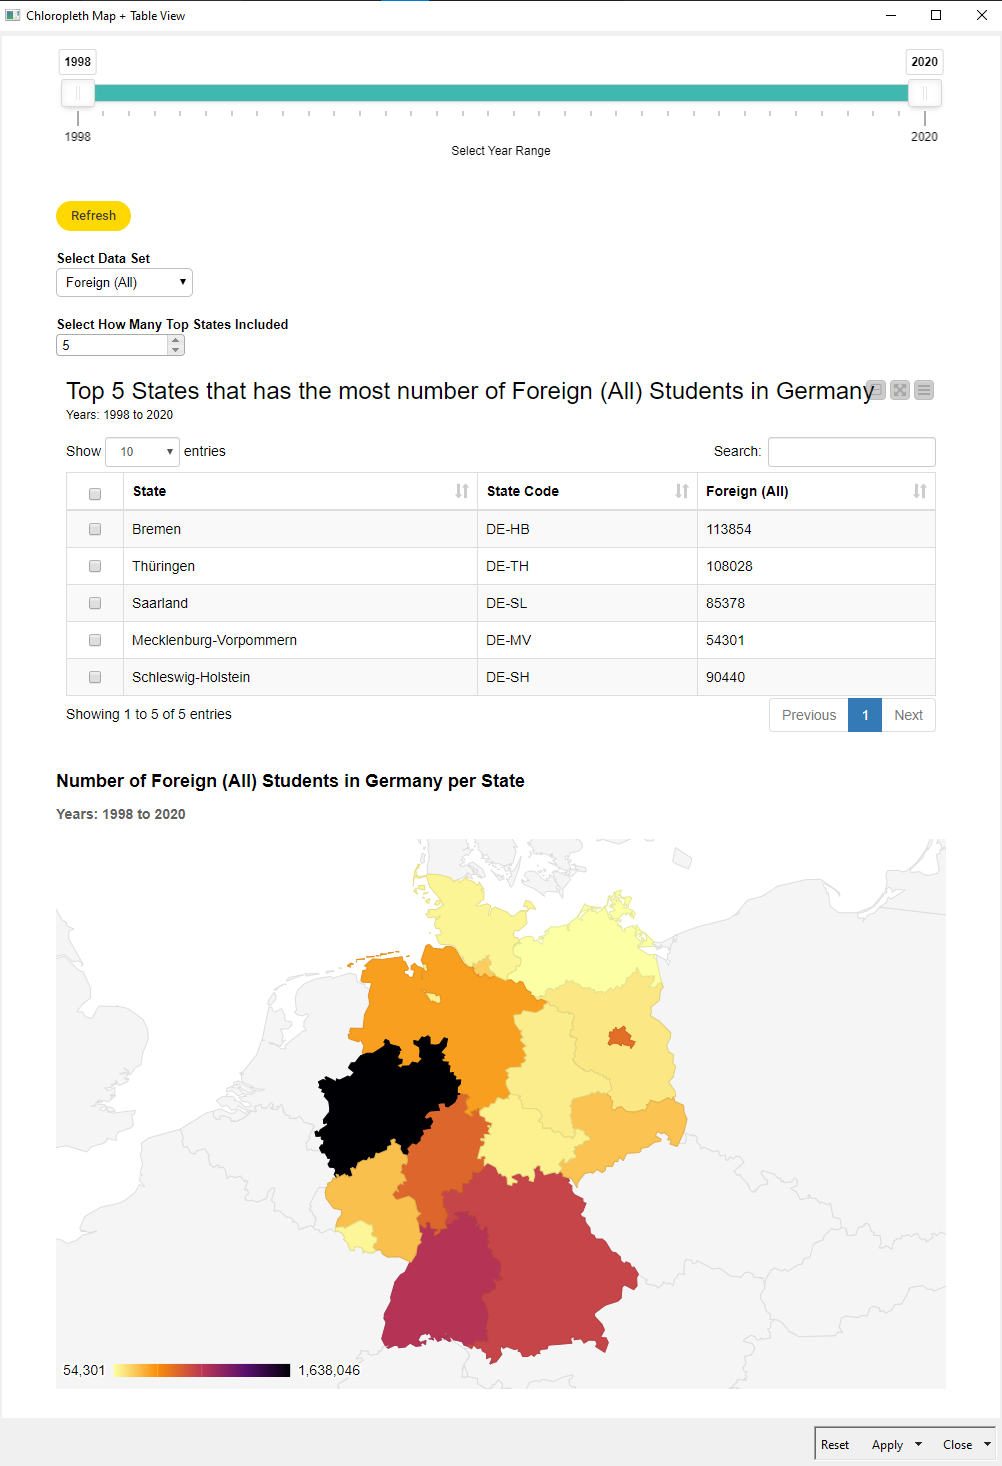
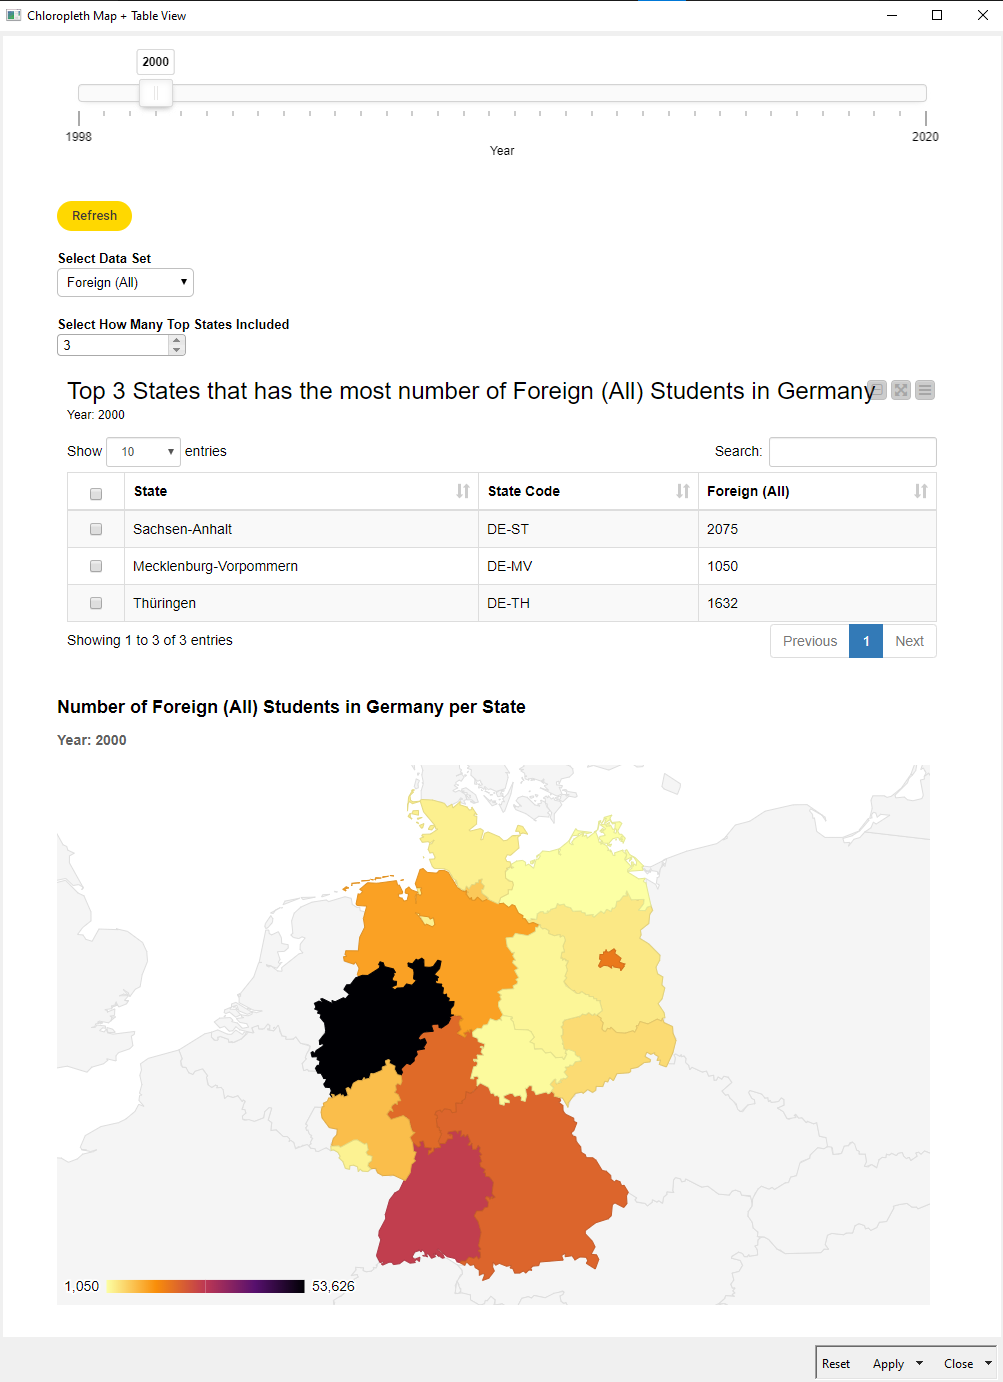
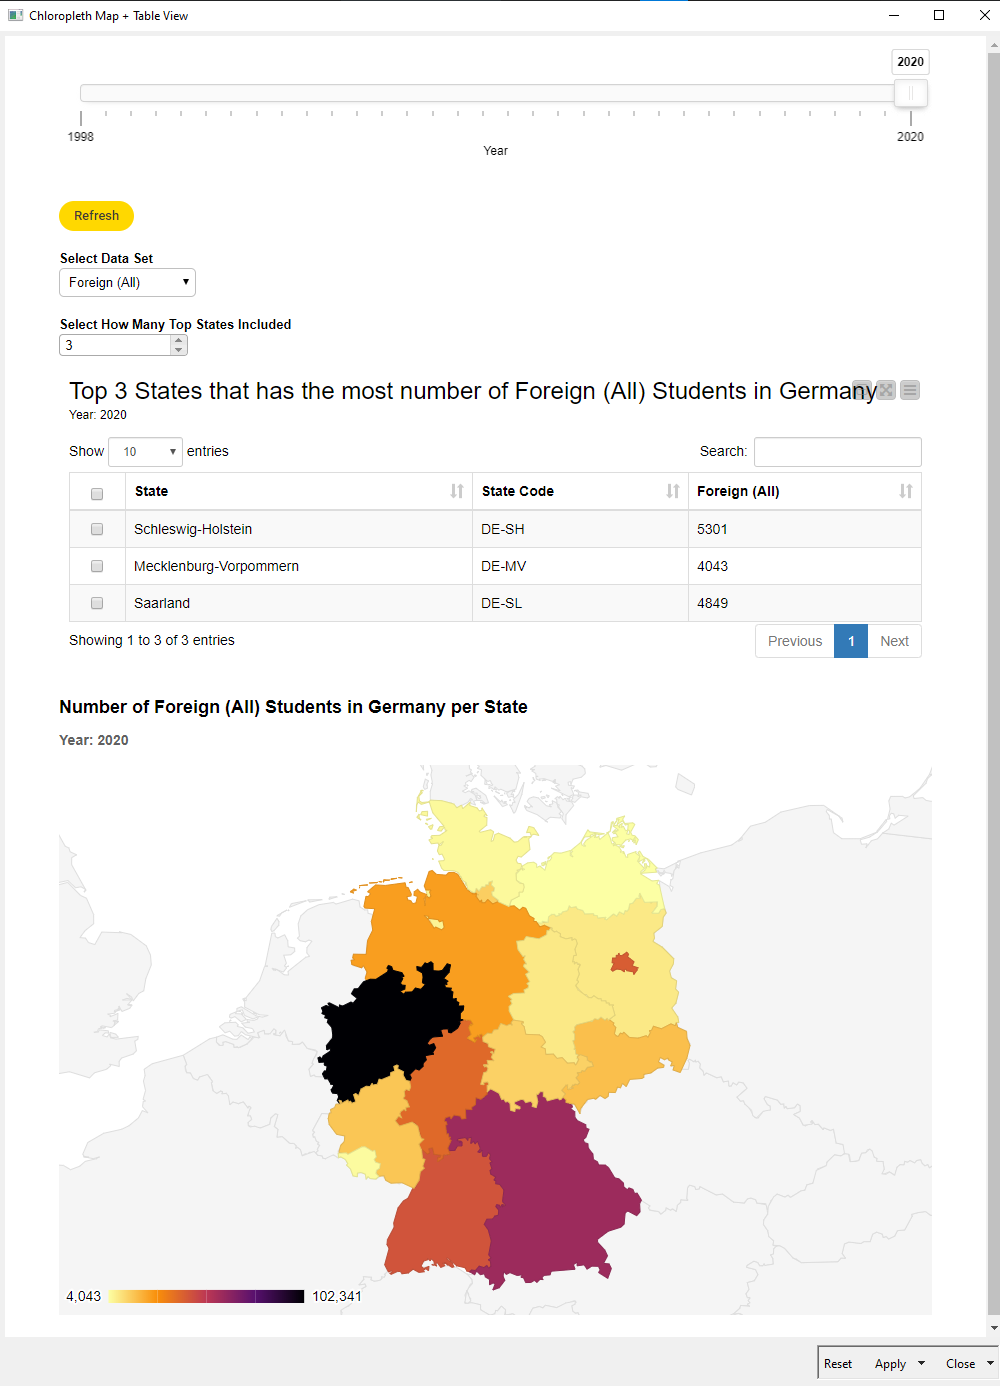
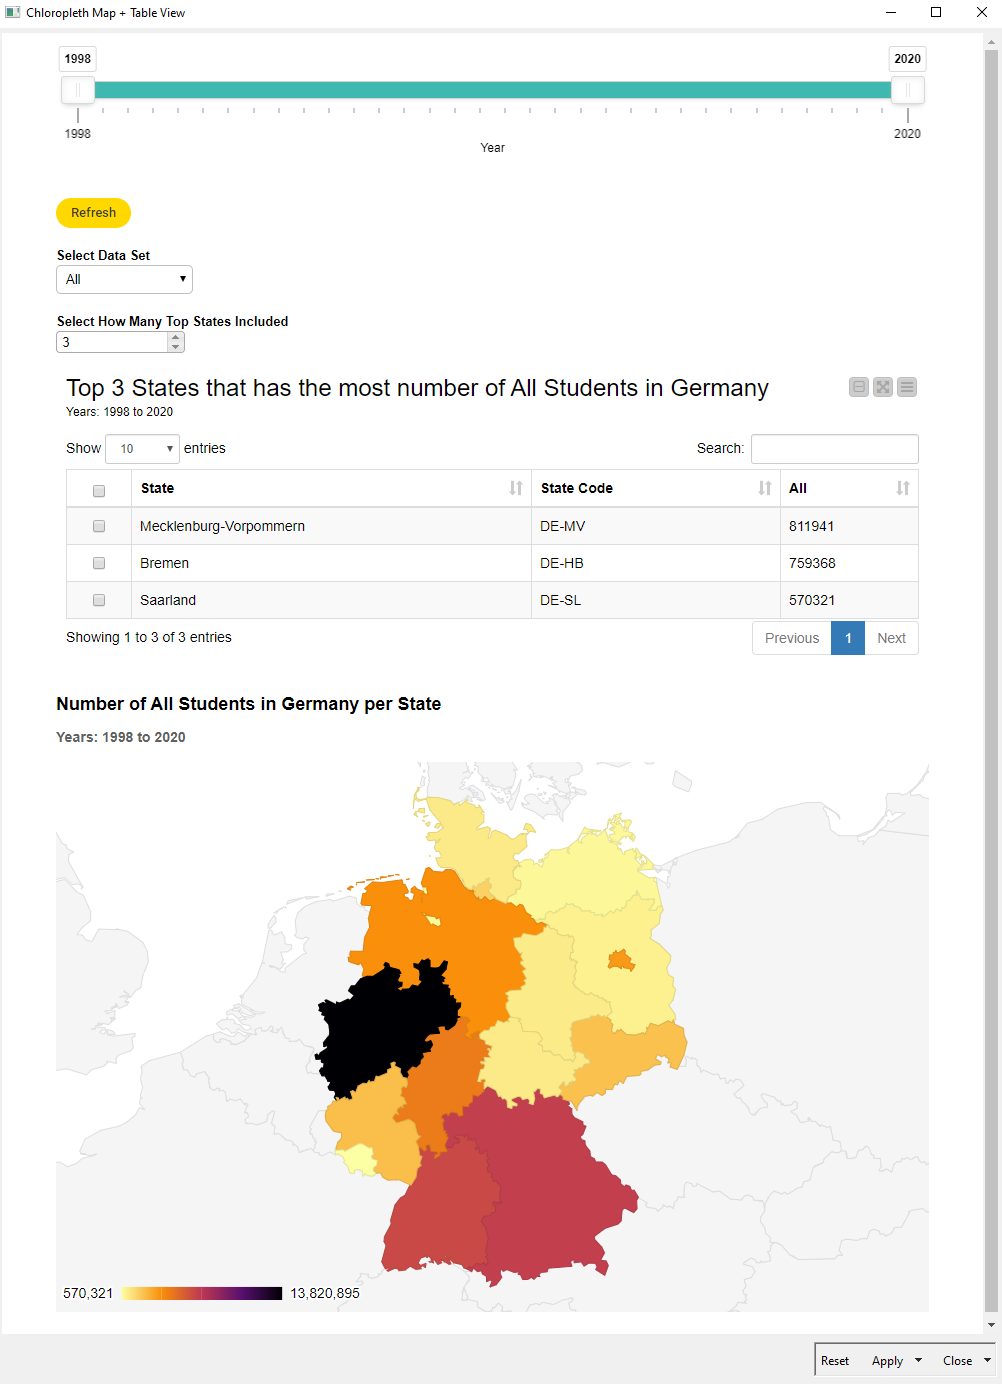
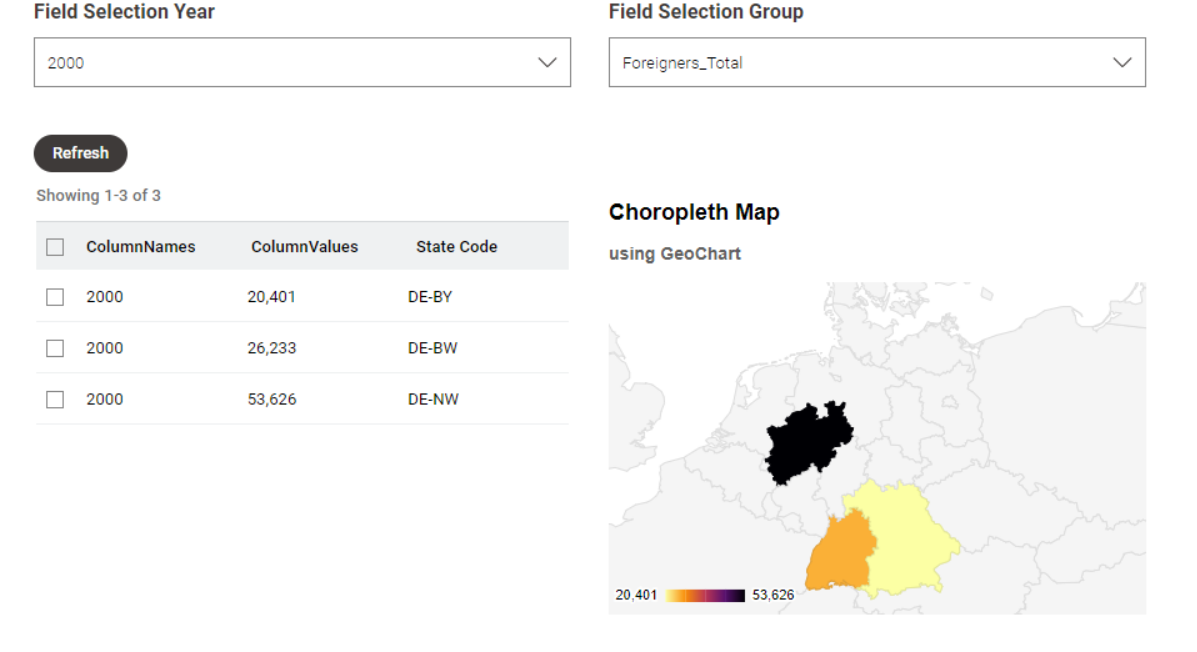
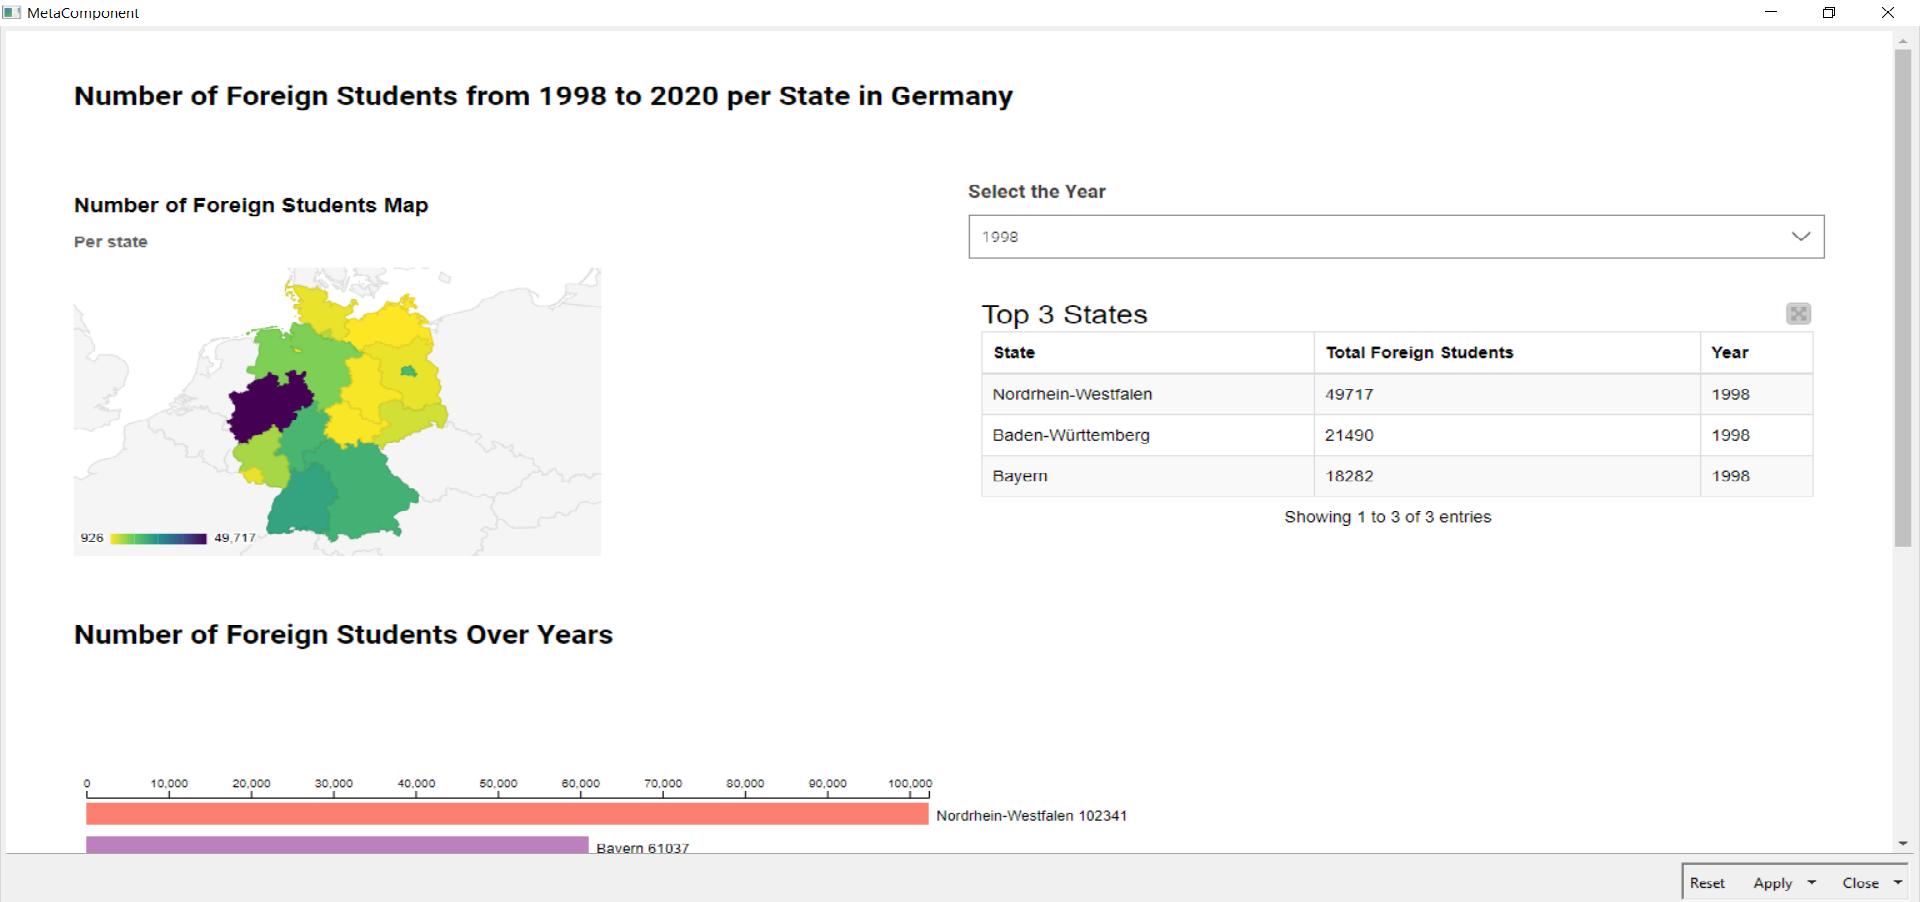
I’ve used the range filter so it can select the year range of the data not just individually, added the column selection so the result is not limited to values coming from foreigner column, added an integer input for the top k selector node so it’s not limited to top 3 states, and made the Titles dynamic based on the year/range of the year and which data column is selected

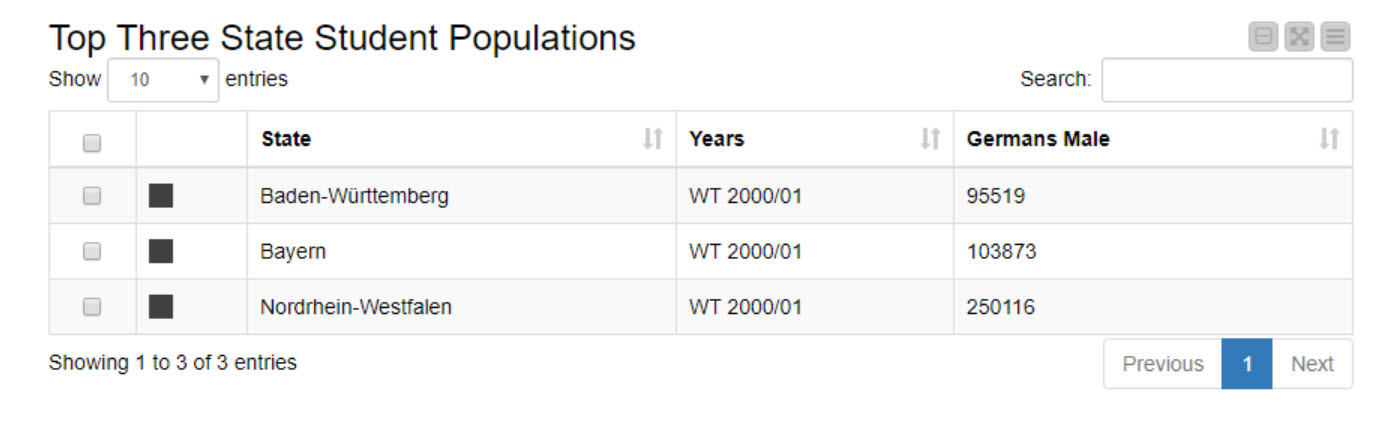
Top 3 States with most Foreign Students (Year 2000)

Top 3 States with most Foreign Students (Year 2020)

Top 5 States with most Foreign Students (Year 1998-2020)

3 Likes

Here is my solution. (Oops… Revised, as it was missing some states…)

3 Likes

Updated, forgot to add Filter Apply Node

2000

2020

All

3 Likes

Dear all,

Here is my attempt for this week’s challenge: justknimeit30 - Visualizing KPIs by States – KNIME Hub

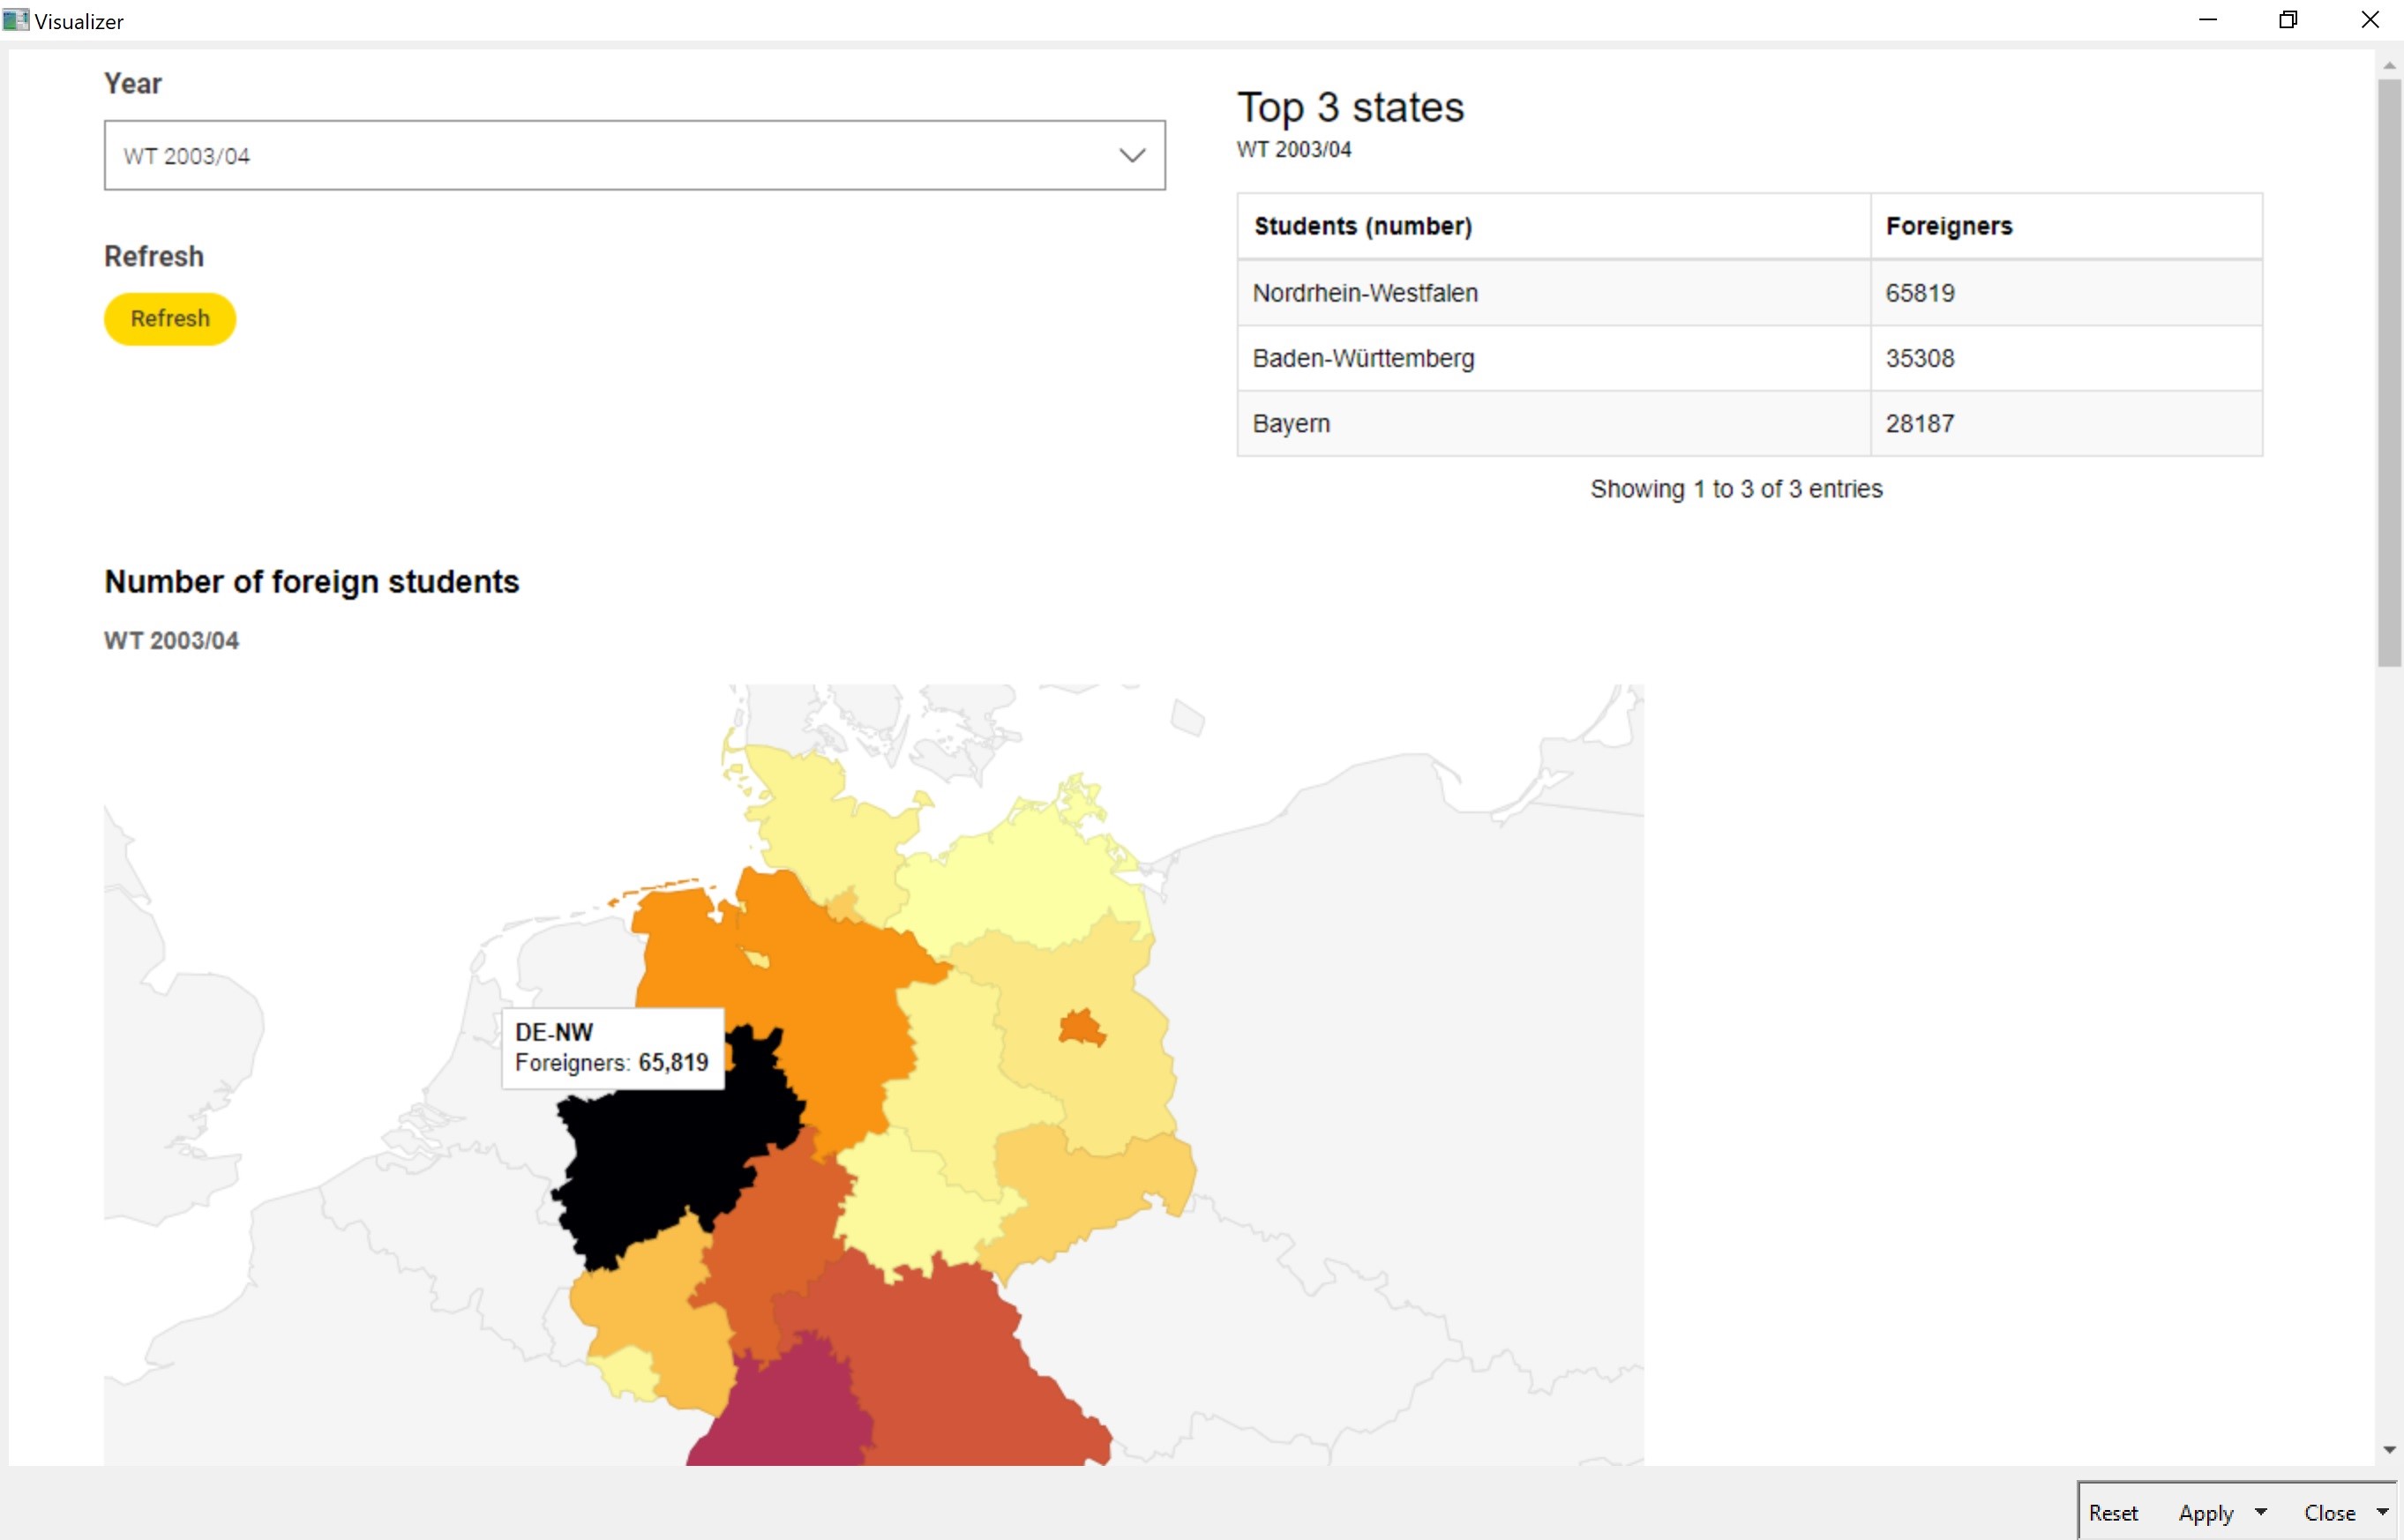
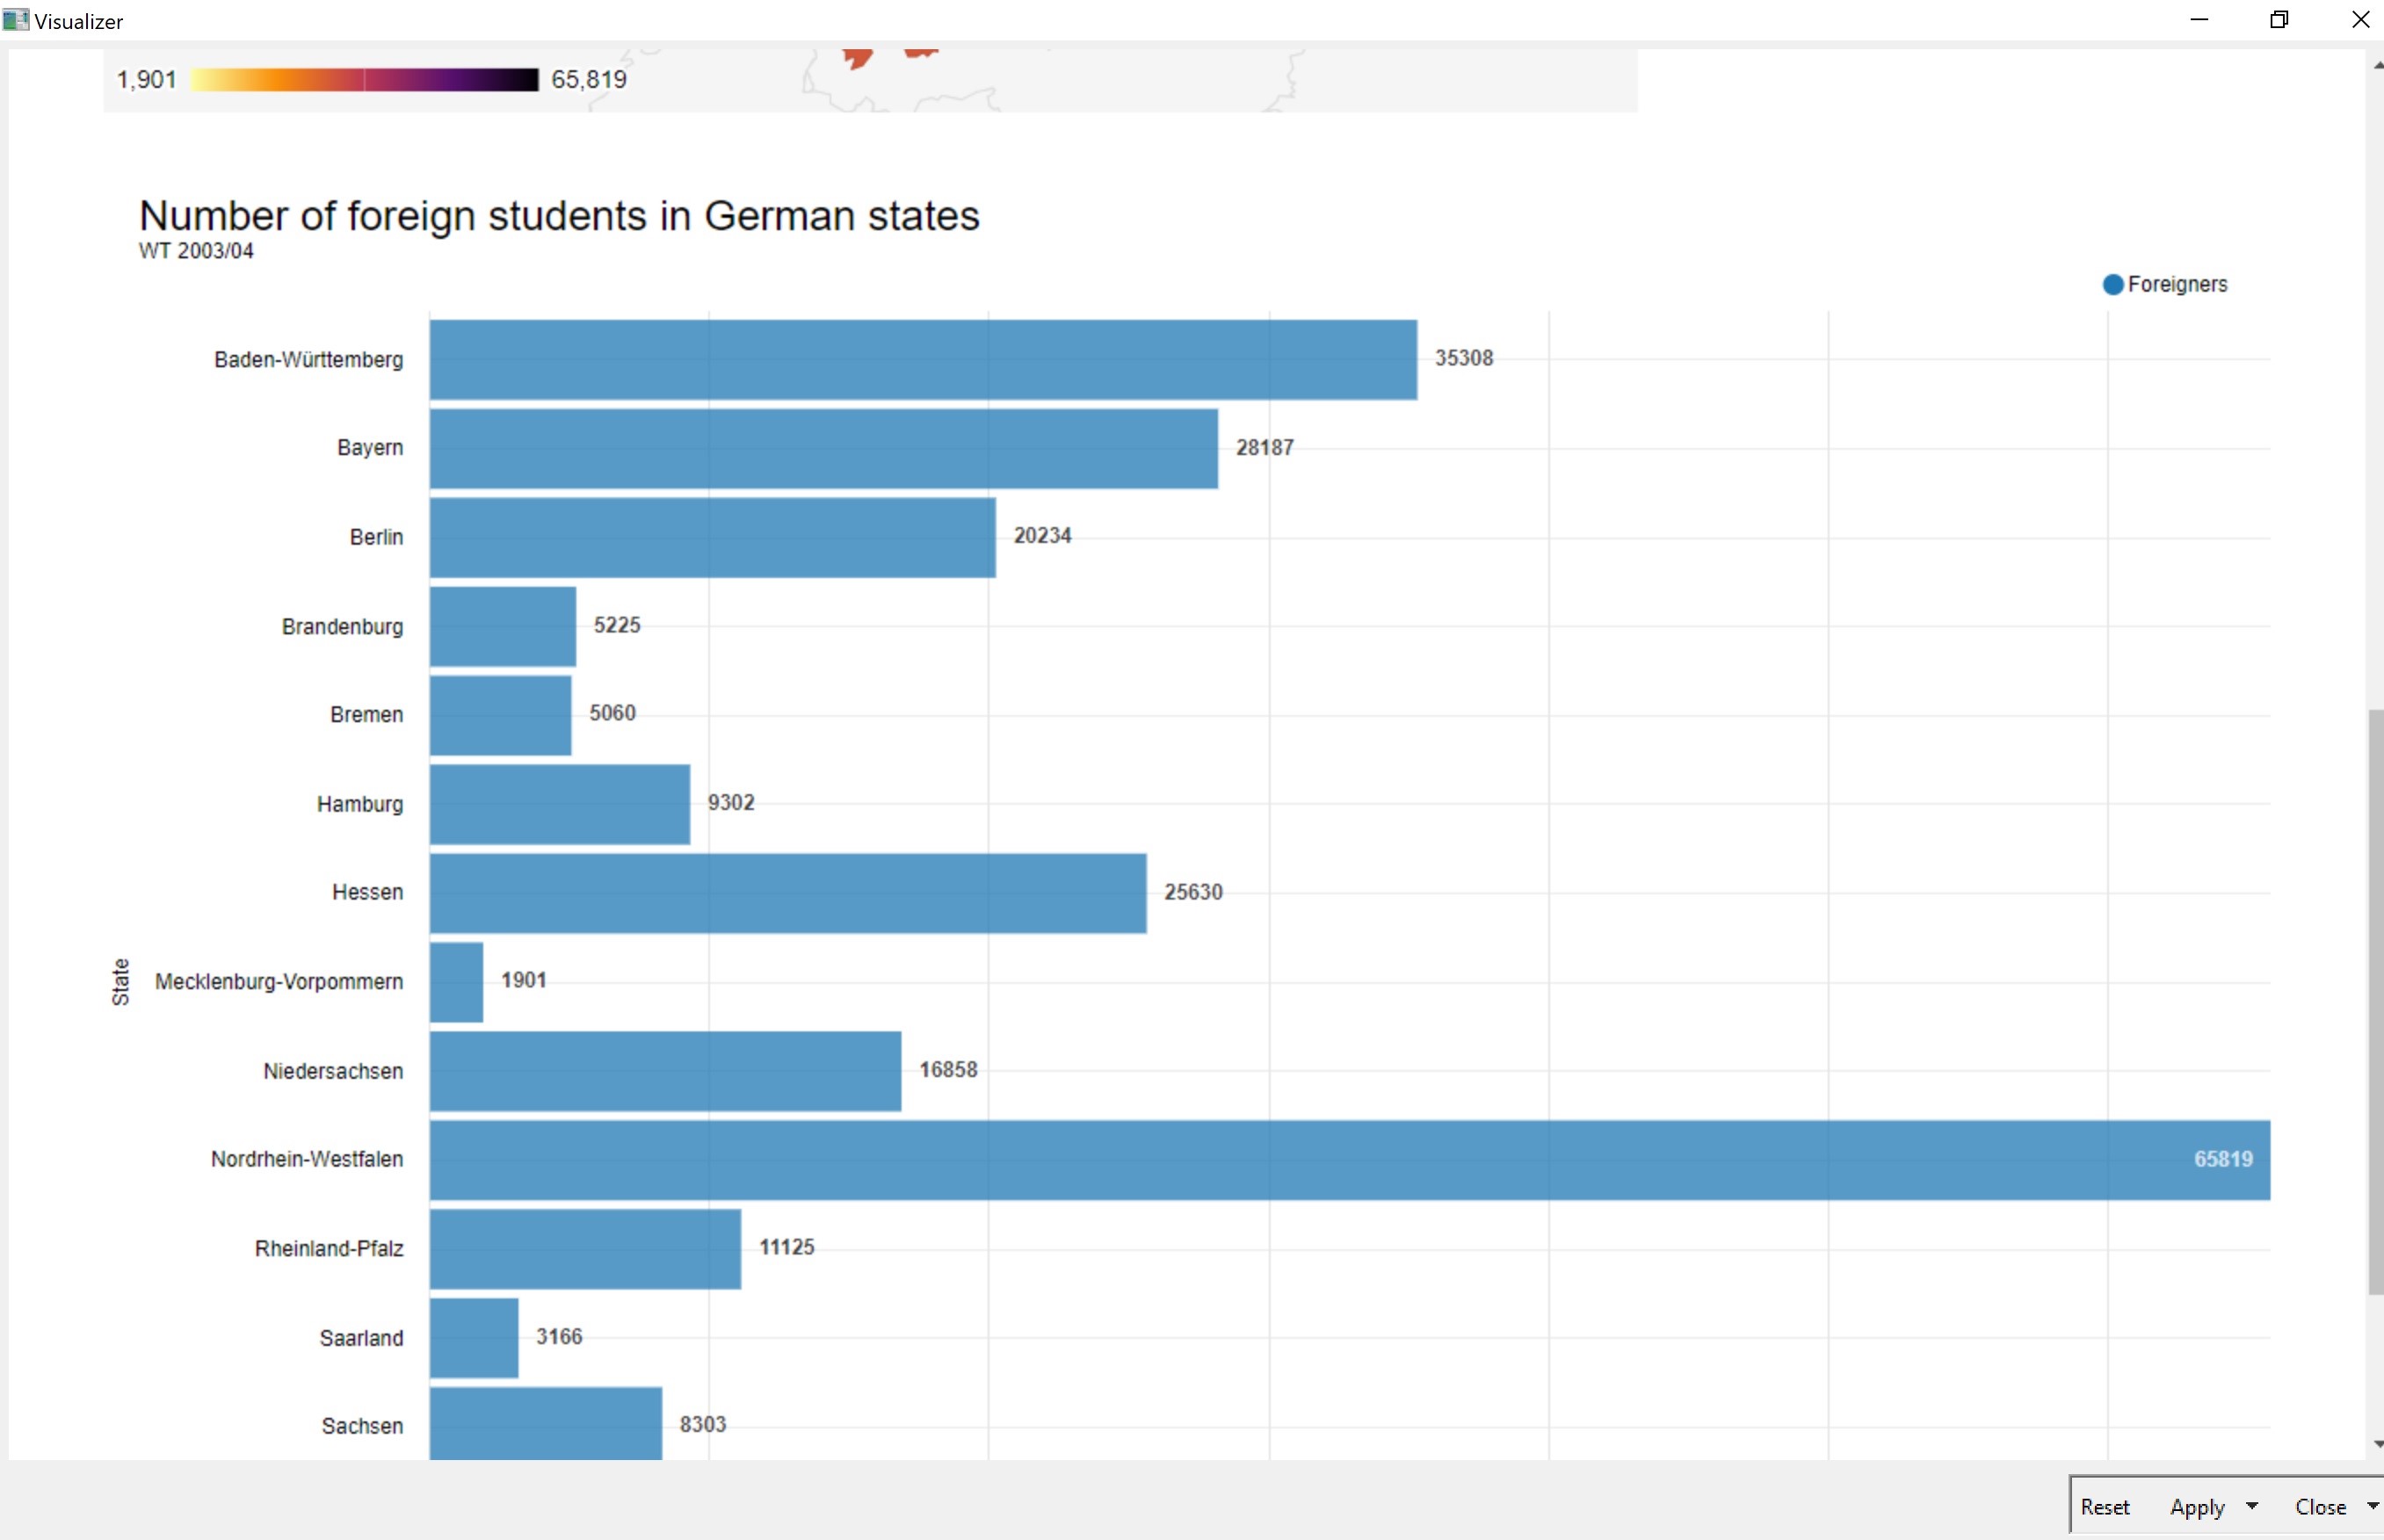
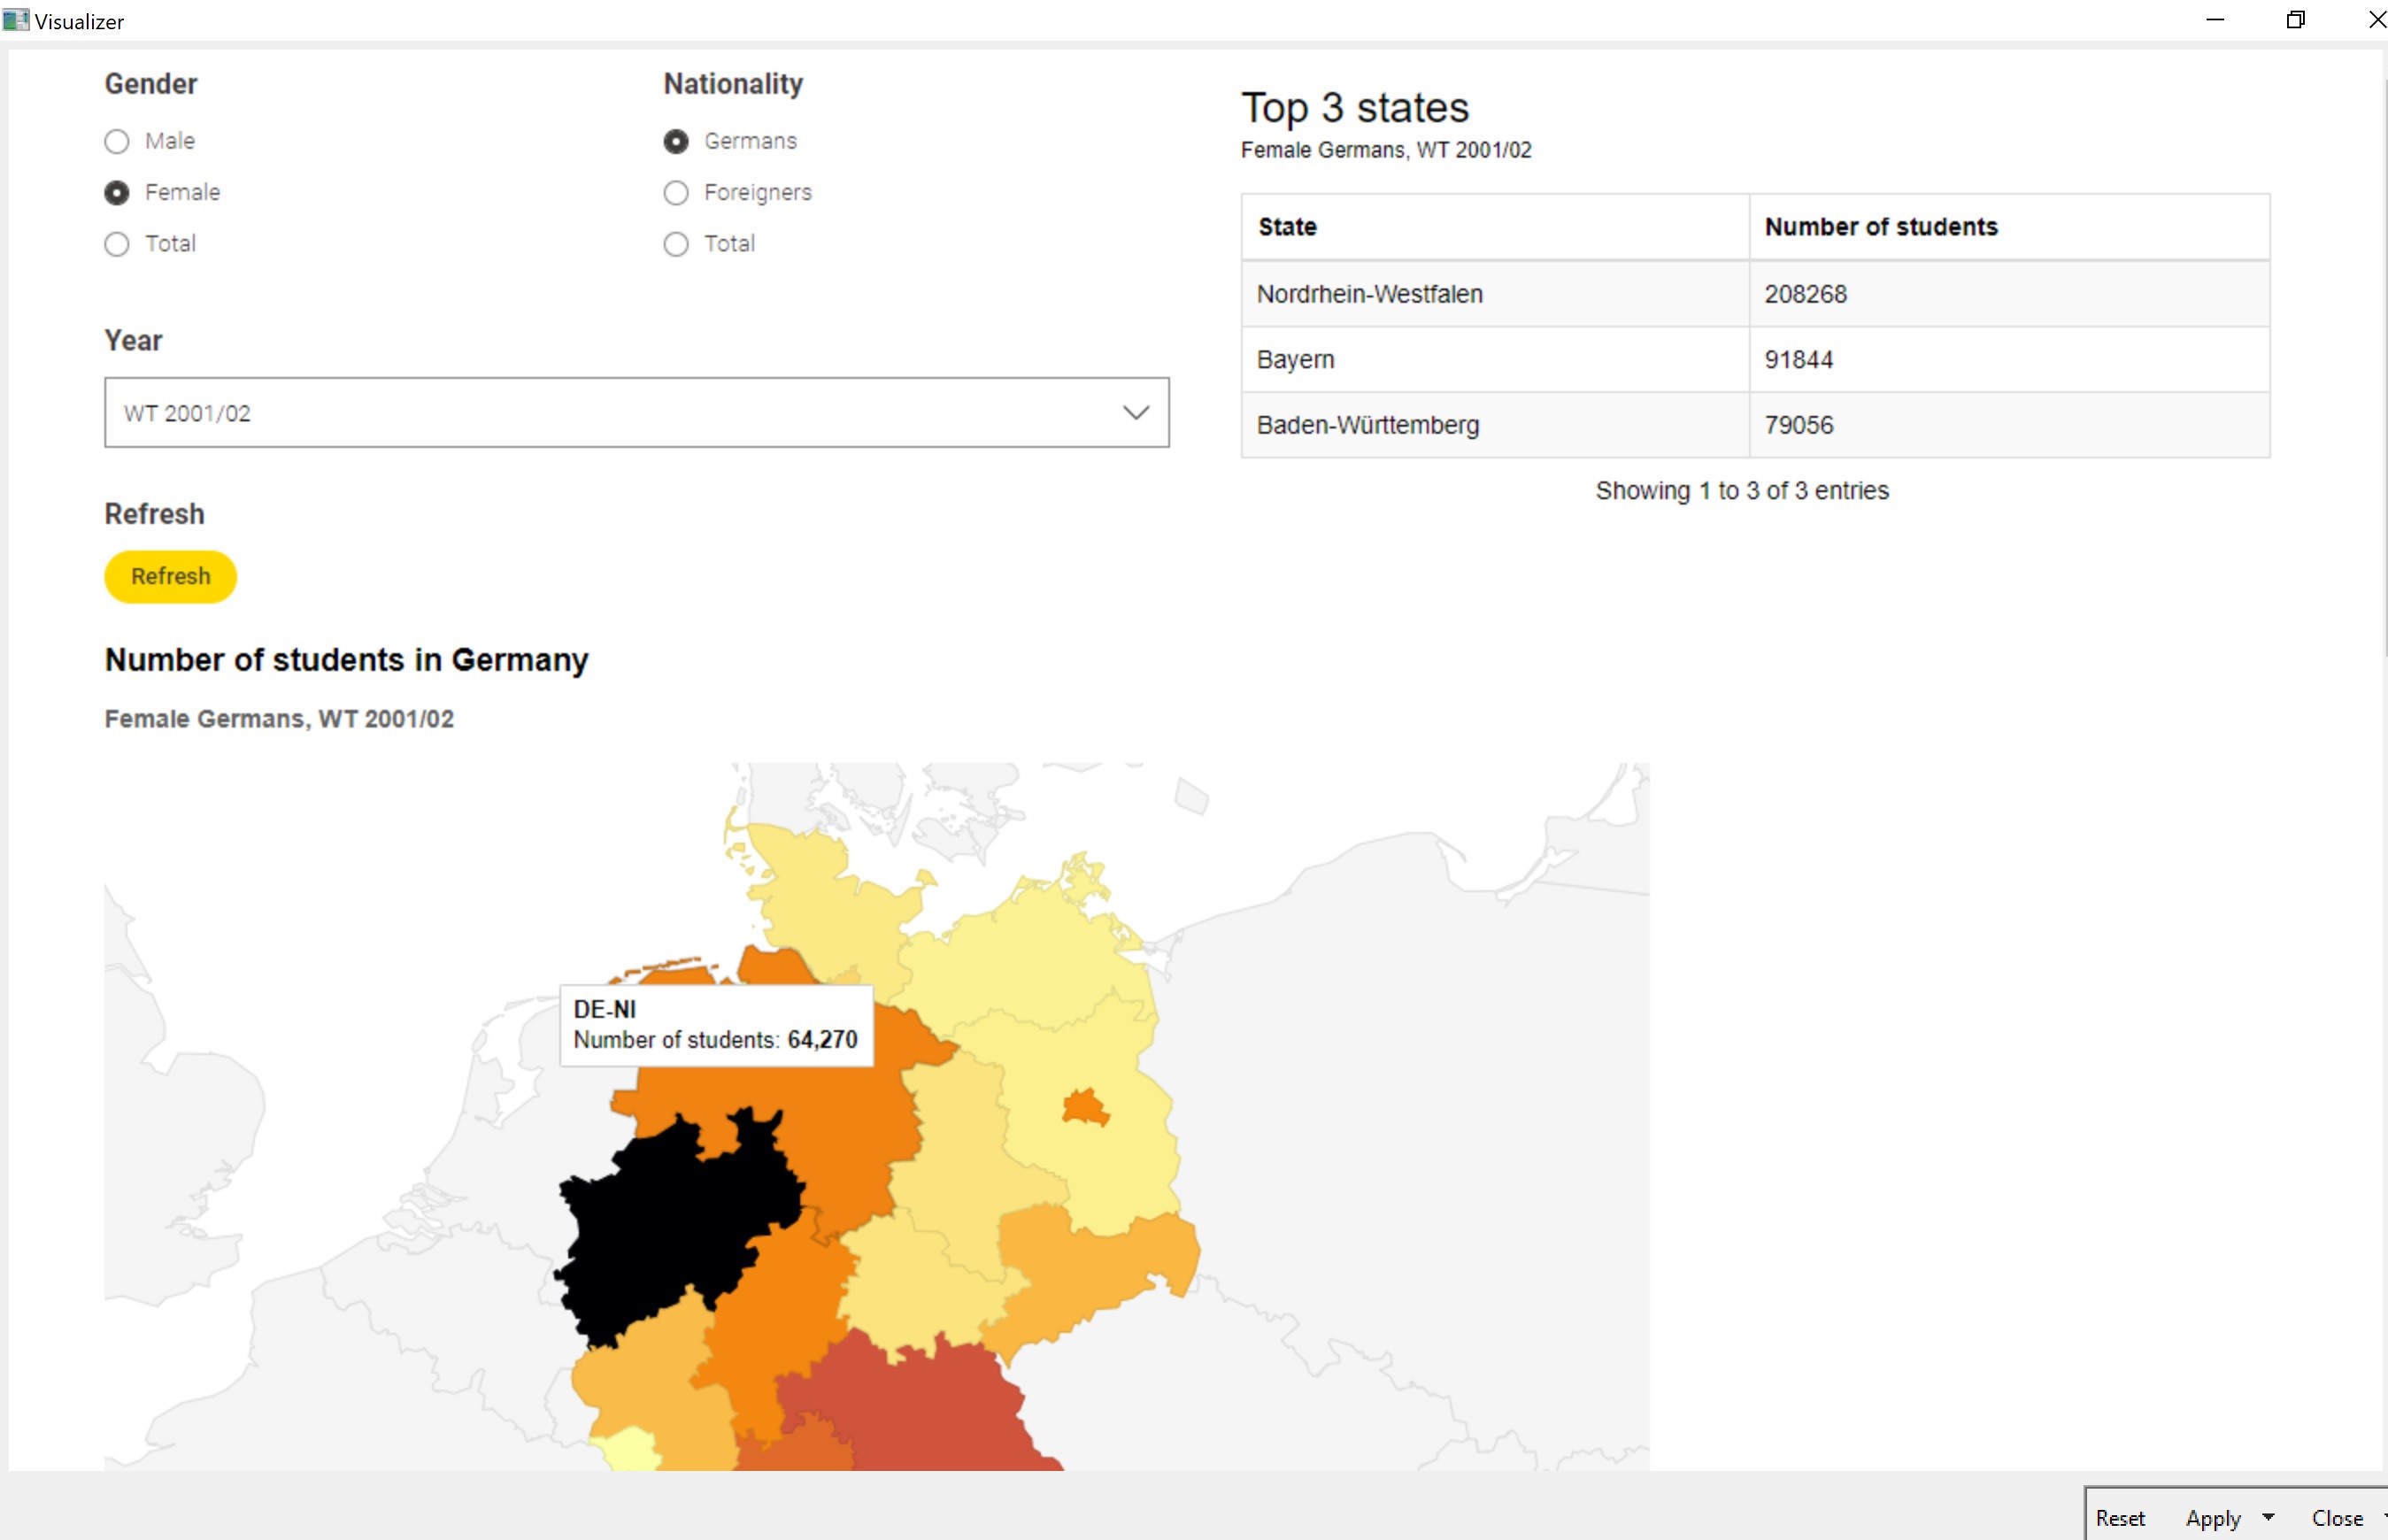
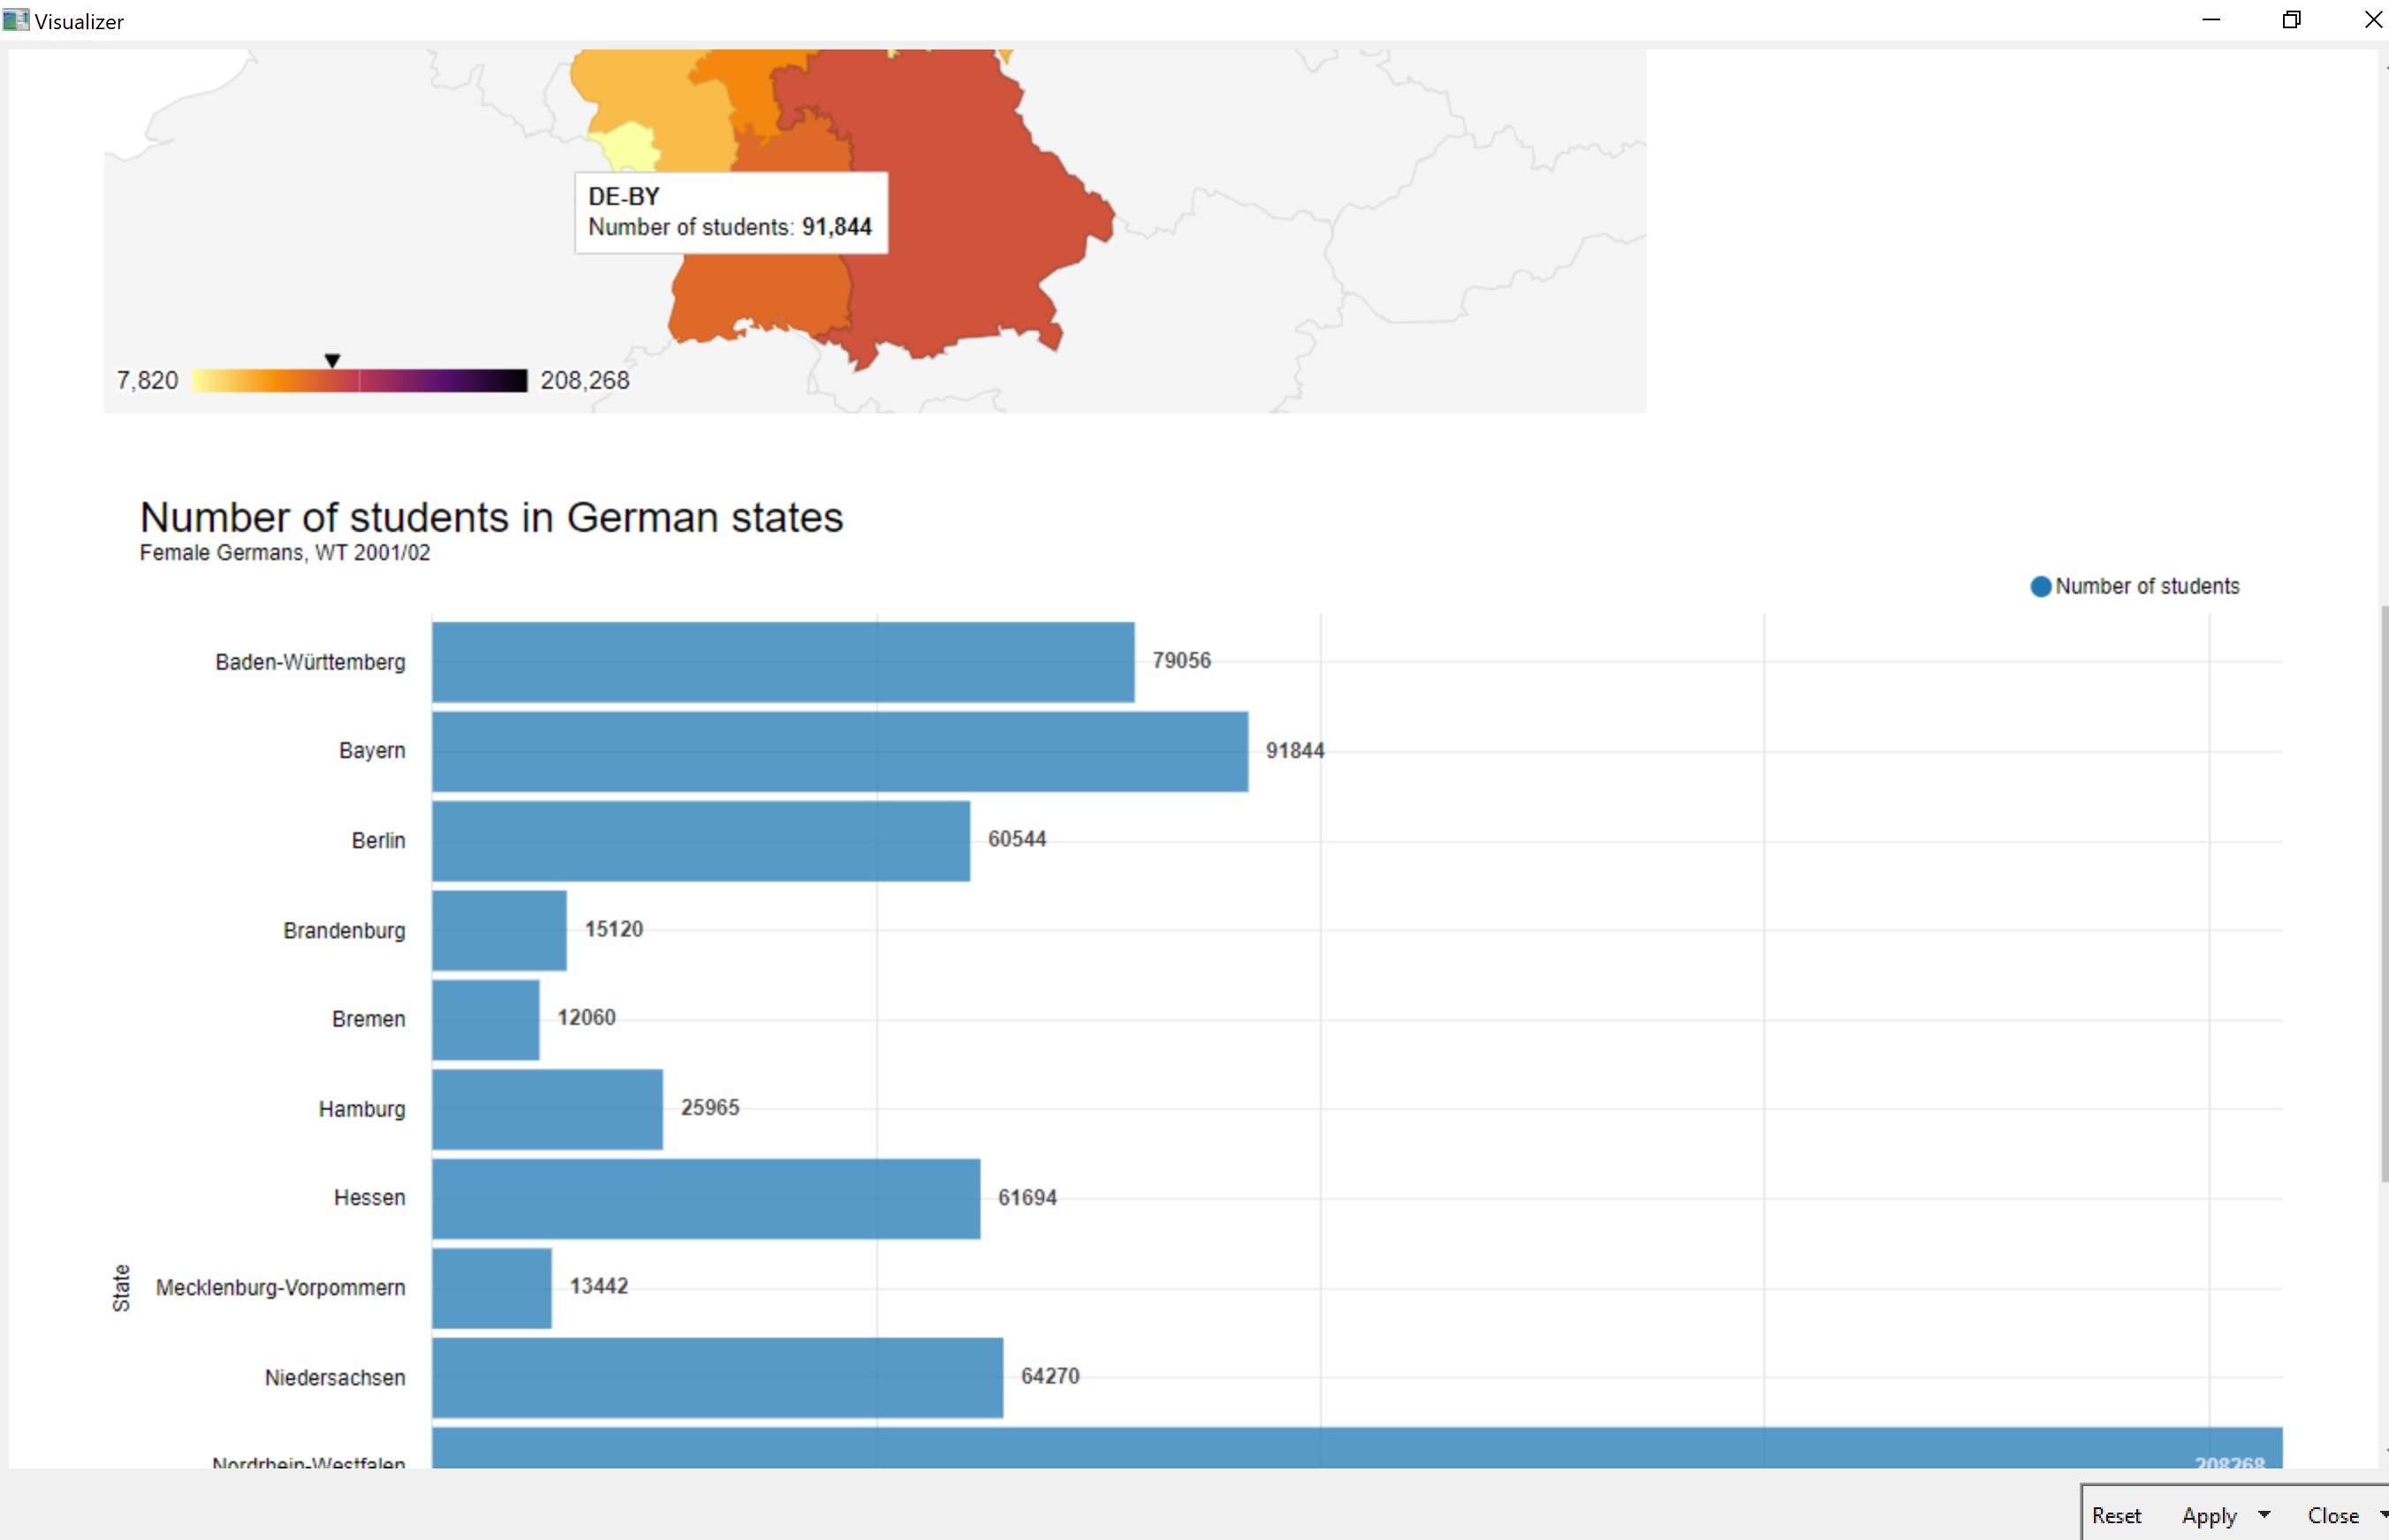
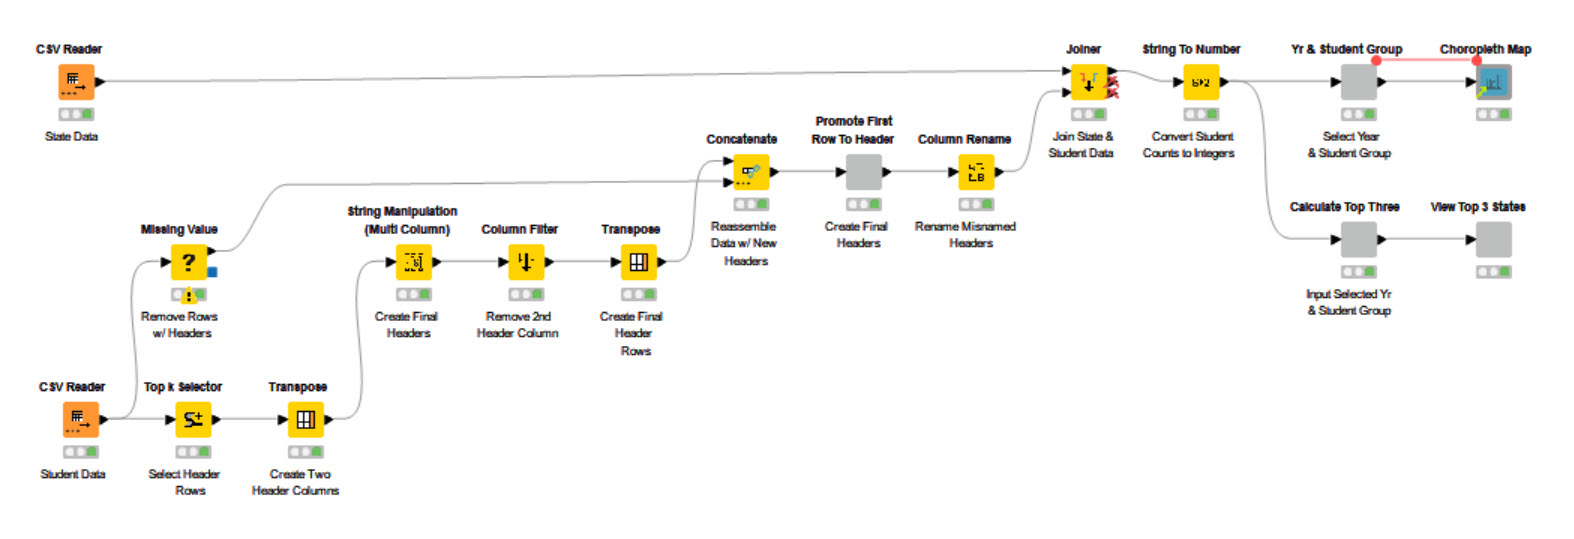
In general, a visualizer was created to view the number of foreign students in German states over the years, using an interactive map, a bar chart, and a table of the top 3:


There is also a bonus visualizer with a similar format which allows all combinations of gender and nationality, including totals as well:


Hopefully, the workflows function as intended.

2 Likes

Hi,
here is my solution
justknimeit-30

All the best

2 Likes

Hi,
here my solution:. jKi-30 – KNIME Hub

2 Likes

My Take on Challenge 30 - Visualizing KPIs by States

The workflow need bit more work… though.

2 Likes

Here’s my solution. Not very elegant, but works.

2 Likes

Hi,
I changed my workflow because the Brandenburg state is not recognized by the Choropleth map, it needs states as codes as input.

All the best

2 Likes

As always on Tuesdays, here is our solution to the challenge 30! :apple: :woman_student: :man_student:

As you can see, we kept it quite simple in our solution :blush:
It’s amazing to see all your different approaches though :star_struck:
Don’t forget to come back tomorrow for a new challenge! :heart_eyes:

1 Like

This is my solution to the challenge
Challenge 30 - Visualizing KPIs by States

image

2 Likes

This topic was automatically closed 90 days after the last reply. New replies are no longer allowed.