This thread is for posting solutions to “Just KNIME It!” Challenge 35. Learn how to work with network data using a LinkedIn graph as a concrete application!
First of all, thanks to the previous @lelloba 's post , good insights to start from. It’s been quite hard to set up with the multiple configurations; but it worth the new learnings.
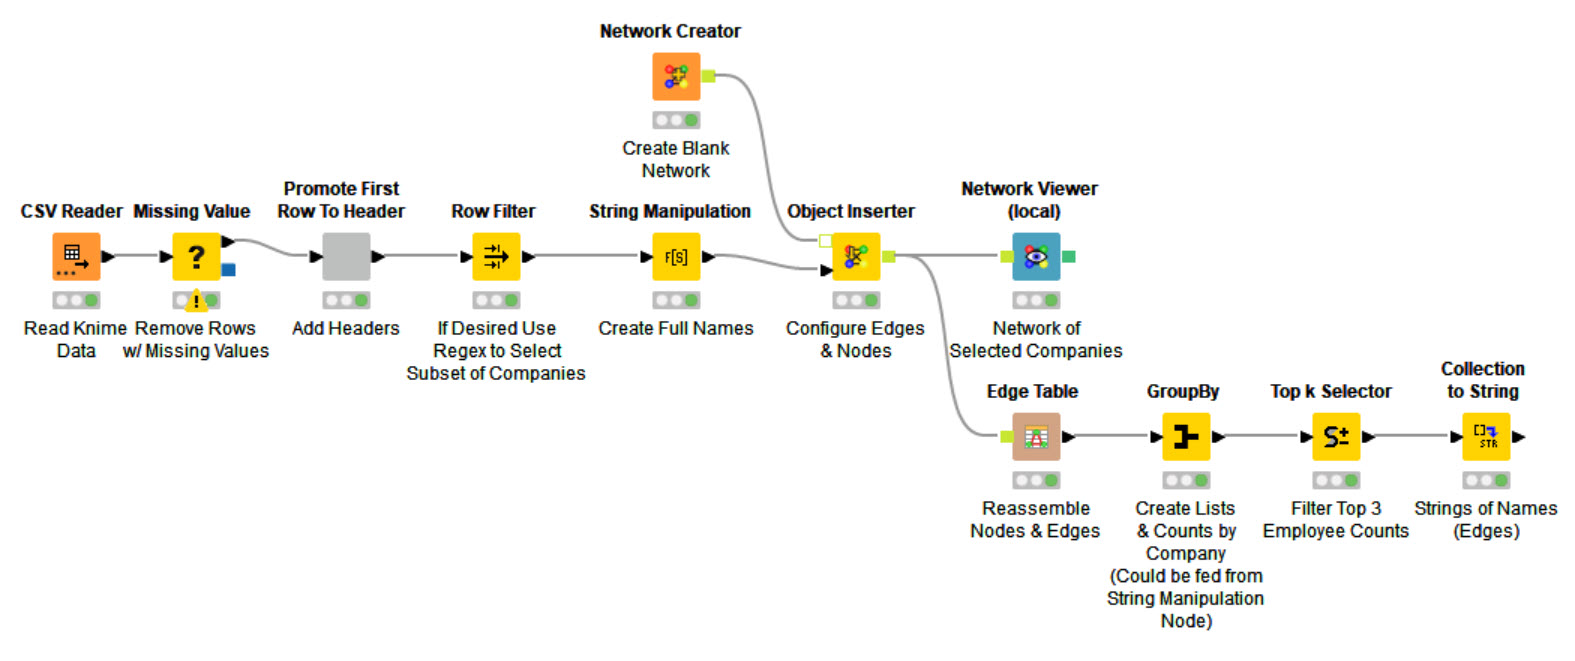
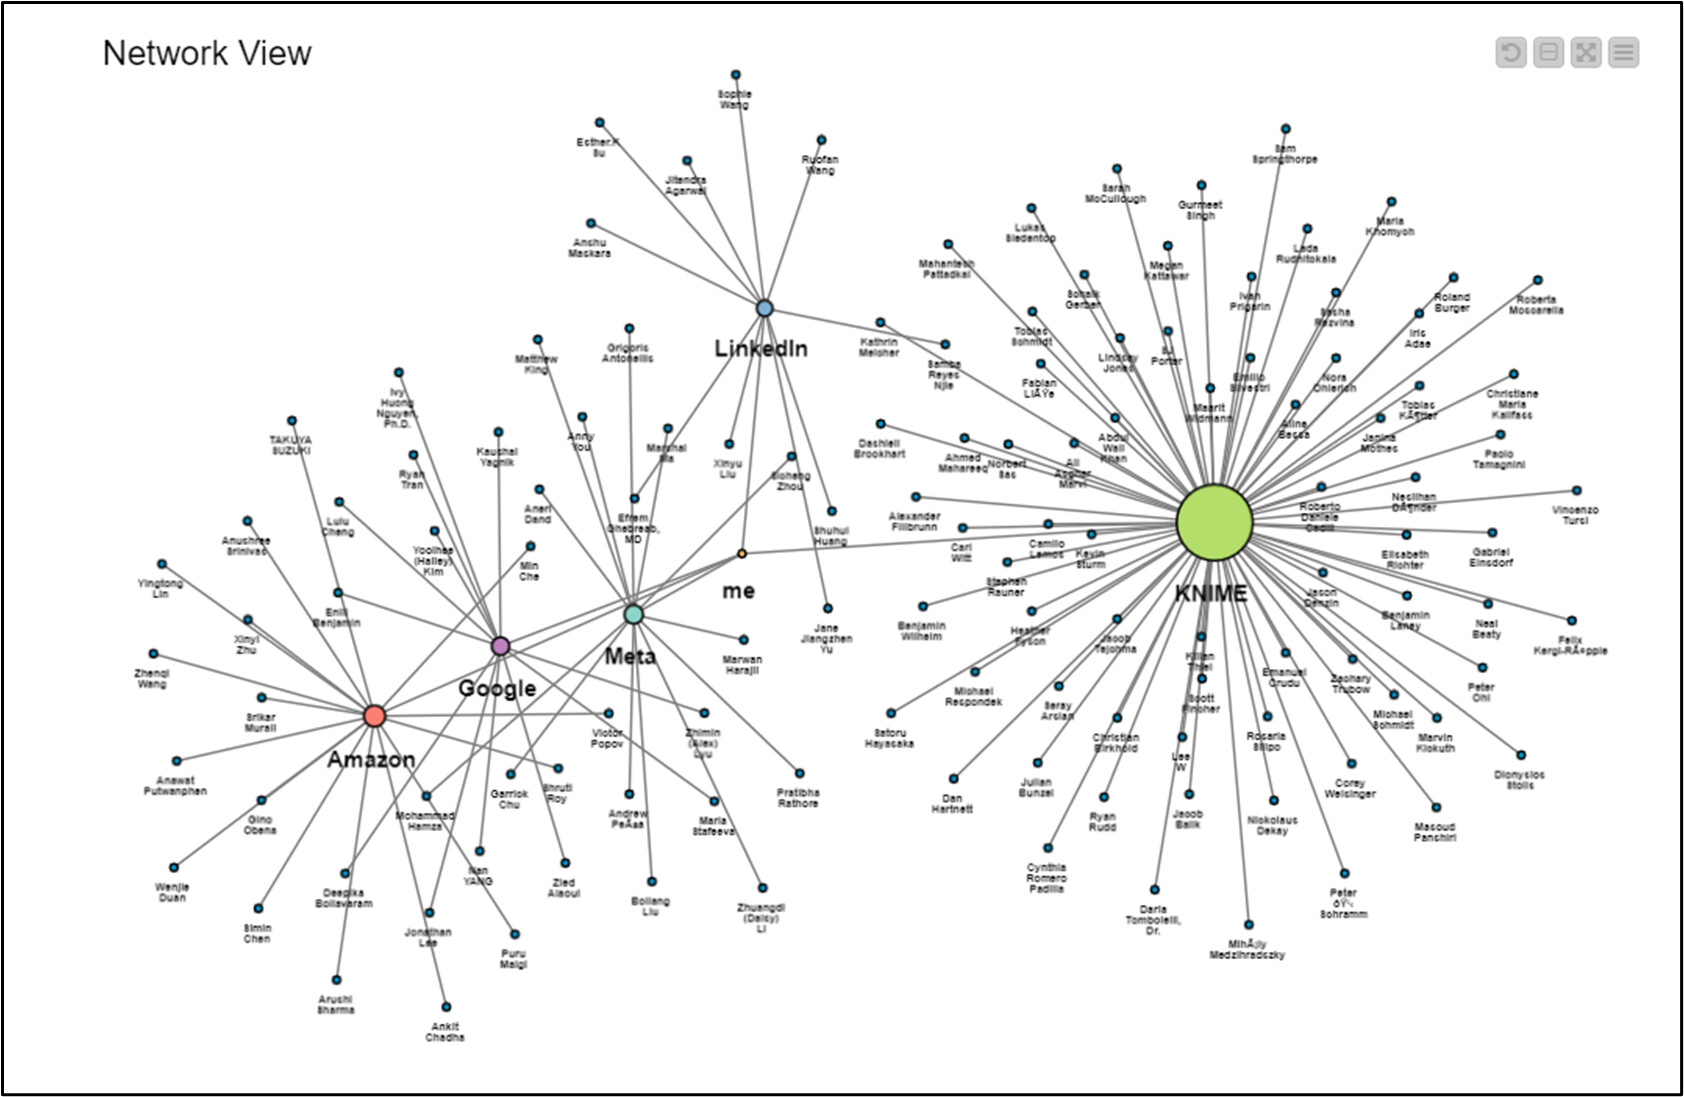
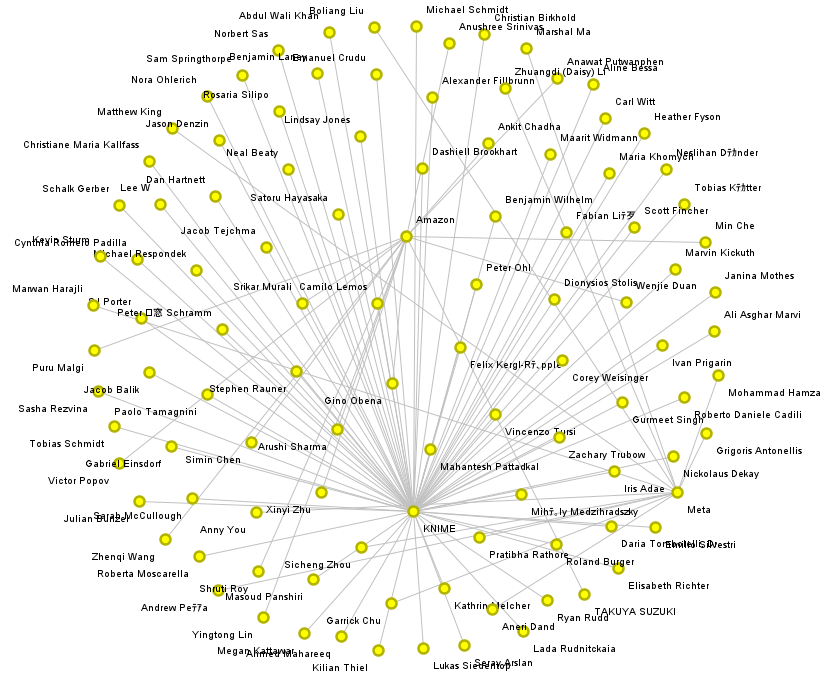
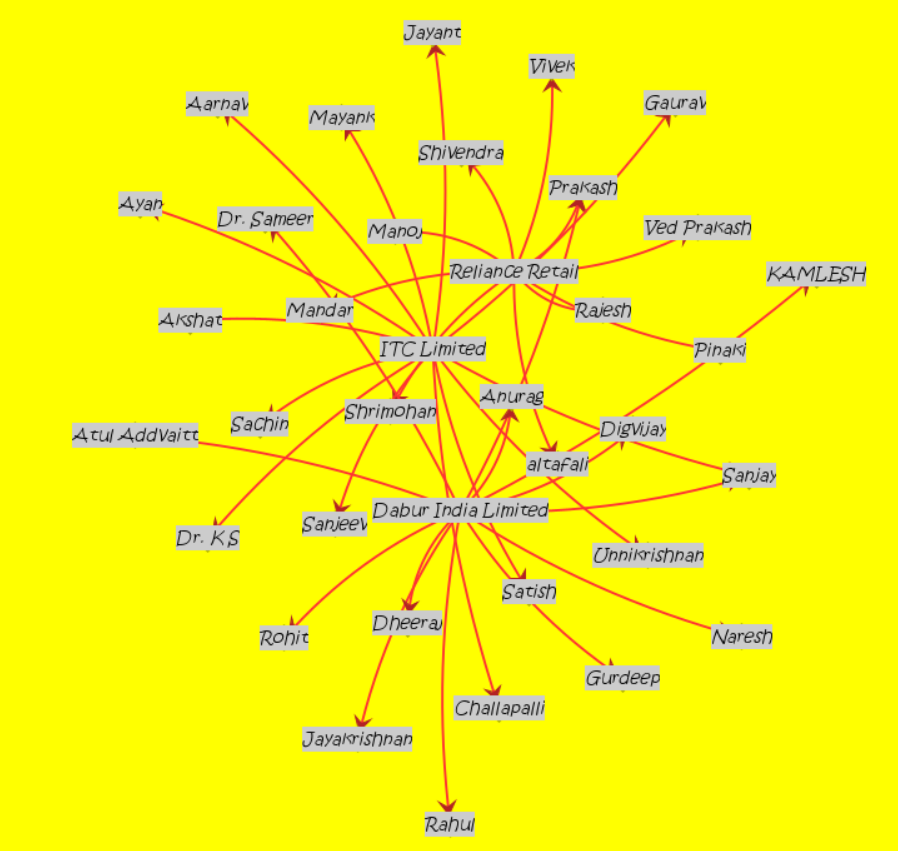
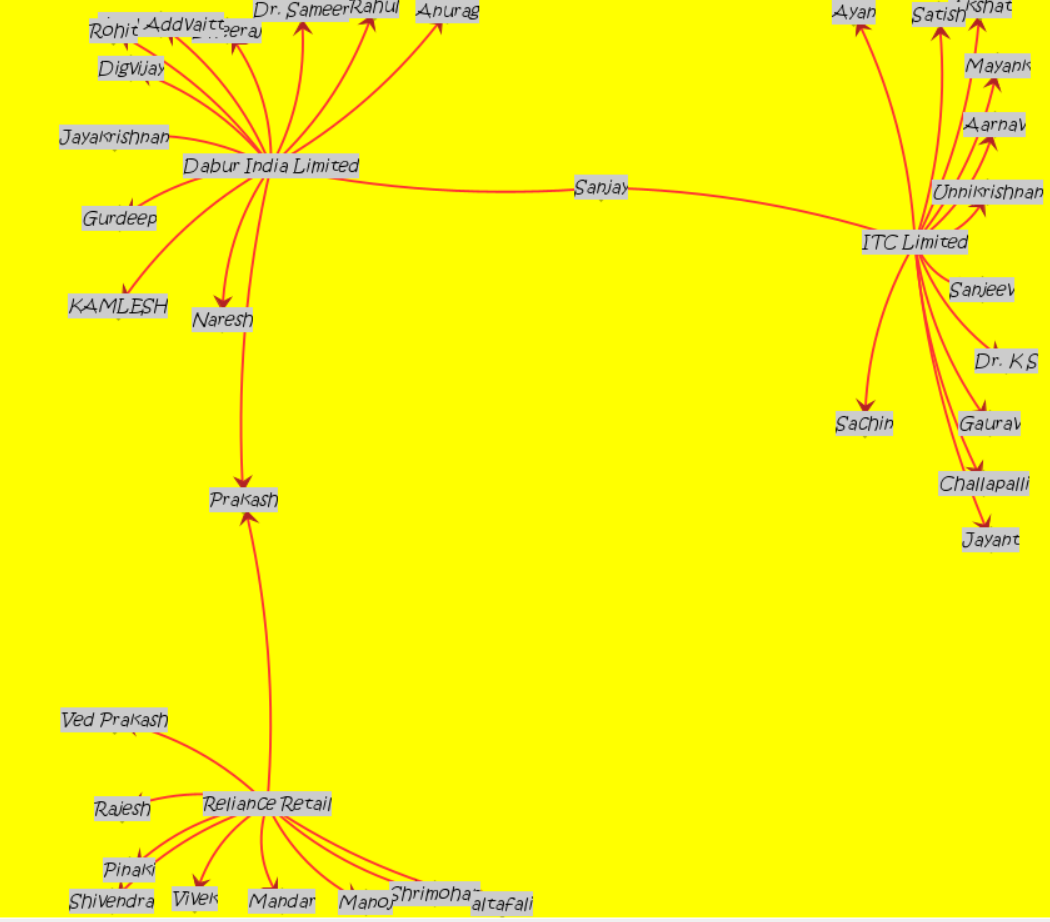
My try on the Network graph- Nodes and edges bit new topic for me and trying to learn . I found the various networks interesting especially the Fruchterman - reingold and spring networks . Interesting topic would love to learn more and understand how to assign weights.
As always on Tuesdays, here’s our solution to last week’s “Just KNIME It!” challenge.
This one was hard but fun, right? We hope you learned a thing or two about network data and graph visualization with this challenge. Were the results you obtained insightful or sort of expected?
Thanks to everyone who participated! We’ll see you tomorrow for a new challenge!