It’s Wednesday once again! And here we are with a fresh Just KNIME It! challenge.
As the UEFA European Football Championship unfolds, let’s create a data app to visualize, for any timeframe in football history, what teams held the most victories . We can’t wait to see if you find any surprising rankings!
Here is the challenge. Let’s use this thread to post our solutions to it, which should be uploaded to your public KNIME Hub spaces with tag JKISeason3-6.
Need help with tags? To add tag JKISeason3-6 to your workflow, go to the description panel in KNIME Analytics Platform, click the pencil to edit it, and you will see the option for adding tags right there. Let us know if you have any problems!
I would suggest that you don’t use a nightly build KAP to build workflows for JKI. Very few other Knimers use nightly builds for production work. Its always tempting because of new features but it means most Knimers won’t be able to use your workflow.
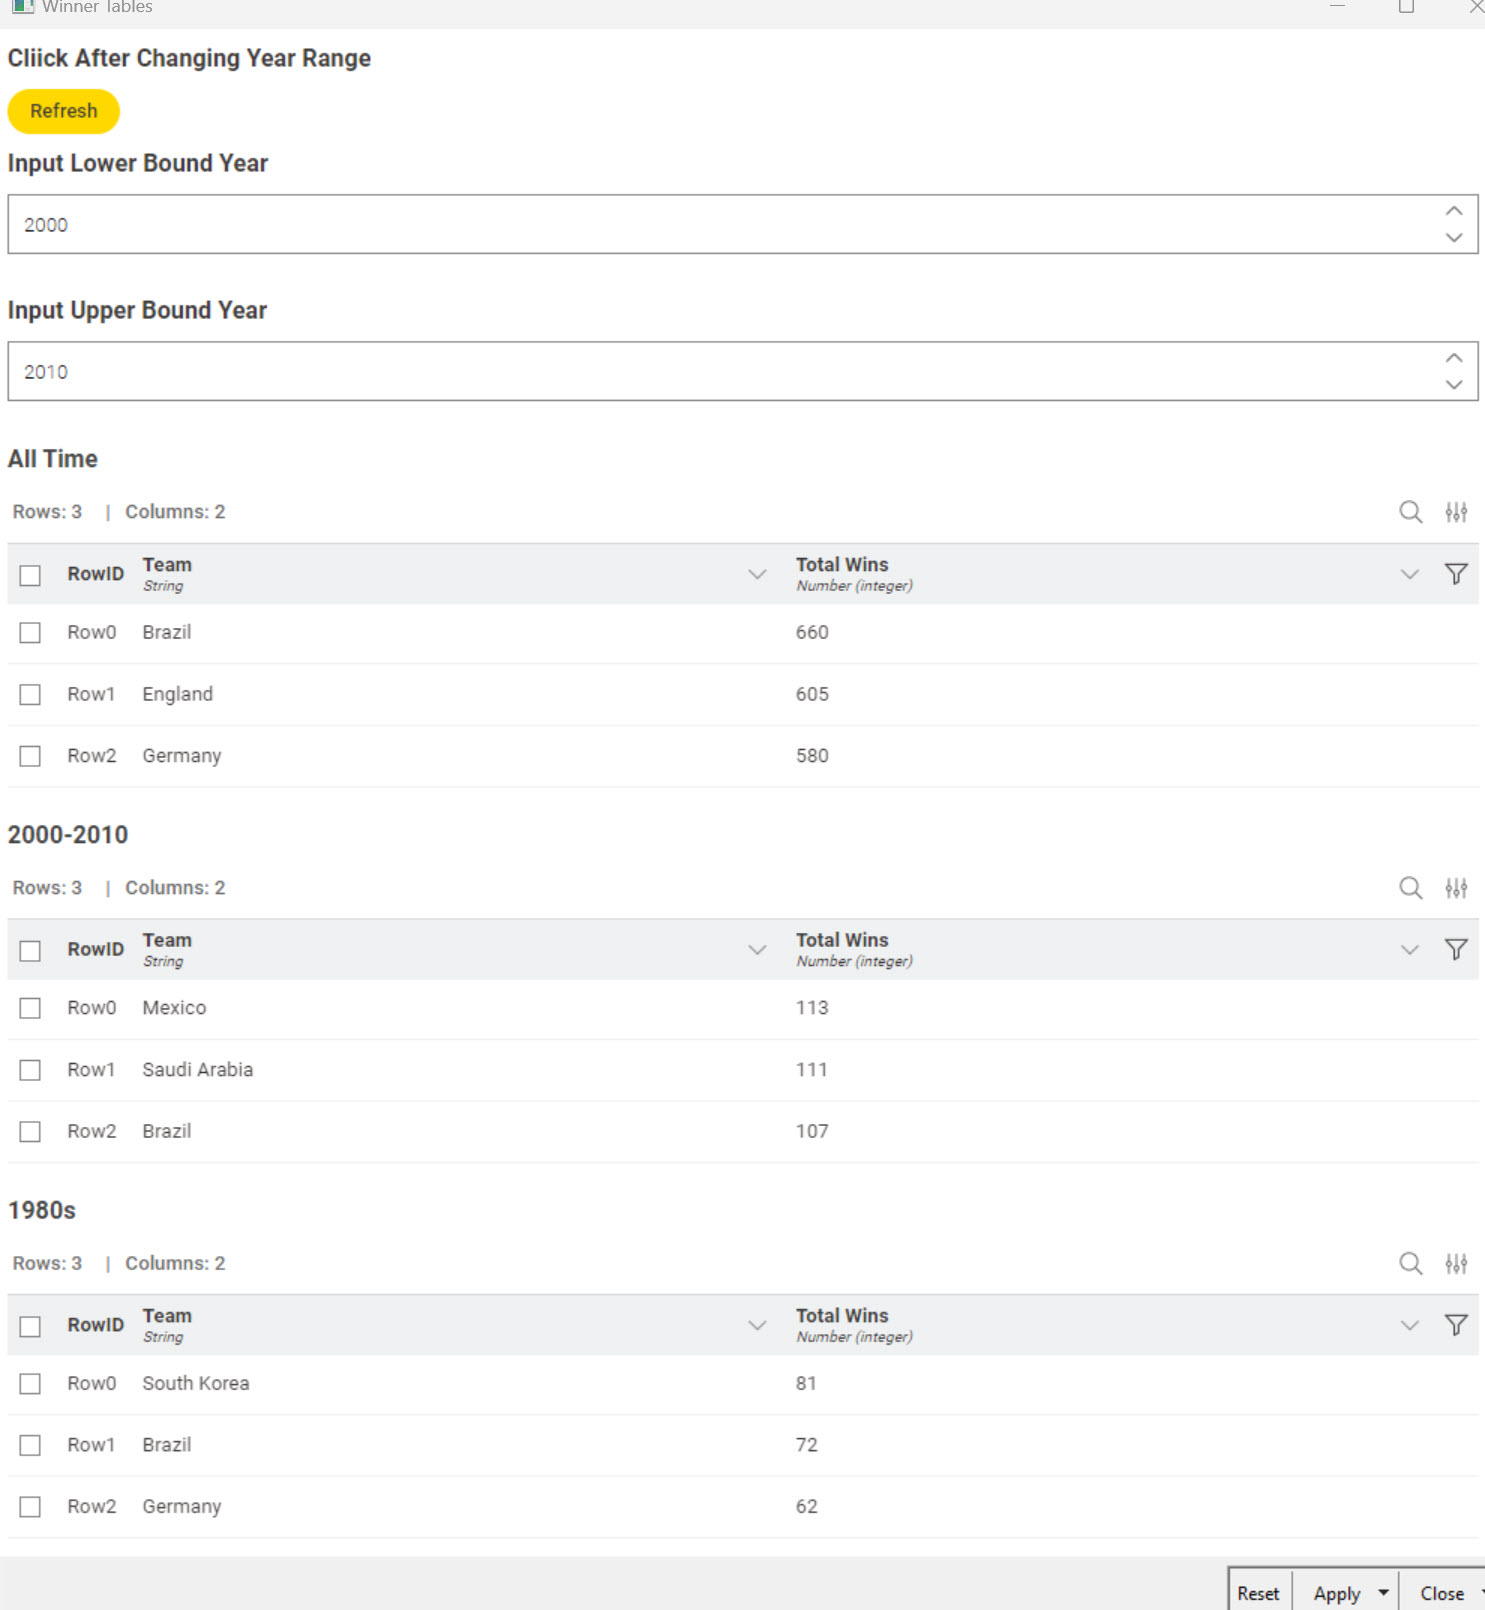
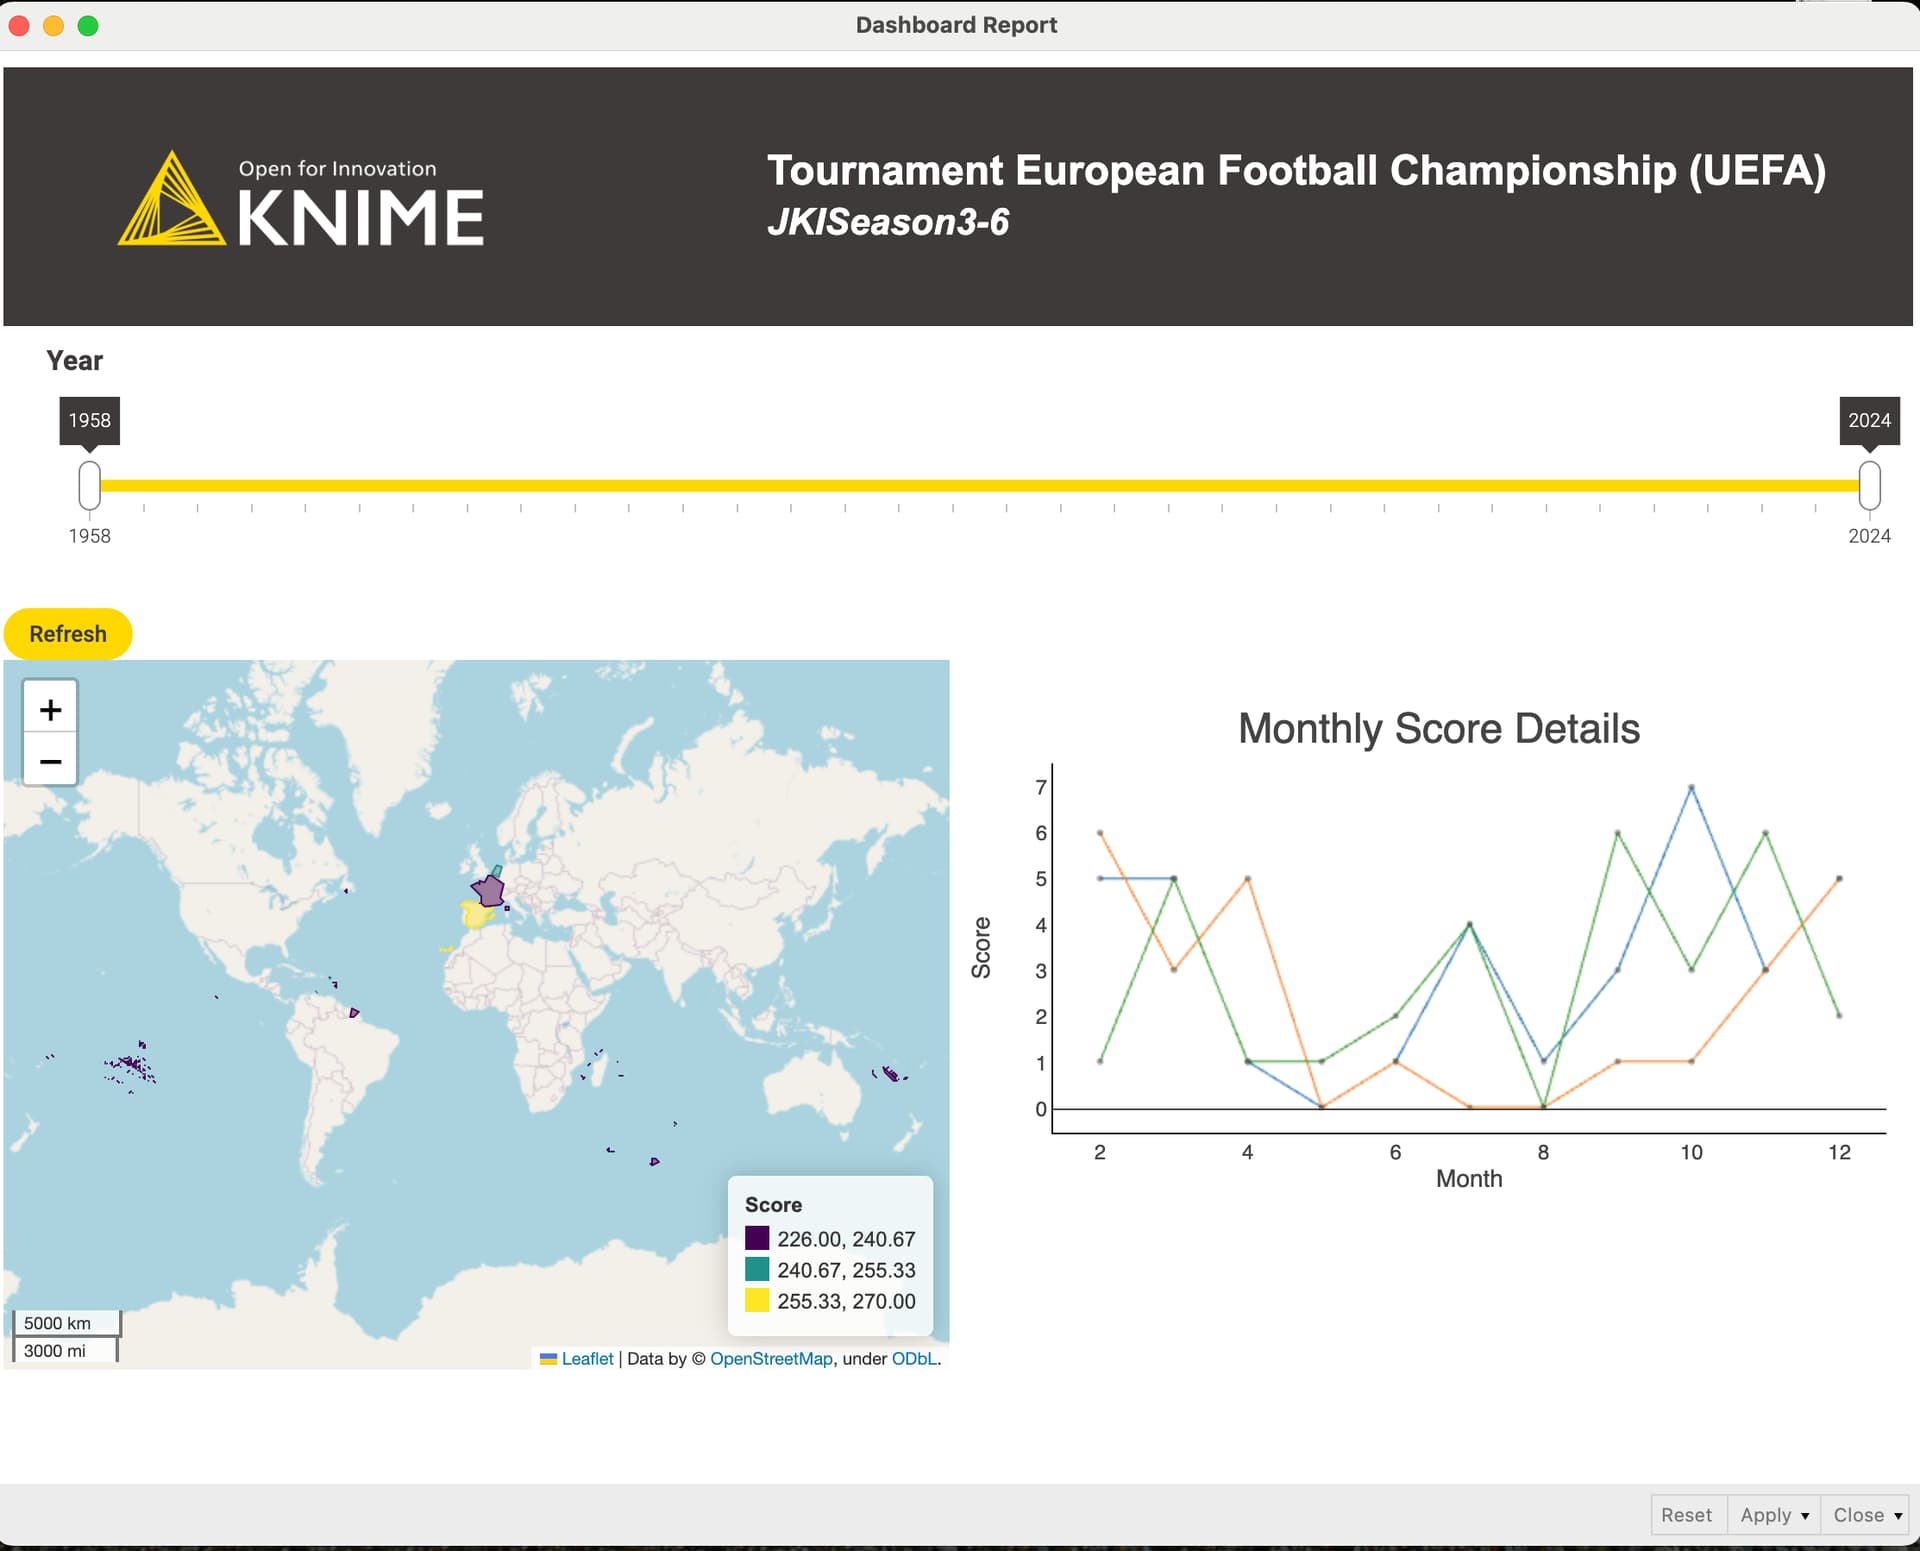
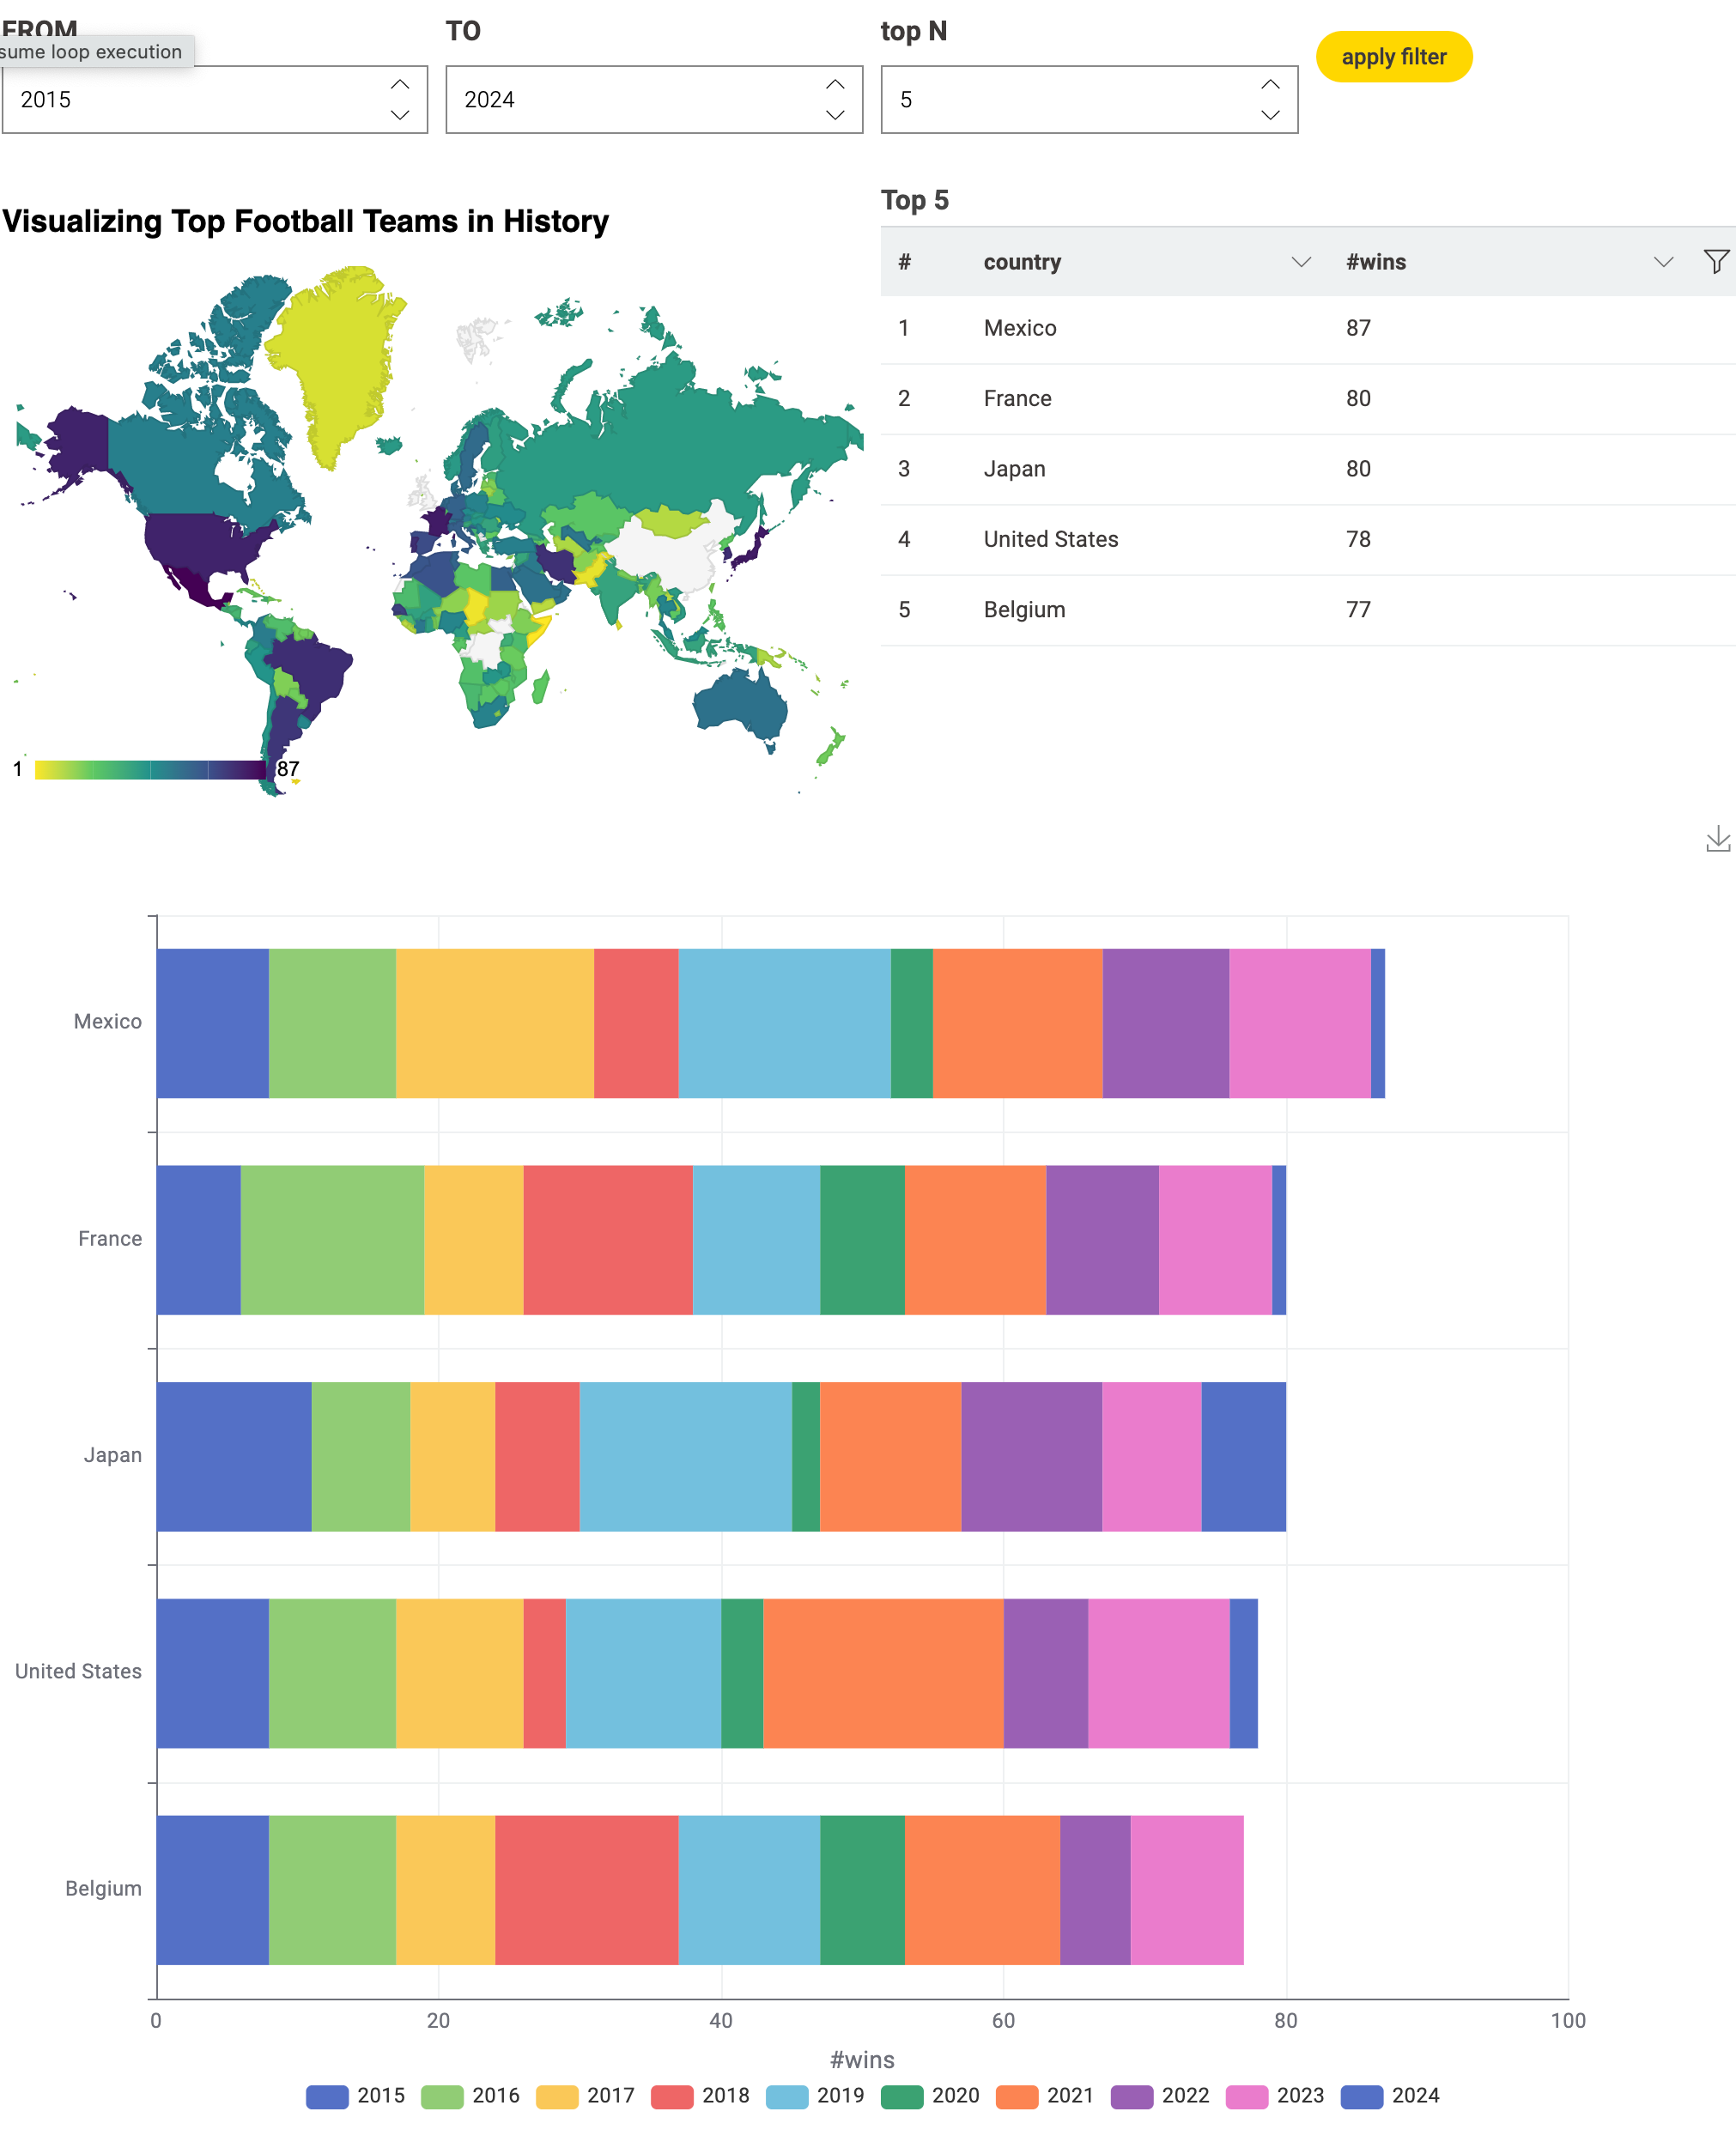
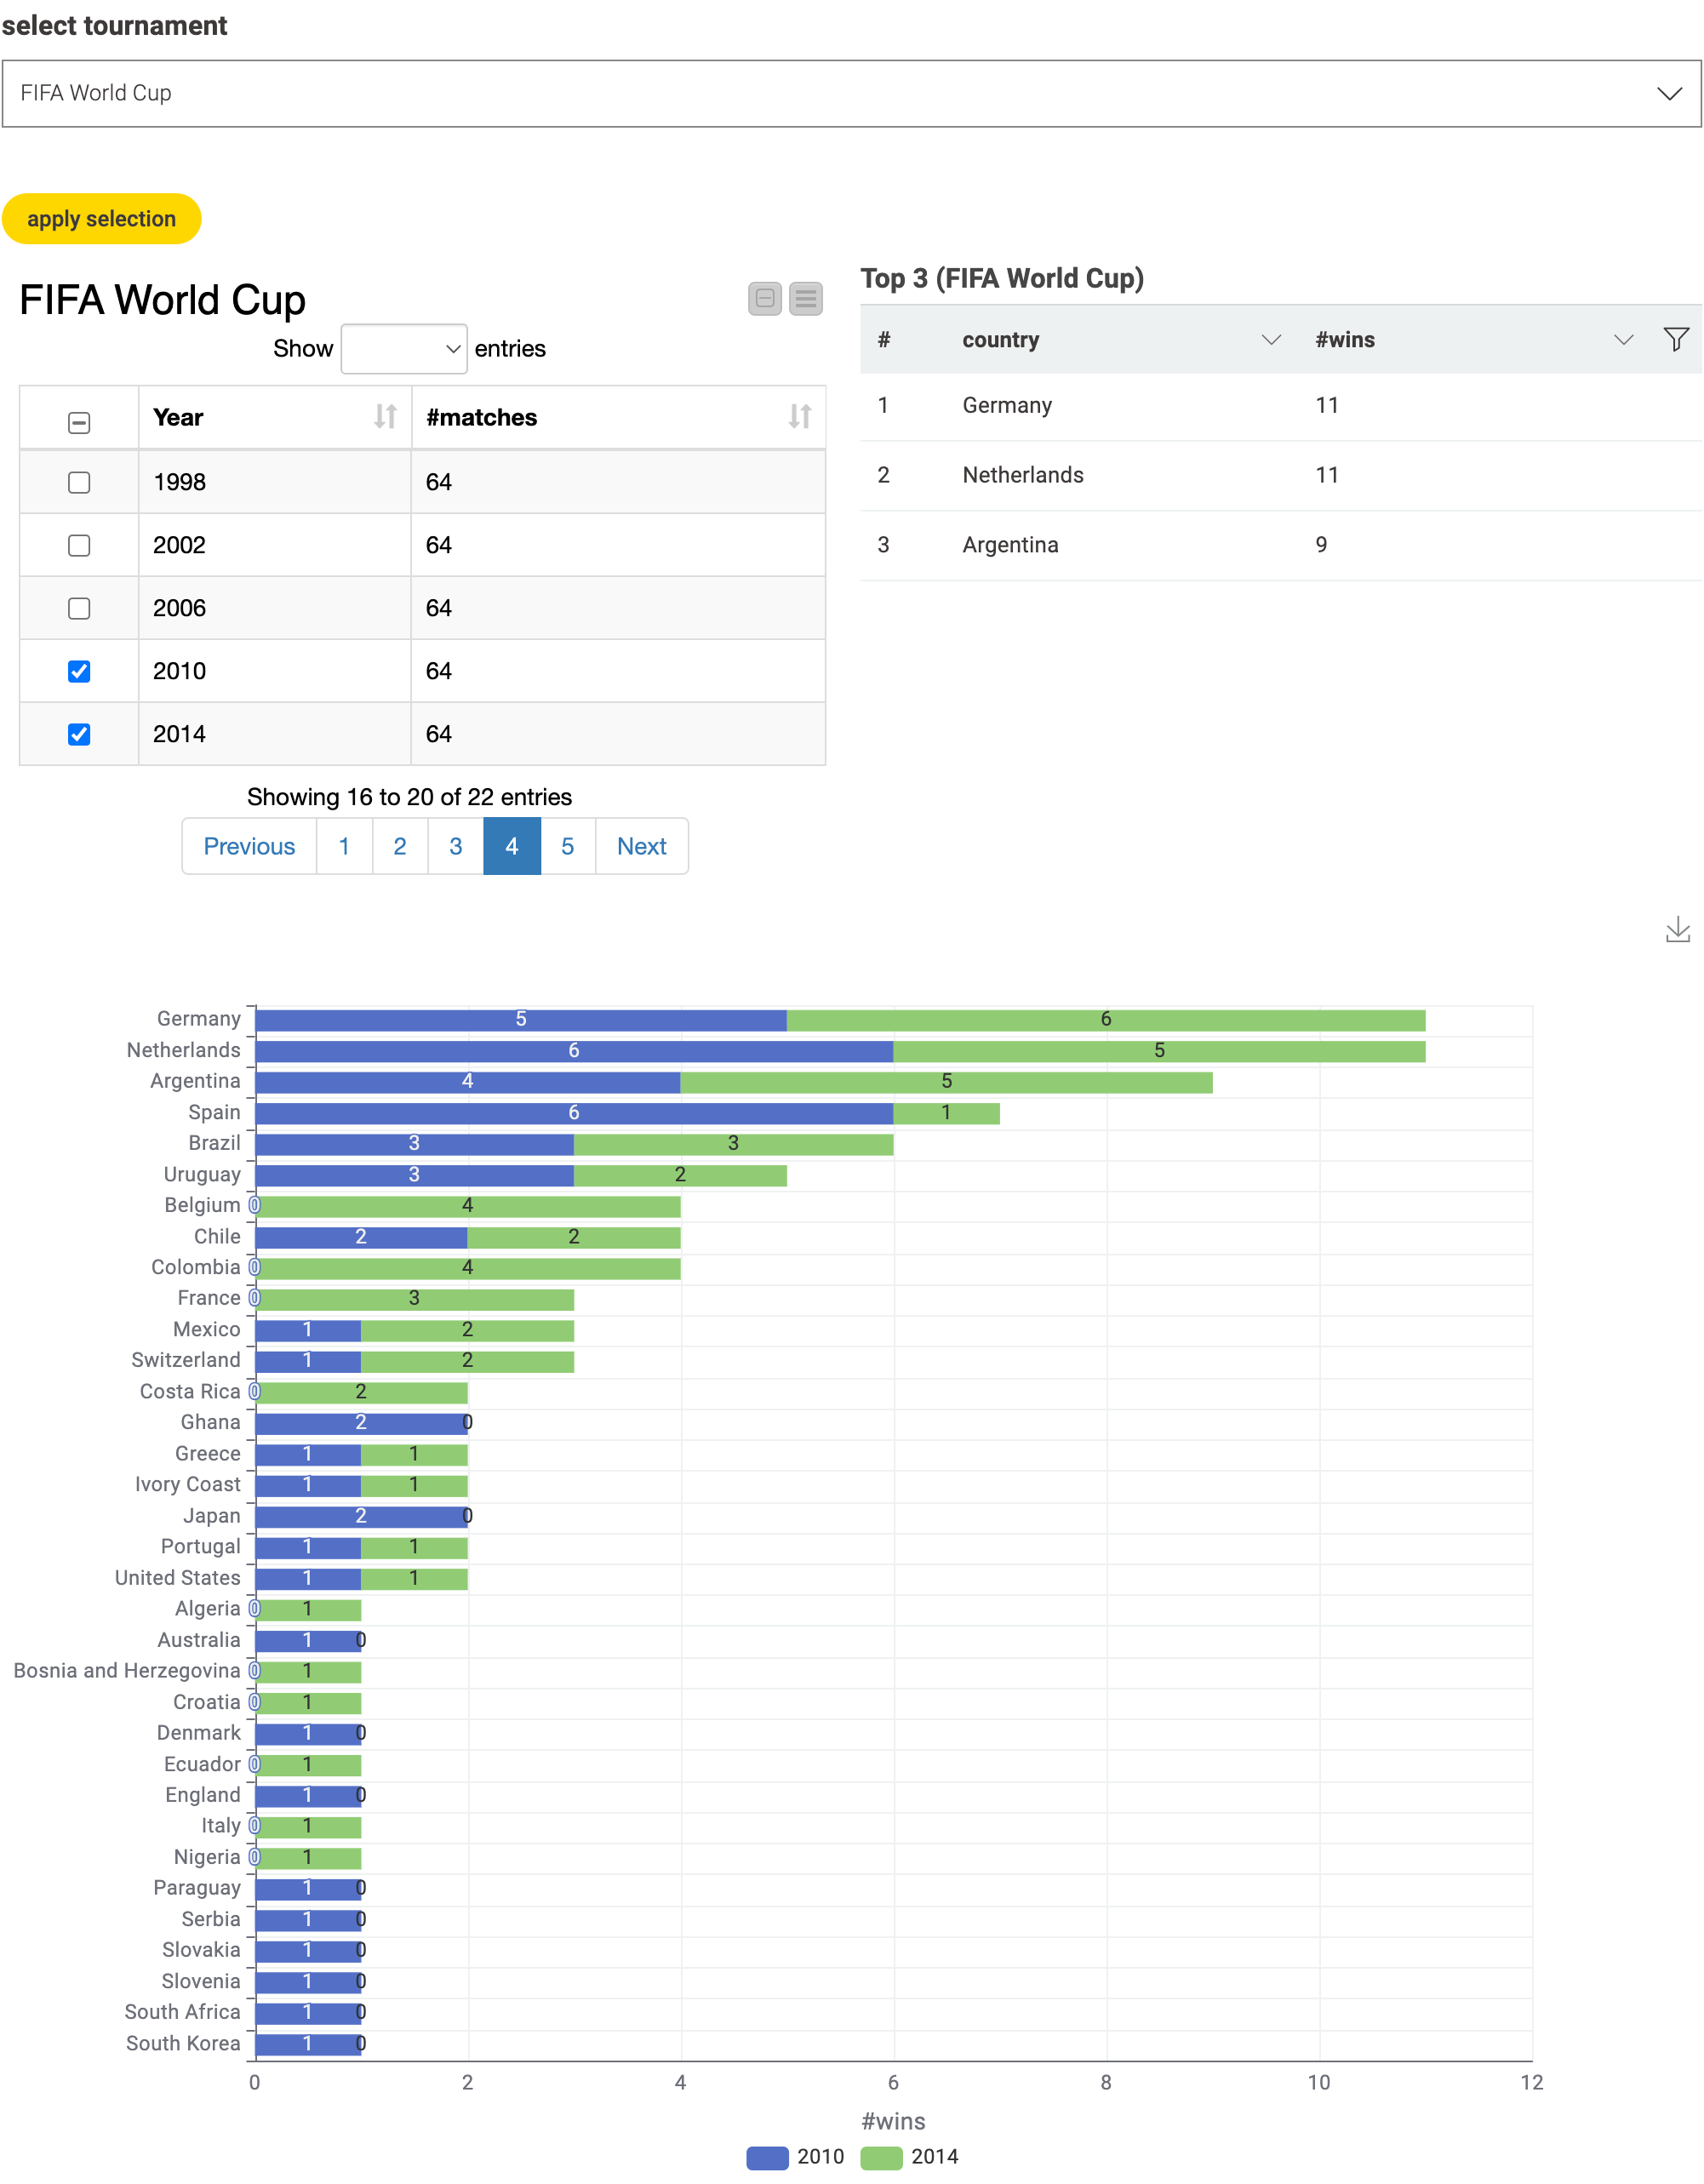
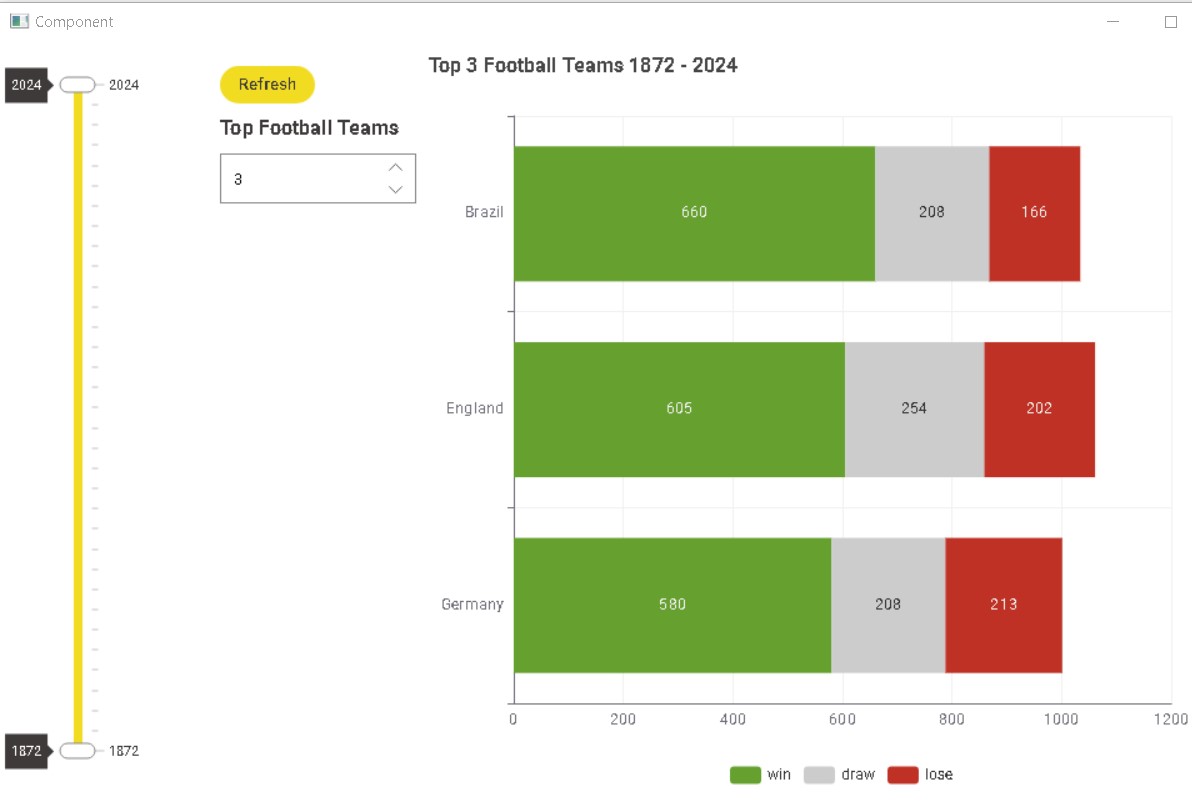
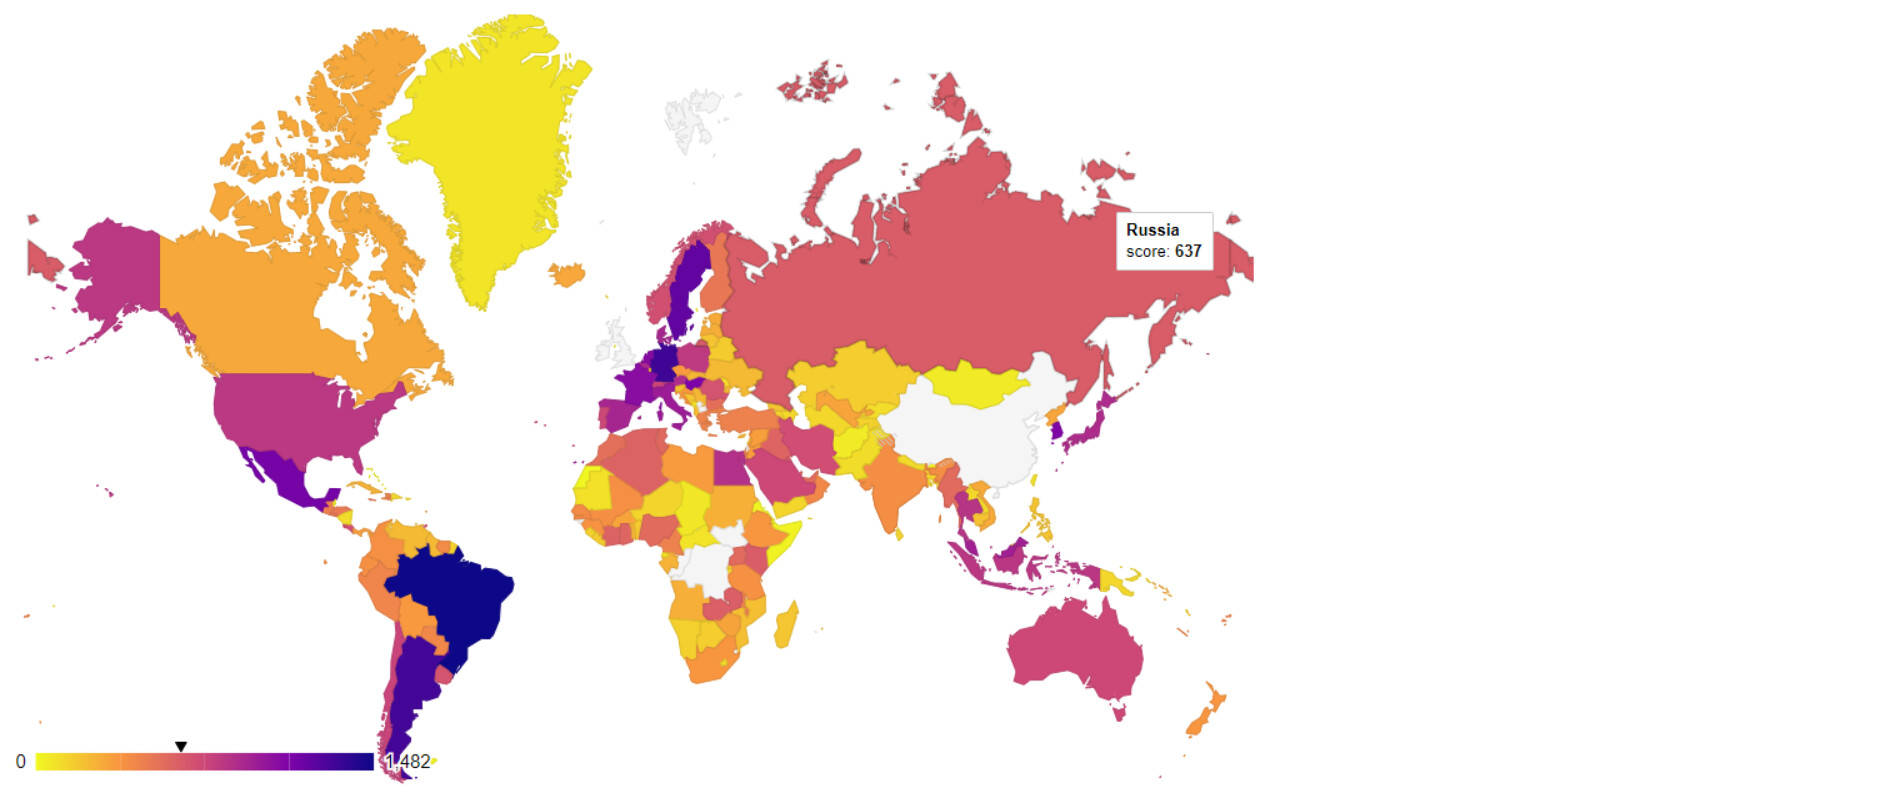
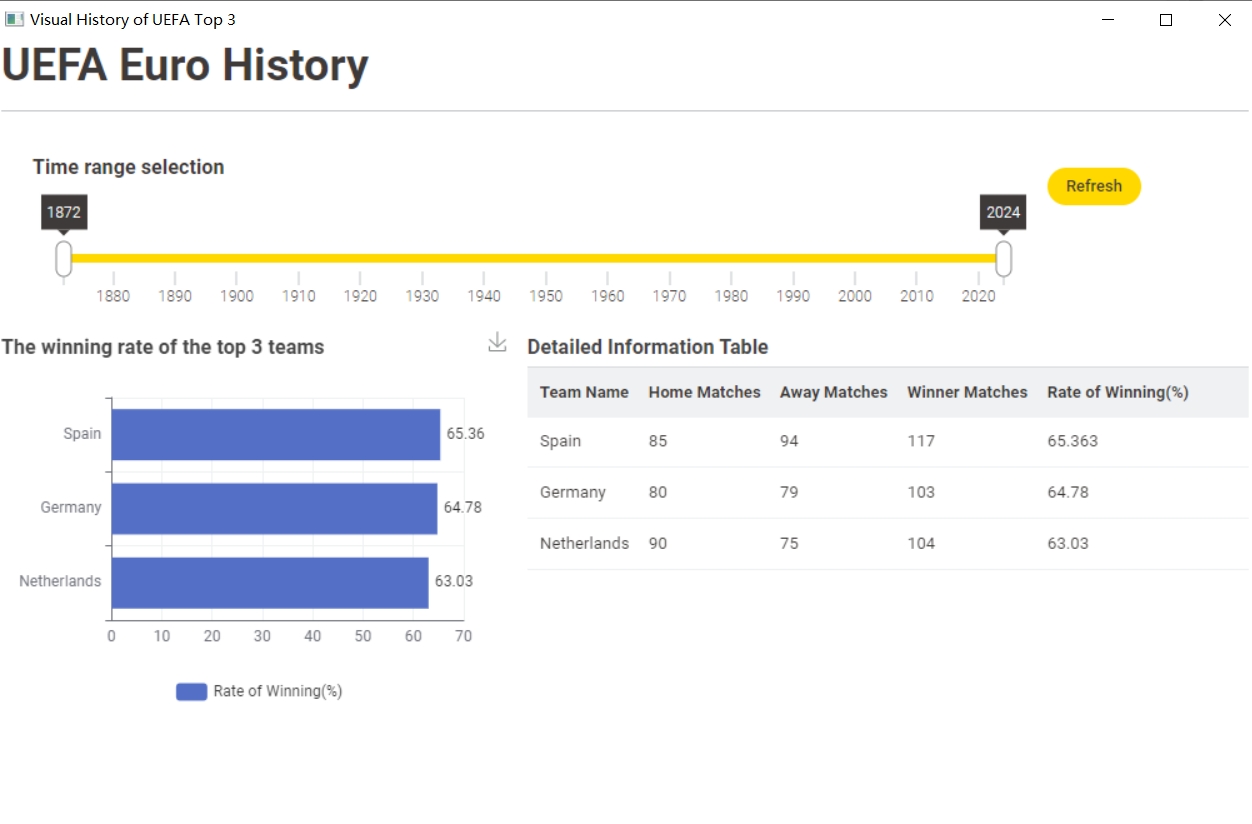
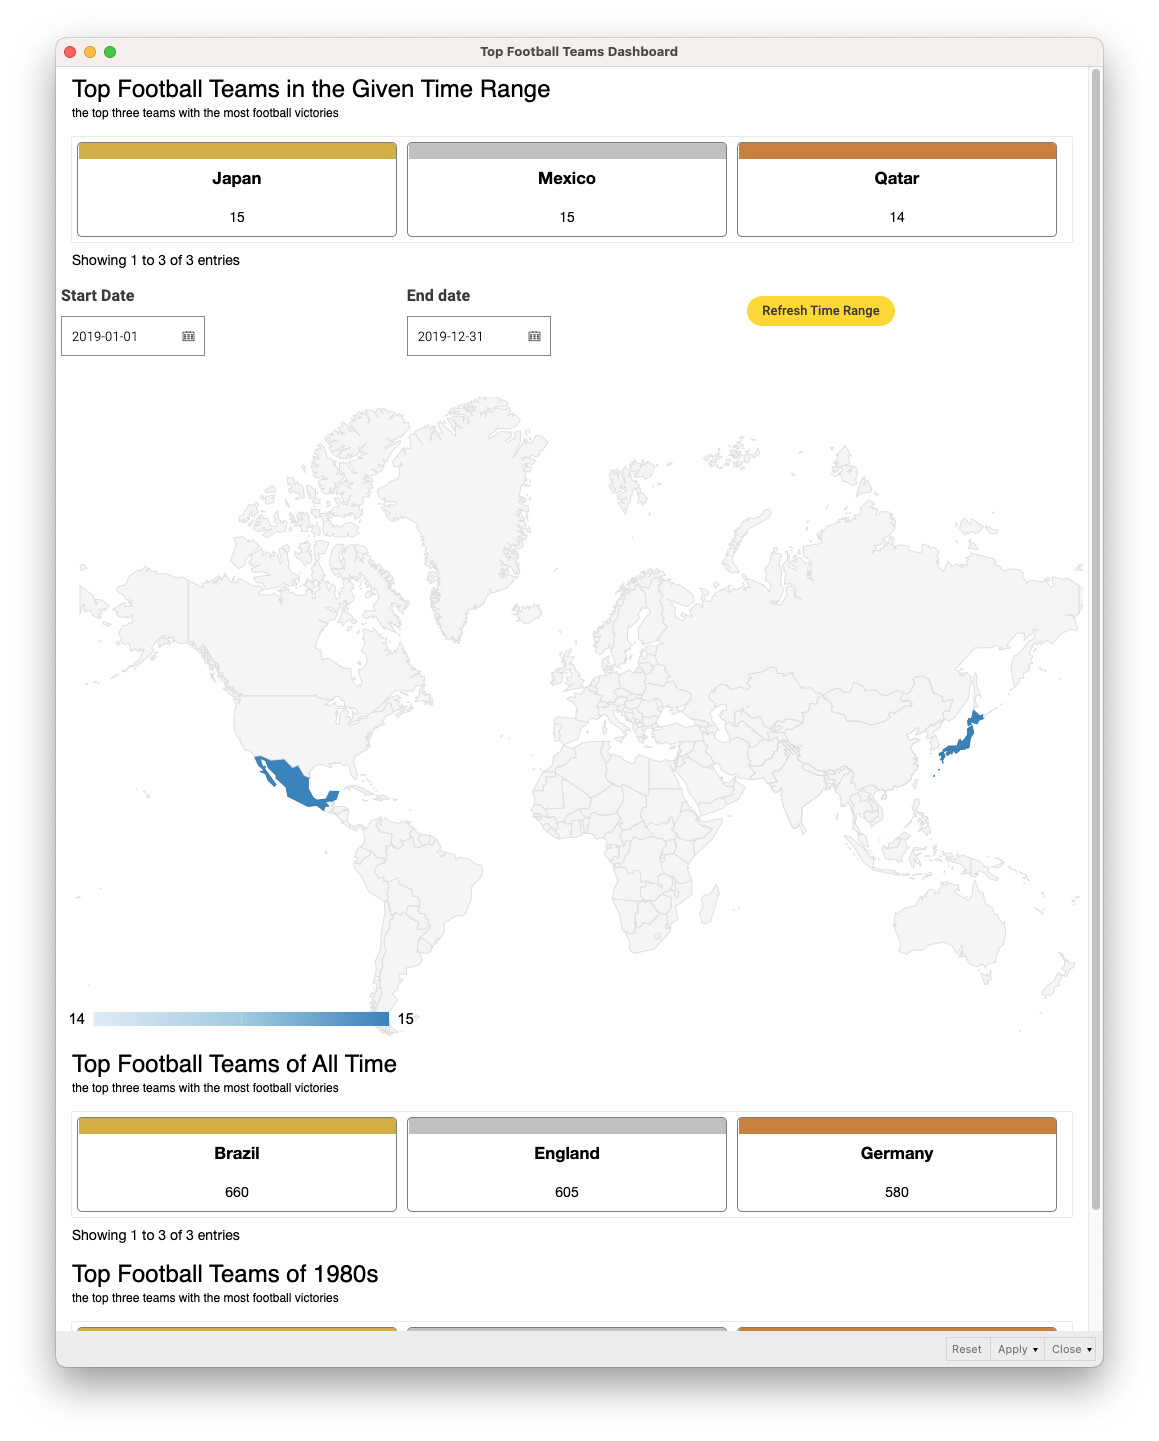
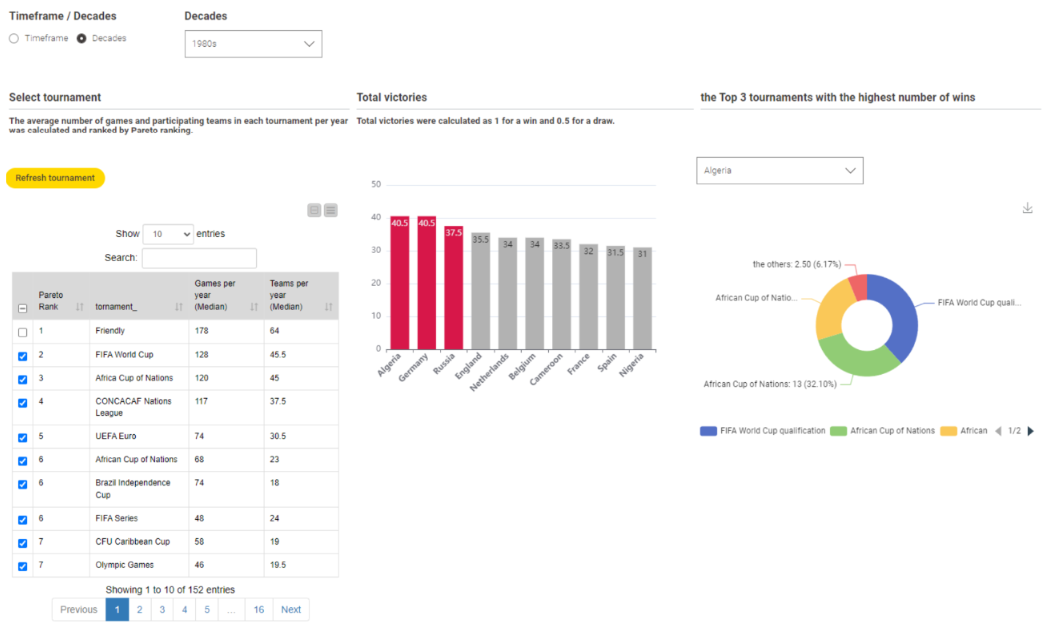
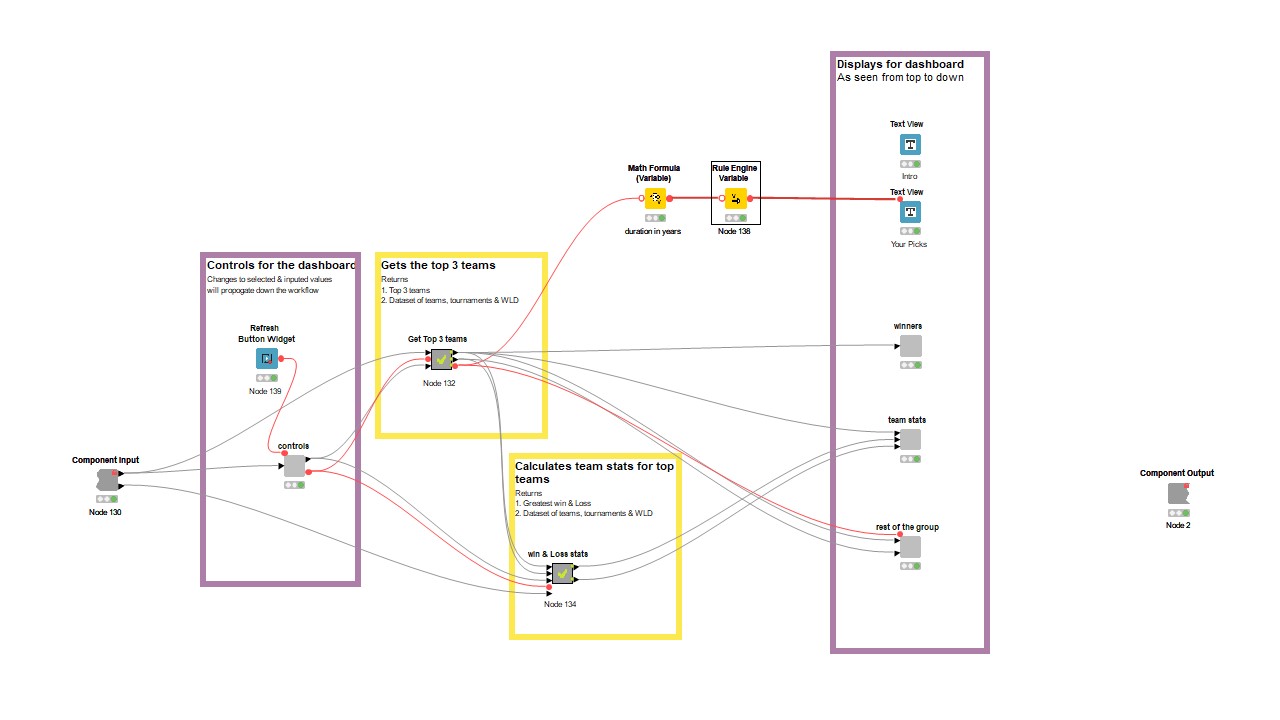
I have developed two types of tournaments. It includes features such as a range filter (by year) and a top N filter. One of my favorite components, the Choropleth Map, makes it easy to visualize trends.
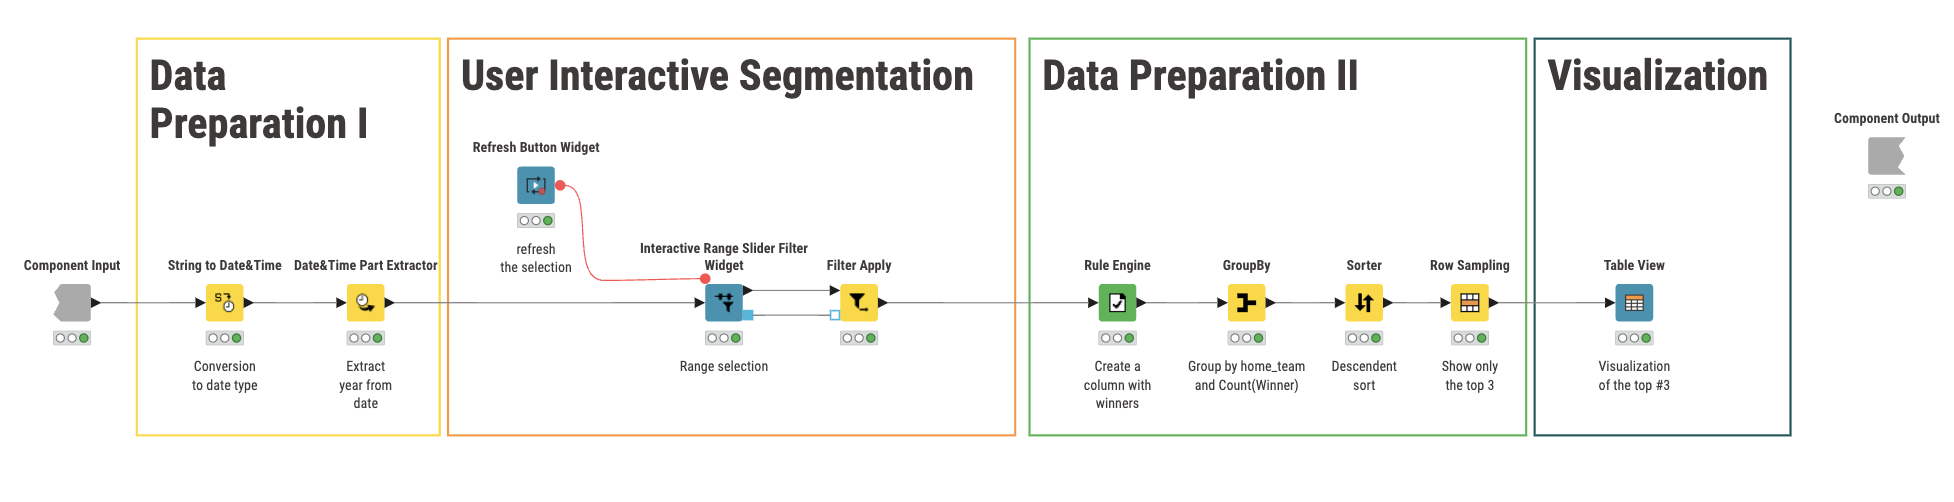
I used a range slider to select the year range and an integer widget to select the number of top teams to display.
The bar chart shows total win, draw and lose.
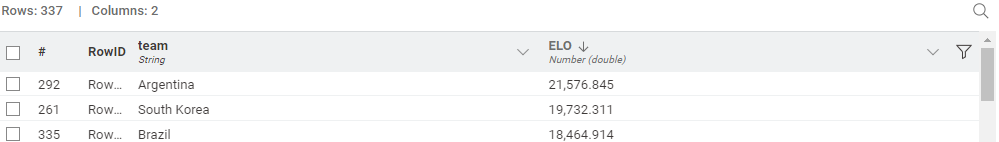
implemented ELO system - all-time ELO turned out useless, however after 3h of execution I at least saved the .table file to local wf data area
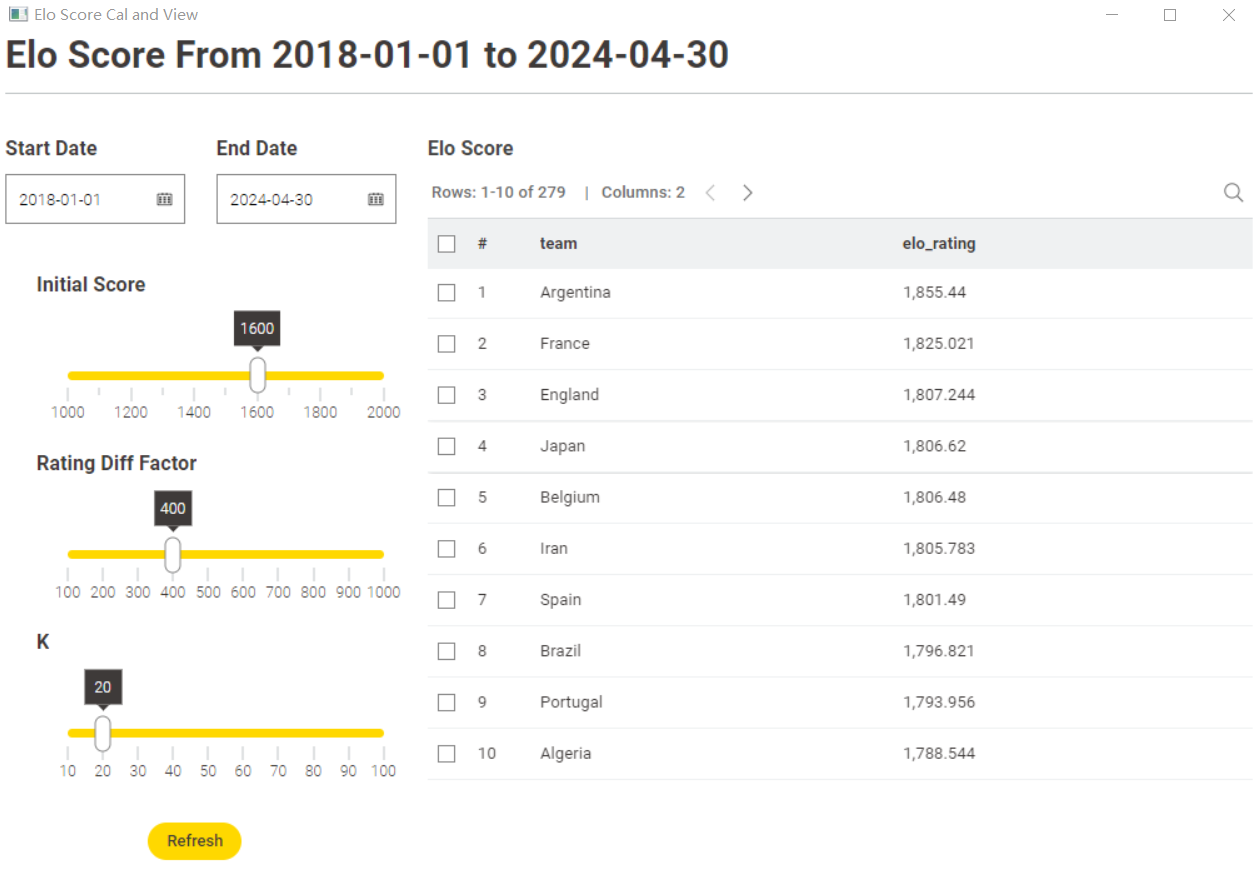
made it interactive - user pics cut of date and number of years to go backwards in time as well as the competitions to include
ELO is calculated for the selected timeframe / competitions - in the first match every team starts with ELO = 1000
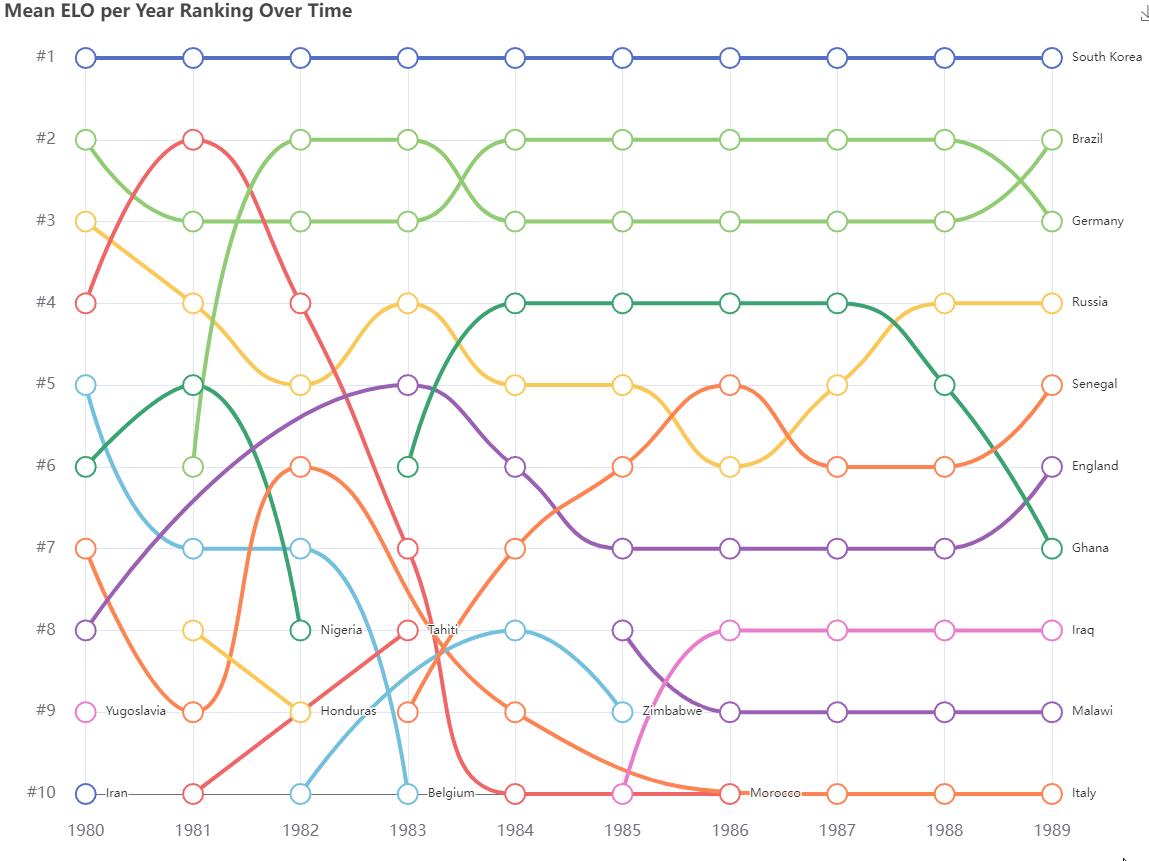
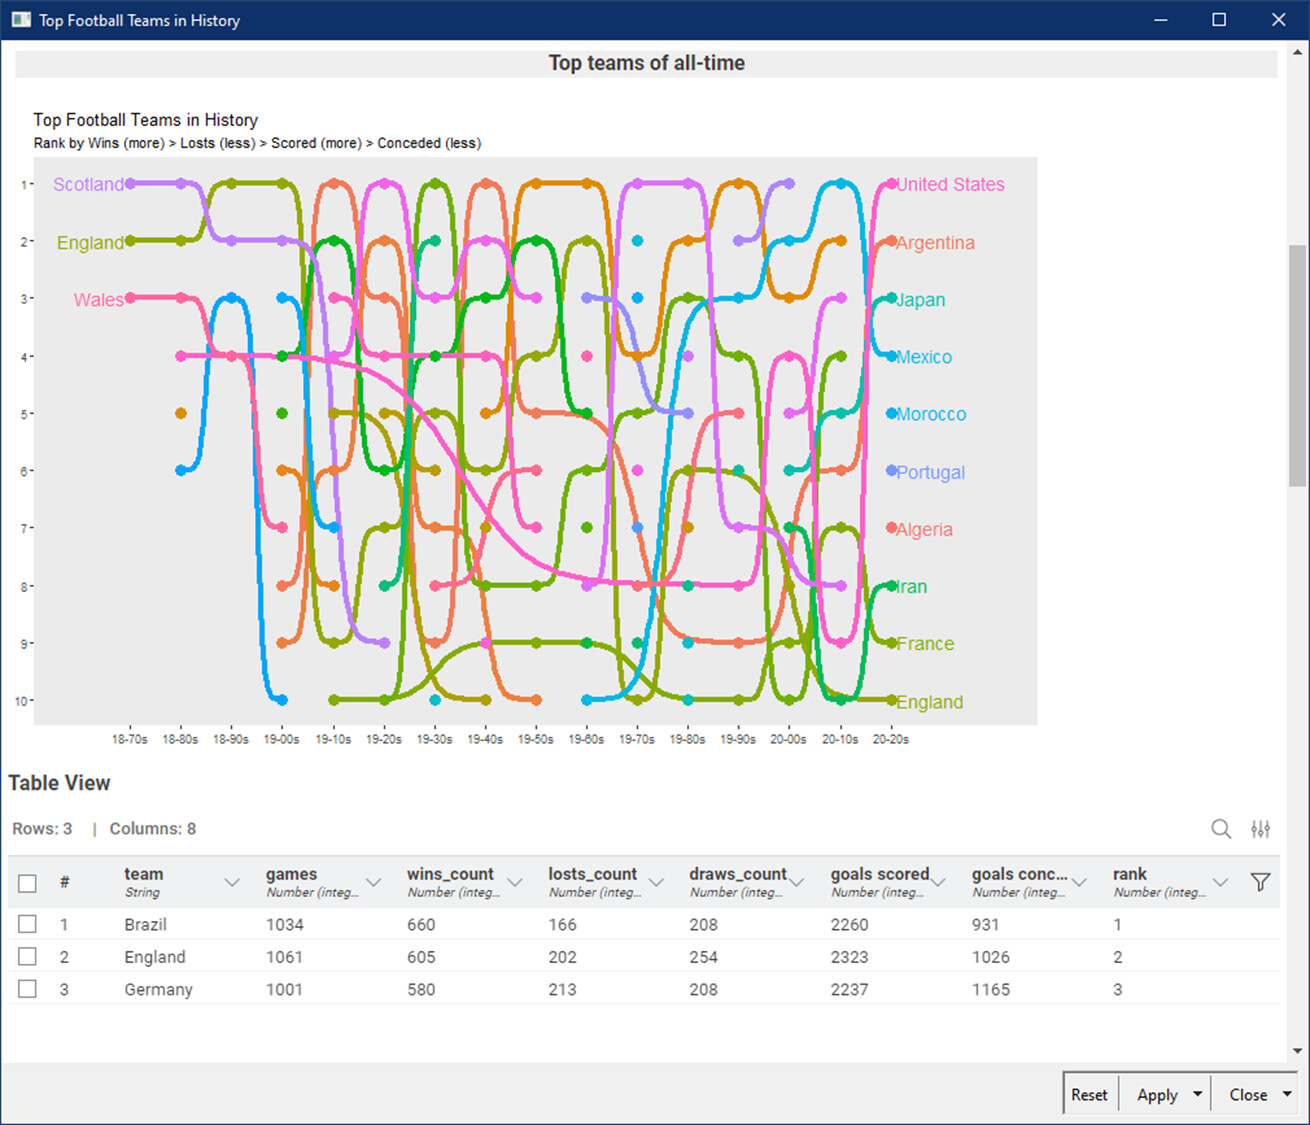
Top 10 by average ranking for each year shown in rank bump chart
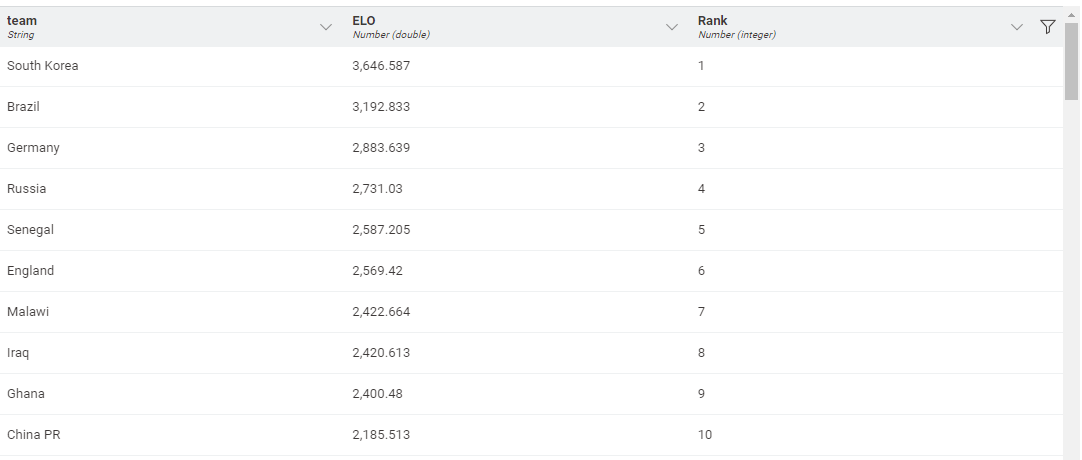
absolute ranking over full timeframe shown in Table View
full Match history and ELO development shown in different Table View
I think this one derailed a little bit for me :D. This tends to happen when sports data is involved…
I was trying to work out how to best determine “the best team” whilst also somehow considering the quality of opponents… then it occurred to me… there is something called ELO that is used in matchmaking for multiplayer games (warcraft 3, startcraft 2… and of course… CHESS just to name those that I have touched in the distant past).
It actually was not too difficult to find a source for ELO algorithms and to implement it - I though started to get concerned a little when I realised that every row needed to be processed individually inside a recursive loop as the new ELO after a match needed to be considered in the next matches ELO calculation… 46k rows… can’t take too long right? It looked ok to start with however after a few hours of running when hitting the high 30ks the end seemed near however processing slowed down more and more…
I then realised that KNIME was running on 2k of RAM max so I cancelled, set it to 16gb and started again… three hours later it was done… and the outcome was gibberish as ELO doesn’t work very well over this long timeframe once ELO differences between teams are large.
Given the computational effort my poor computer put into it I saved the data regardless and moved on to building something that makes sense on top of the algo so:
To limit the rows to be processed, there are widgets to pick a cut of date (no matches after this date to be considered) and a full number of years to go backwards from that date (no games earlier than the calculated date are considered). Also the competitions to be included can now be selected via widget.
So despite the all-time calculation definitely not working out I wanted to share the results here:
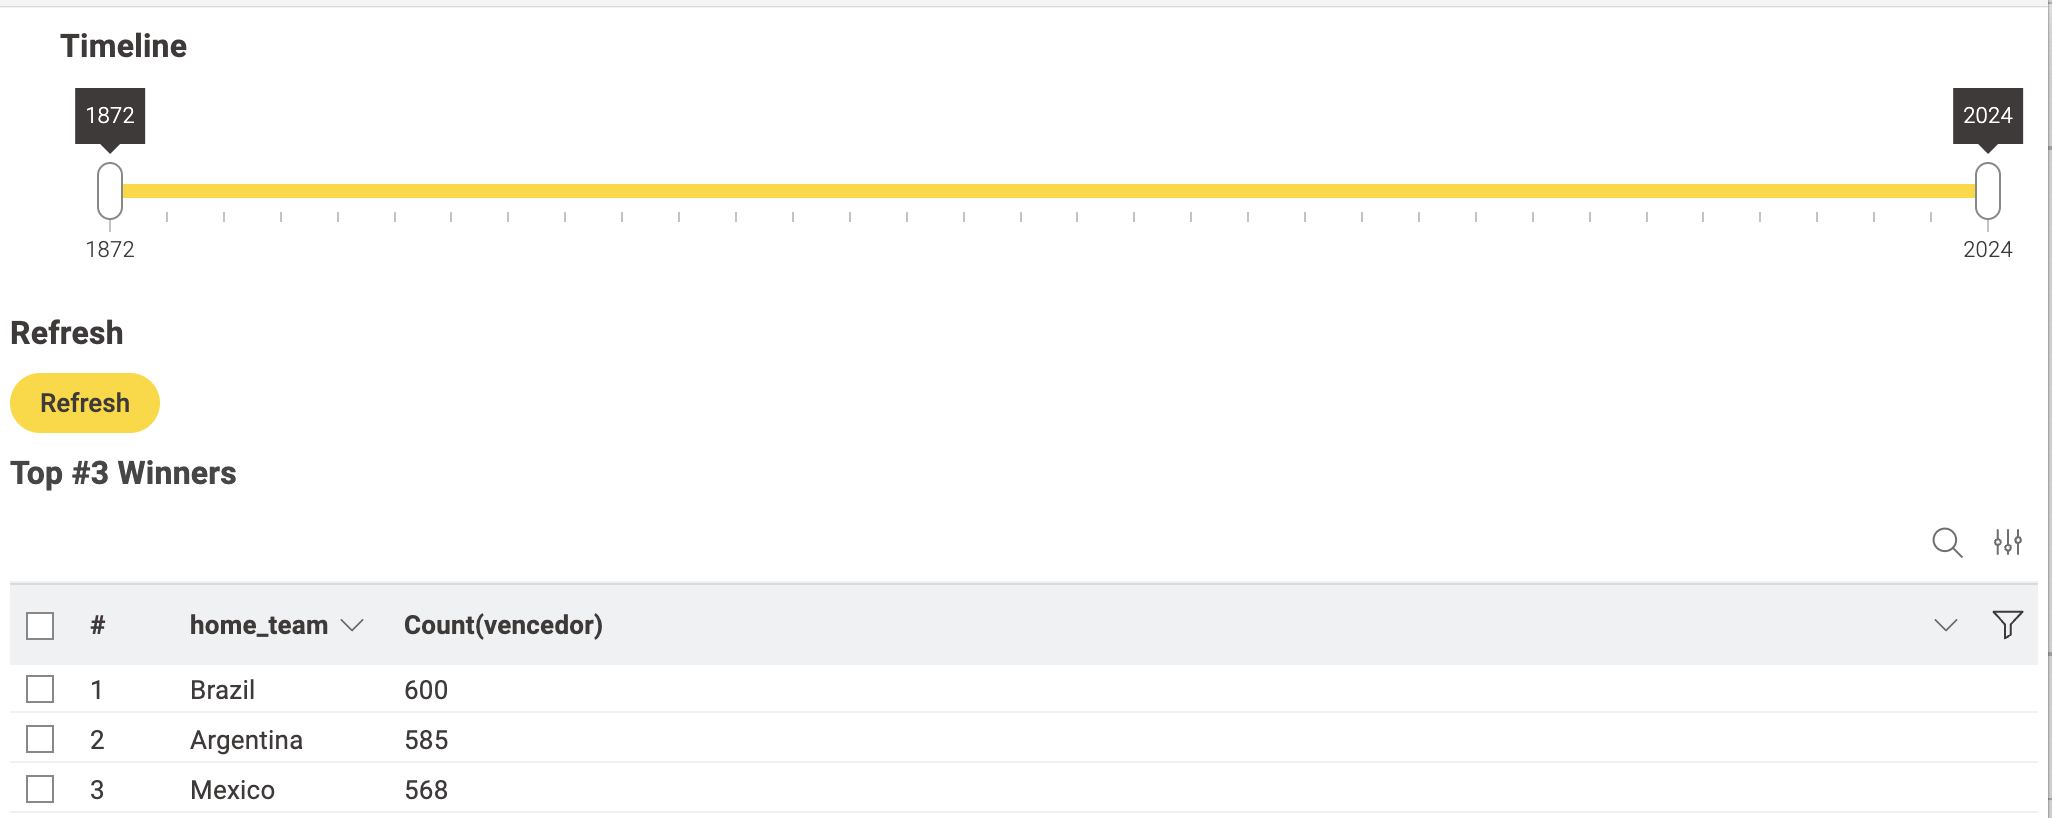
Top 3 teams based on total ELO after processing all 46k games:
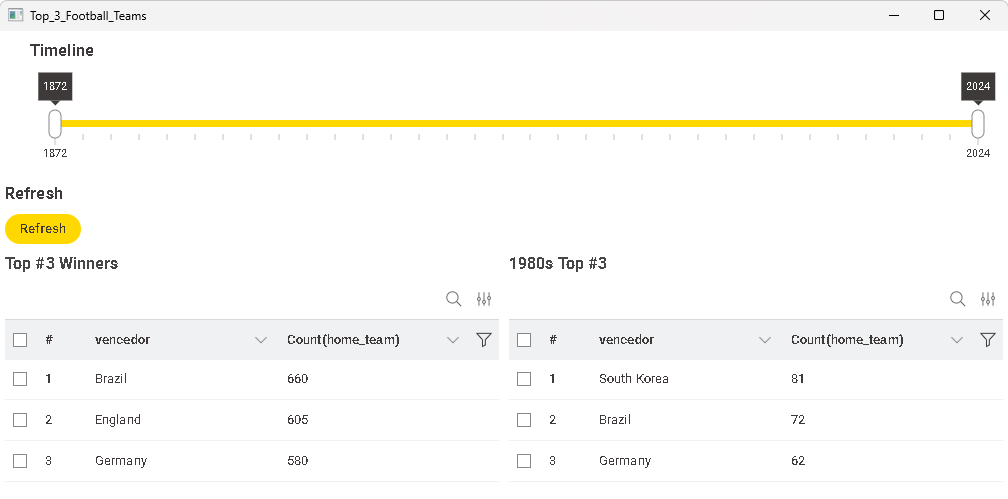
I feel like there are a lot of complicated solutions from everyone these days, so I went back to the beginner’s mood and created an application with a simple table view.
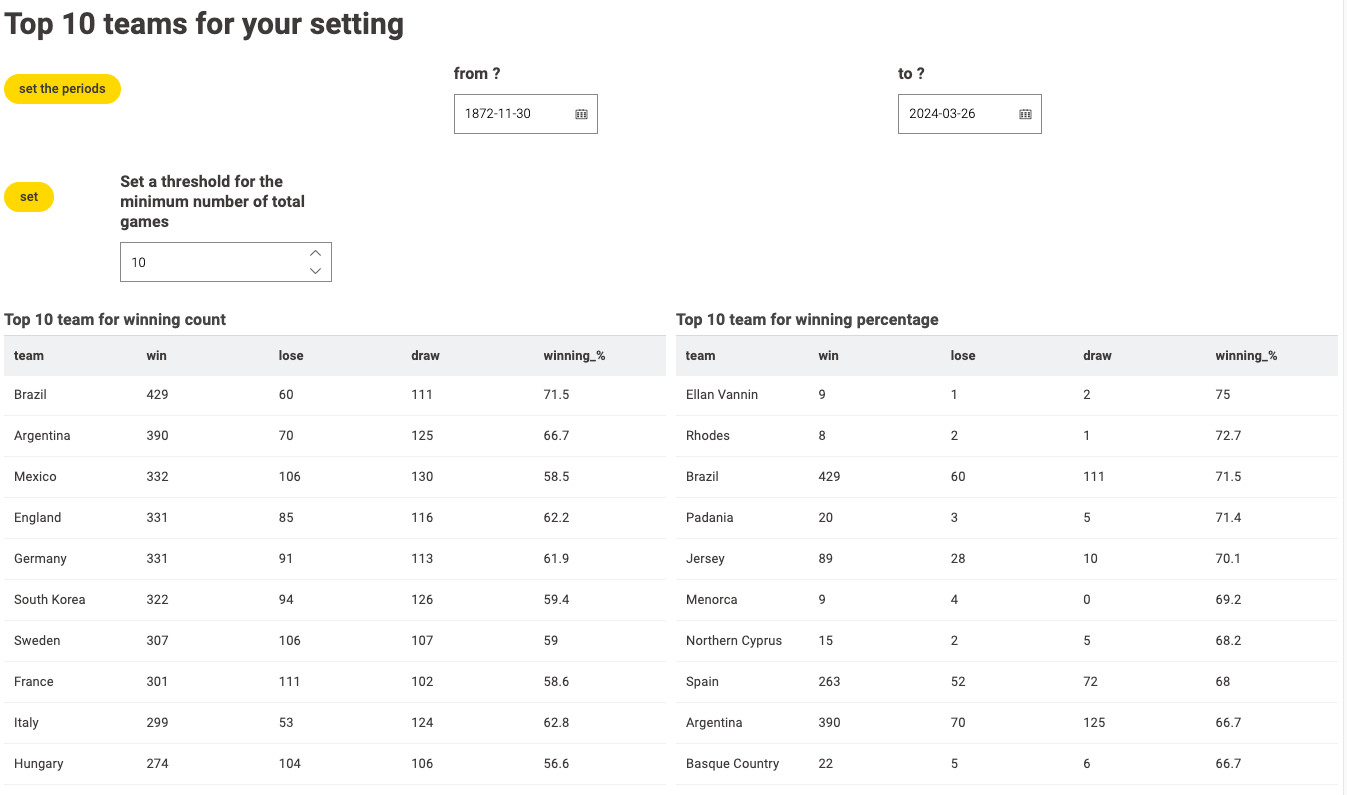
The challenge asked us to show the top 3, but I’ve expanded it and set it up to display the top 10. The upper table lists the teams by number of wins and winning percentage from the 1980s, the bottom one allows the user to set the time period for the tally using the Date&Time widget which can show calendar.
Hi everyone,
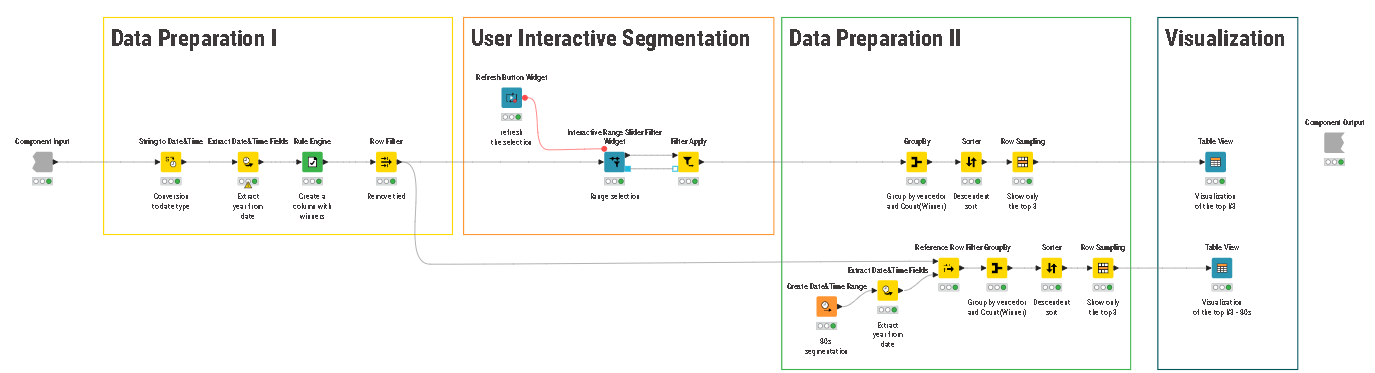
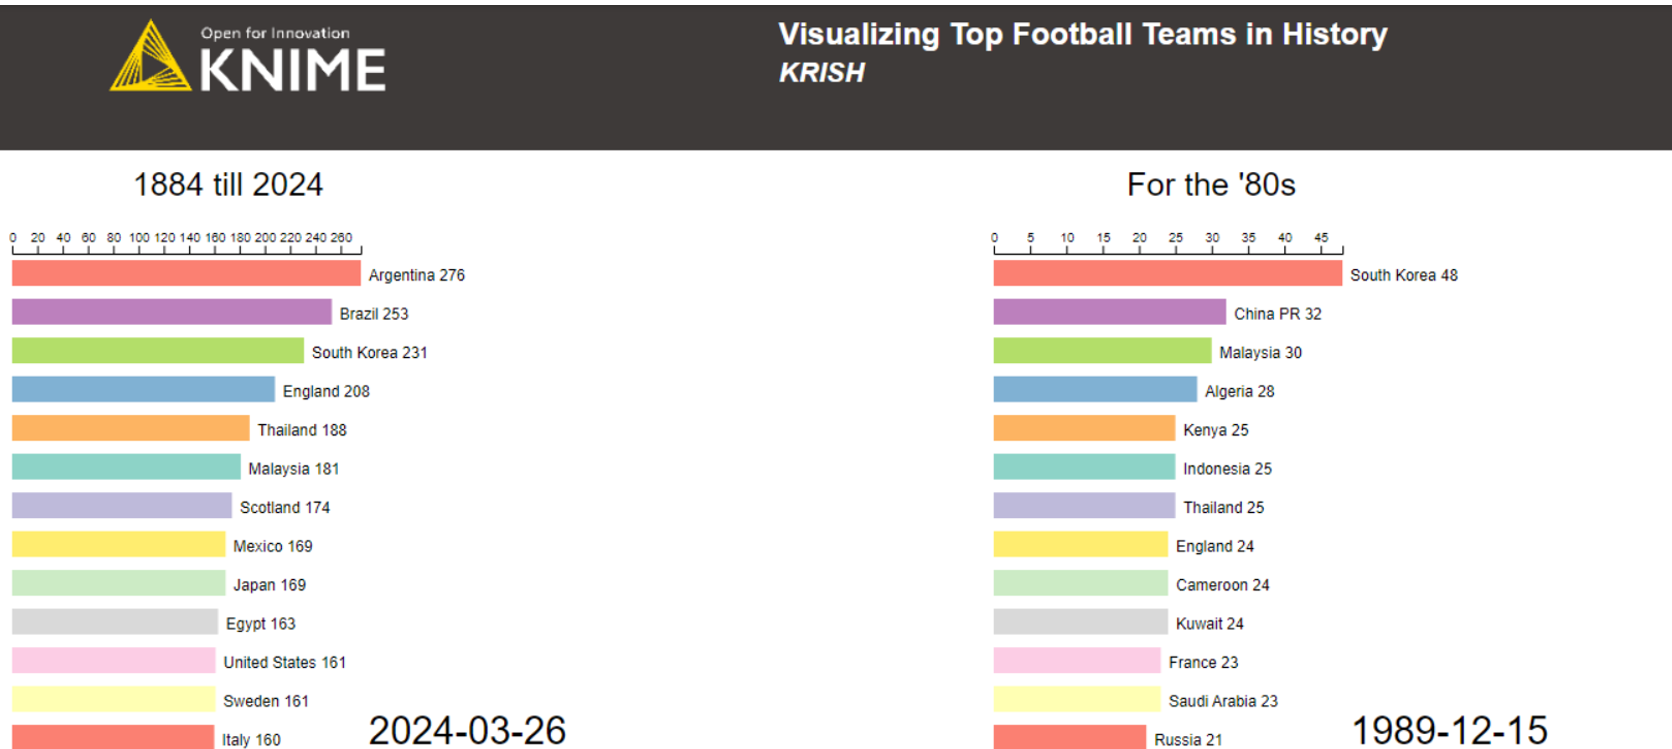
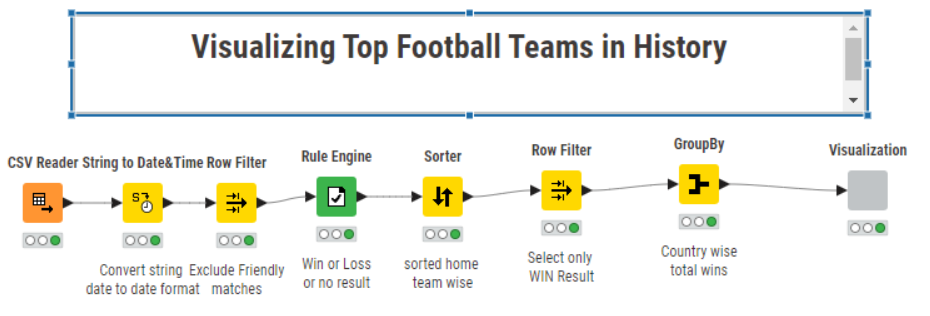
Years were converted to decades using string manipulation to facilitate selection from a drop-down list. I’m not very familiar with soccer, so… the median of annual number of matches and participating countries in each tournament over the entire period were calculated to estimate their importance and scale. Total victories were calculated (1 point per win, 0.5 per draw) and displayed in a bar chart with the top three highlighted in red.
I have implemented another version using the Elo algorithm.
This algorithm is a simplified version of FIFA’s “SUM” algorithm, equivalent to an Elo like algorithm.Mainly simplified the setting of K value (I value), without taking different K values according to the competition category, but unifying them into one K value.
FIFA “SUM” algorithm:
The workflow implementation referred to @ Dennis Ganzaroli’s article:
There may be differences in ranking compared to FIFA, so different K values may need to be taken based on the category of the competition. But this involves certain professional knowledge, so it has not been further refined.
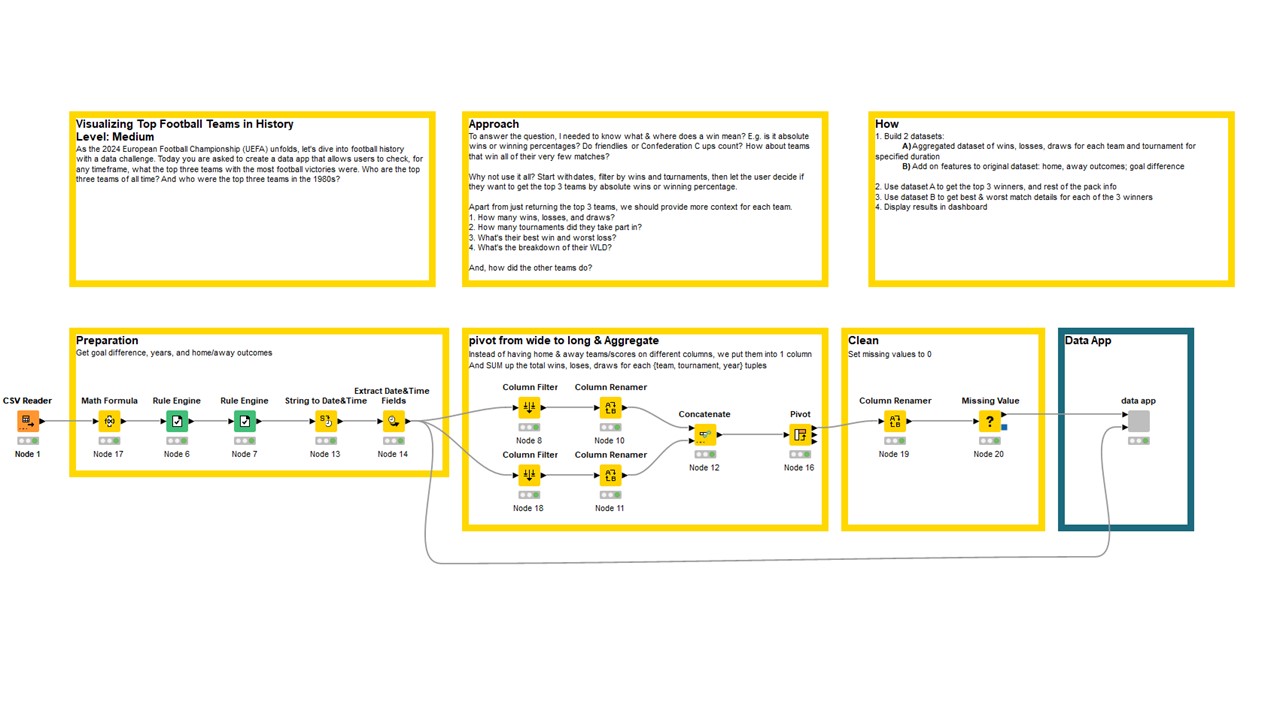
Approach
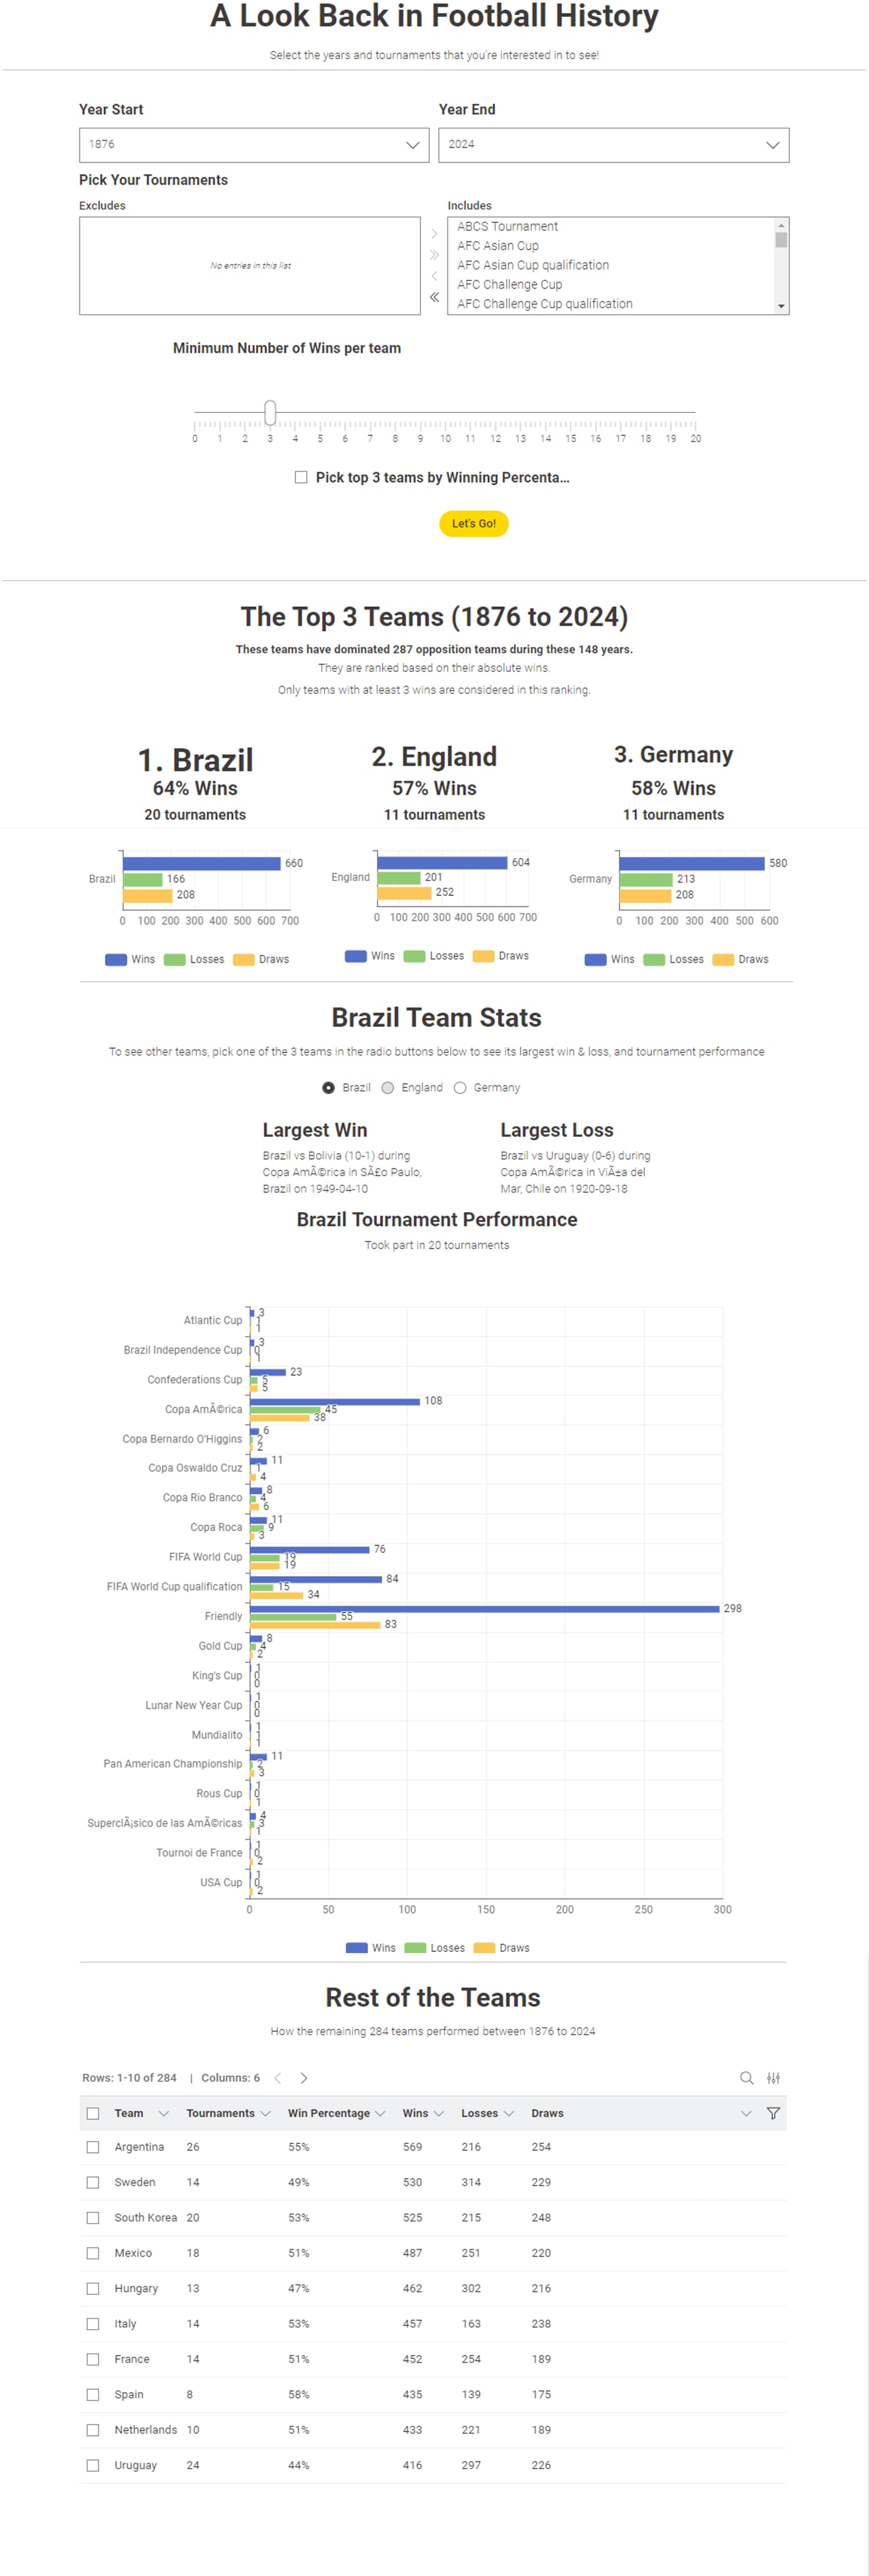
To answer the question, I needed to know what & where does a win mean? E.g. is it absolute wins or winning percentages? Do friendlies or Confederation Cups count? How about teams that win all of their very few matches?
Why not use it all? Start with dates, filter by wins and tournaments, then let the user decide if they want to get the top 3 teams by absolute wins or winning percentage.
Apart from just returning the top 3 teams, we should provide more context for each team.
How many wins, losses, and draws?
How many tournaments did they take part in?
What’s their best win and worst loss?
What’s the breakdown of their WLD?
And, how did the other teams do?
How
Build 2 datasets:
A) Aggregated dataset of wins, losses, draws for each team and tournament for specified duration
B) Add on features to original dataset: home, away outcomes; goal difference
Use dataset A to get the top 3 winners, and rest of the pack info
Use dataset B to get best & worst match details for each of the 3 winners