@rolandnemeth
My apologies, I did not see this question earlier. Hope the following is helpful.
The KNIME Parameter Optimisation nodes are targetted on optimisation problems where algorithms generate an error/loss function which needs to be optimised. These algorithms typically generate a convex or concave manifold, so the optimiser is able to use gradient descent type algorithms to improve the efficiency of the optimisation problem. The node is not exclusively gradient descent style, it includes random sampling, but does indicate what it is trying to do. An example would be fitting a linear regression line where the parameters a, b need to be estimated for the function y = ax + b given as set of known data points (xi, yi).
From what you have described you have a combinatorics problem, which is selecting the best option from all the possible permutations of workers and tasks. This is a big topic which can be split in two: The brute force method, which is to determine all the permutations, calculate the result and rank them from best to worst; and the approximate method: if you have a particular problem there may be an algorithm which gets you close to the answer for much lower processing cost, however, may not guarantee the best answer (you will need to do some research for your specific problem to see if it has been addressed).
I’ve outlined the brute force method below using KNIME nodes. The workflow can be downloaded from the following embedded link.
Combinatorics 2013-01-30.knwf (53.1 KB)
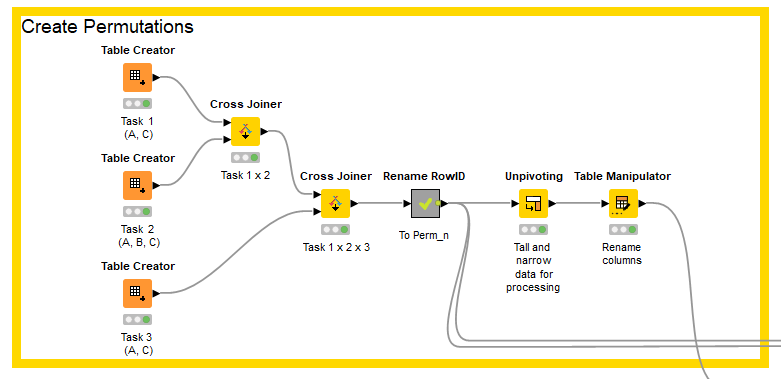
Create permutations
The first task is to create all the permutations of workers and tasks. This is achieved by creating three tables, one for each task. Each table has one string column with the name of the task, and permissible workers listed in the rows of the column. So task one has a row with A and one with C; task two as rows with A, B, C.
The cross-joiner node creates combination rows taking each row from table one and each row from table two and joining them. So by applying two cross-joiners to each of the two tables we end up with one table with three columns (task_1, task_2, task_3) and all the permutations of workers in the rows.
I then created a label for each permutation and used it as the RowID. I then unpivoted the table so that there is a list of permutation, worker, task ready for calculating the hours spent processing the task by each worker.
Calculate each permutation
There are two tables. The first lists the workers and the rate at which they process items per hour; the second lists the tasks and the quantity of items to be processed. These are joined to the permutations table calculated earlier and a maths formula applied to calculate the amount of time each worker spends processing each task. The table is then grouped to calculate the amount of time that each worker is working in total per permutation (they may have been allocated more than one task per permutation).
Rank permutations
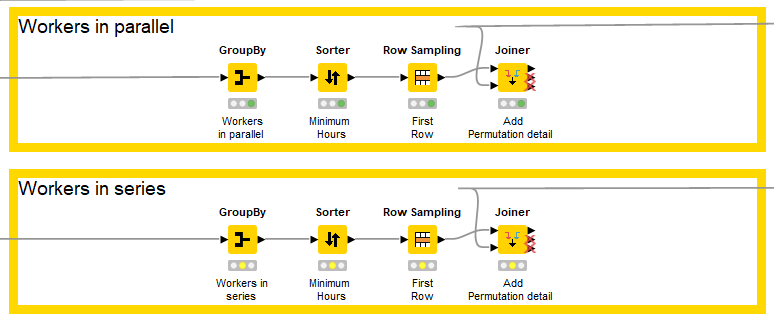
I didn’t know whether workers had to work in series (production line) or could work in parallel, so bifurcated the workflow (though both are similar in principle).
The workers in parallel calculates the amount of time required to complete all tasks by selecting the amount of time taken by longest working worker in each permutation (e.g. if A takes 20 hours and B takes 15 hours the permutation takes 20 hours). The workers in series just sums the amount of time taken by each worker.
The permutations are then sorted based upon the amount of time it will take to complete all tasks. The shorted permutation is selected (first row) and the definition of the permutation is added to the table from the permutations table calculated in the firs step.
This is a very basic example to explain workflow. However, once the principle is understood of creating permutations;, scoring the permutations, ranking and selecting the best, then it should be easy to extend the approach to more complex scenarios.
Hope that helps
DiaAzul
LinkedIn | Medium | GitHub