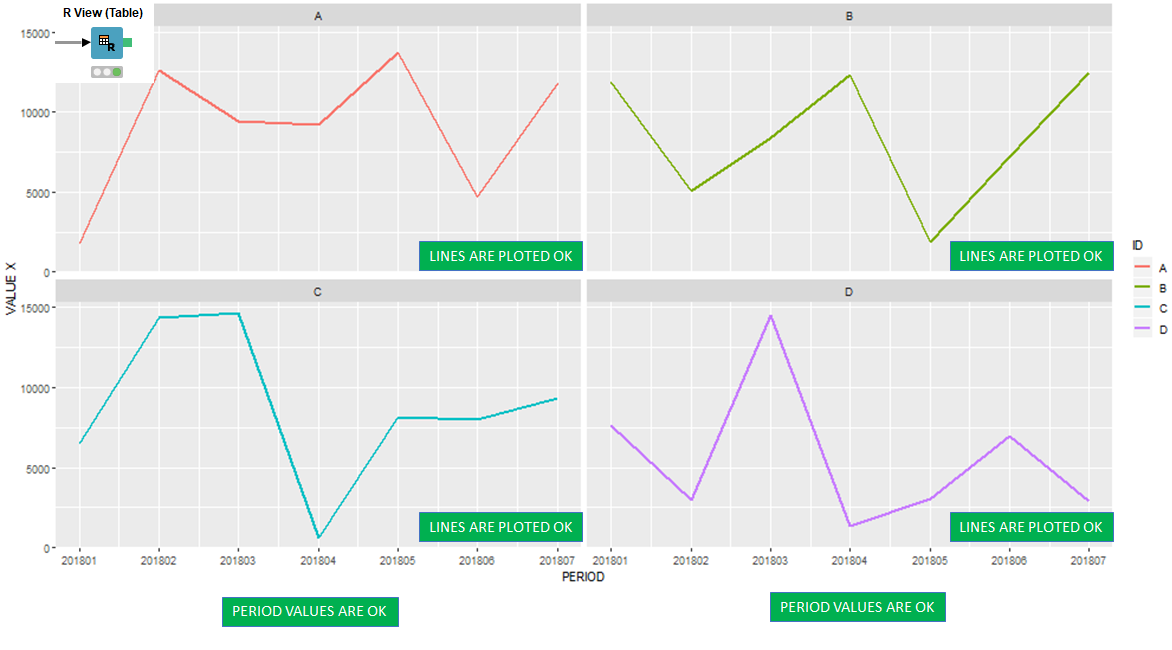
Hi everyone I am trying to make a multiple time series plot in R, but it seems that it depends on the data set, in the following plot I show the ideal plot where the line plot are ok as well the period X label, DATA SET 1
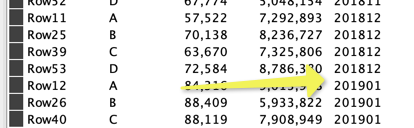
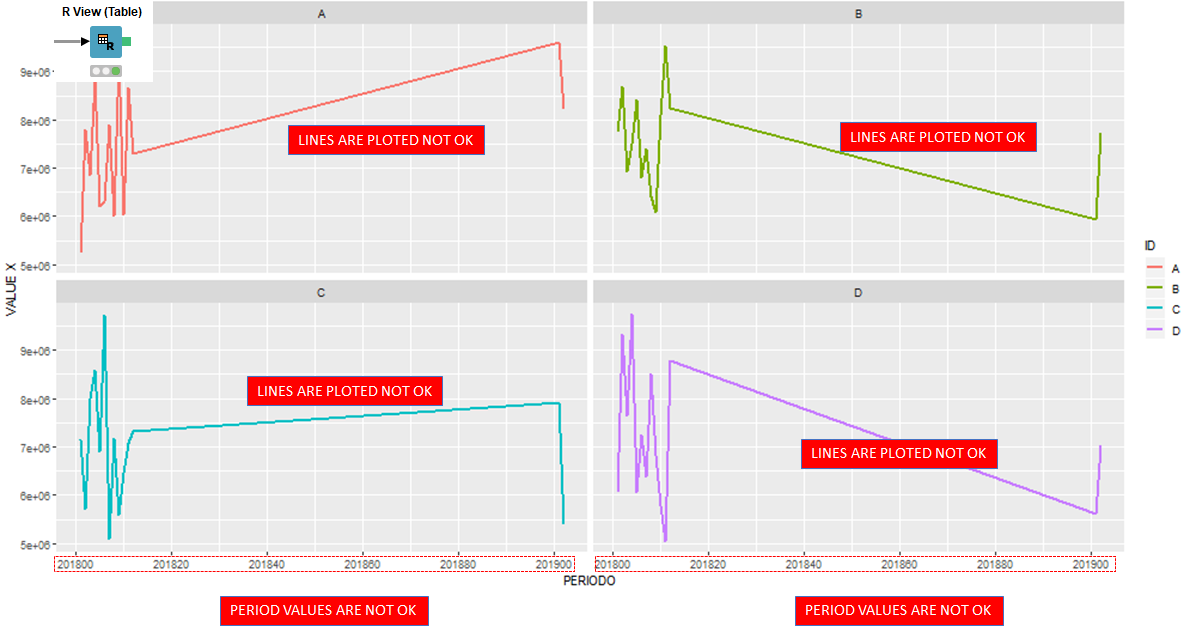
The next plot uses the same code but different data [DATA SET 2] as the above and for some reason does not plot the lines and the period values properly
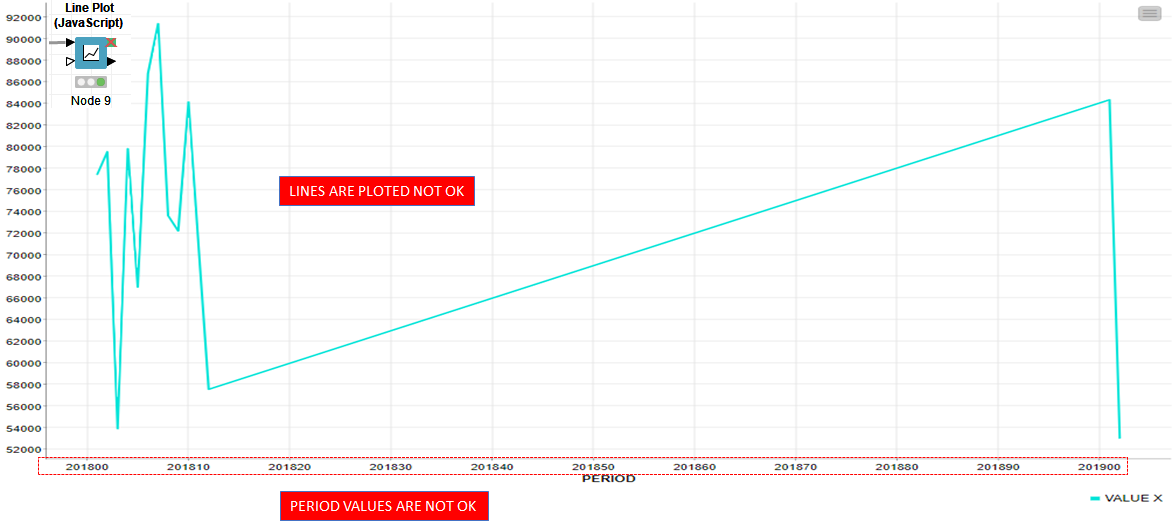
I did the same experiment with the java line plot using a portiion of the same data of the second plot [DATA SET 2] and I had the same problem, as you can see in the following image
The last plot uses the same data of the previous plot [DATA SET 2] or in other words a portion of the data of the second plot and show the line plot properly.

So it seems contradictory that
My purpose is to plot the second plot is a correct way as it resembles more real data than the first plot.
I am attaching the workflow with data
Thanks in advance
Mau
Multiple Time Series.knwf (87.5 KB)