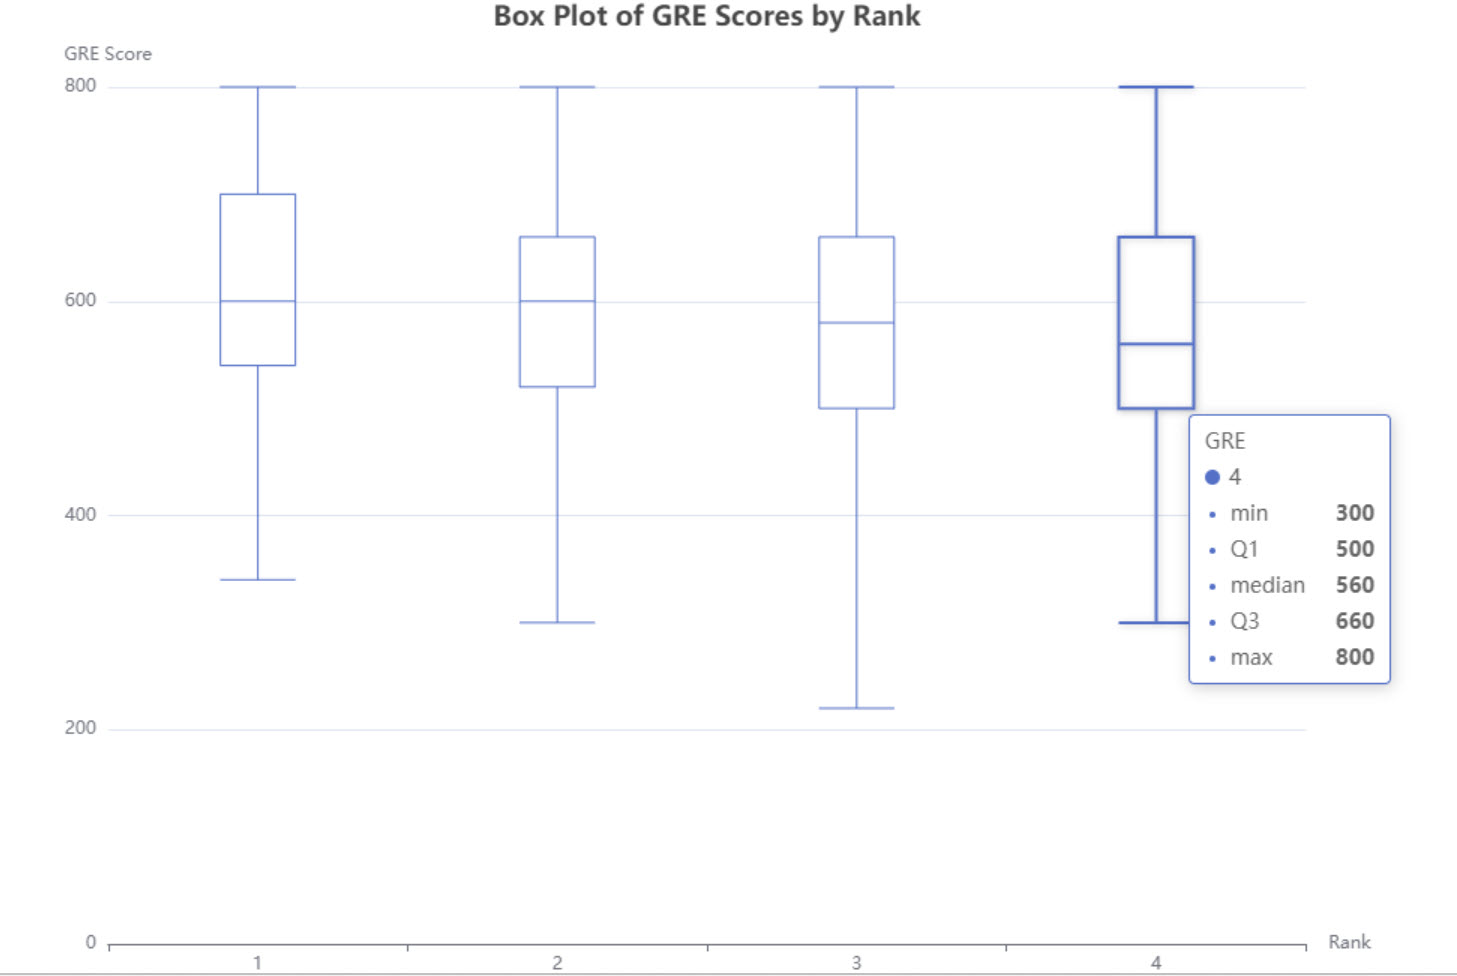
Is there a way to sort a Condition column in the Boxplot node? I have boxplots of distributions of a metric for categories that are identified as letters of the alphabet. When the boxplots are displayed, the horizontal axis shows the categorical variable values in a seemingly random order. I would like to sort them alphabetically along that horizontal axis.
I haven’t tested this, but see if it helps. BTW - which Boxplot node are you using?
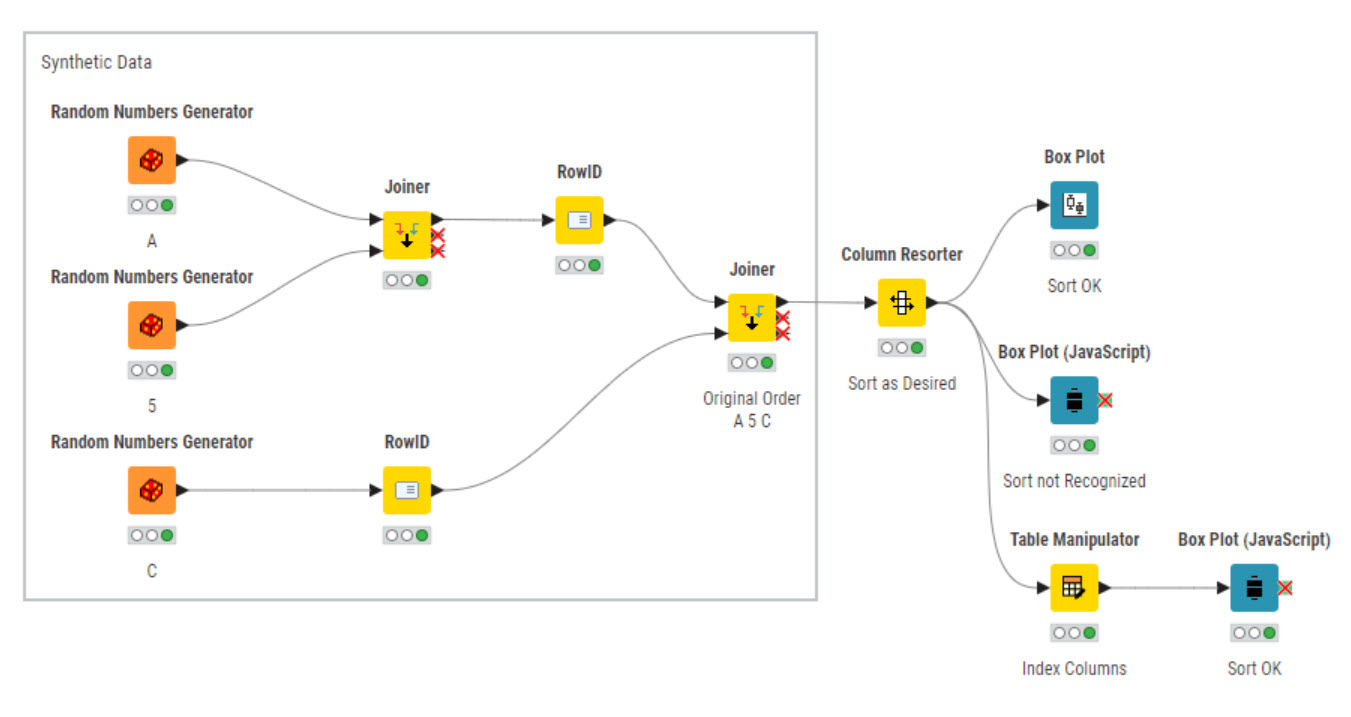
I spent a little time testing a few things. See if this helps. I have no explanation why the box plot nodes work like they do although the sorting problem seems pretty long standing.
Box Plot Test.knwf (155.5 KB)
1 Like
Did the workflow I posted help?
Thanks for the reply, but it’s not exactly what I was looking for. Here is the situation:
Boxplot sorting problem.knwf (104.7 KB)
Try this:
Boxplot sorting problem Javascript.knwf (124.0 KB)
I adapted it from:
I’ve not been able to edit the axis titles. For a reason that’s beyond me, the Javascript throws an error when I edit the titles.
1 Like
I appreciate the effort but the java script does not quite do it. No worries, I’ll just use a python script.
I agree; the Javascript isn’t great. Try this. New echarts node. You can remove the Column Resorter node.
Boxplot sorting problem echarts.knwf (80.7 KB)
1 Like
Did the echarts node work for you?
This topic was automatically closed 90 days after the last reply. New replies are no longer allowed.
In case anyone else finds this topic through search:
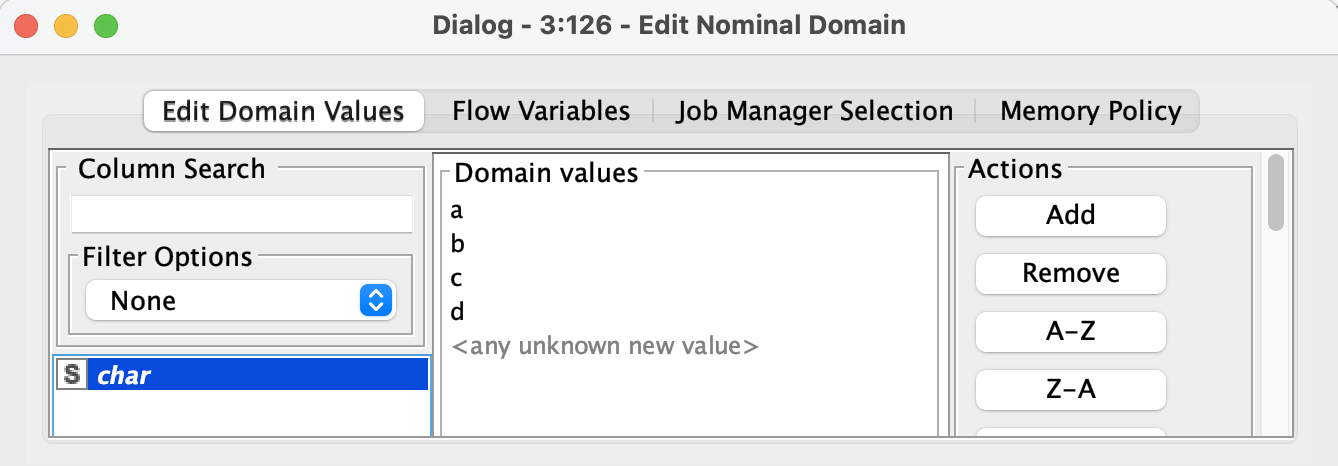
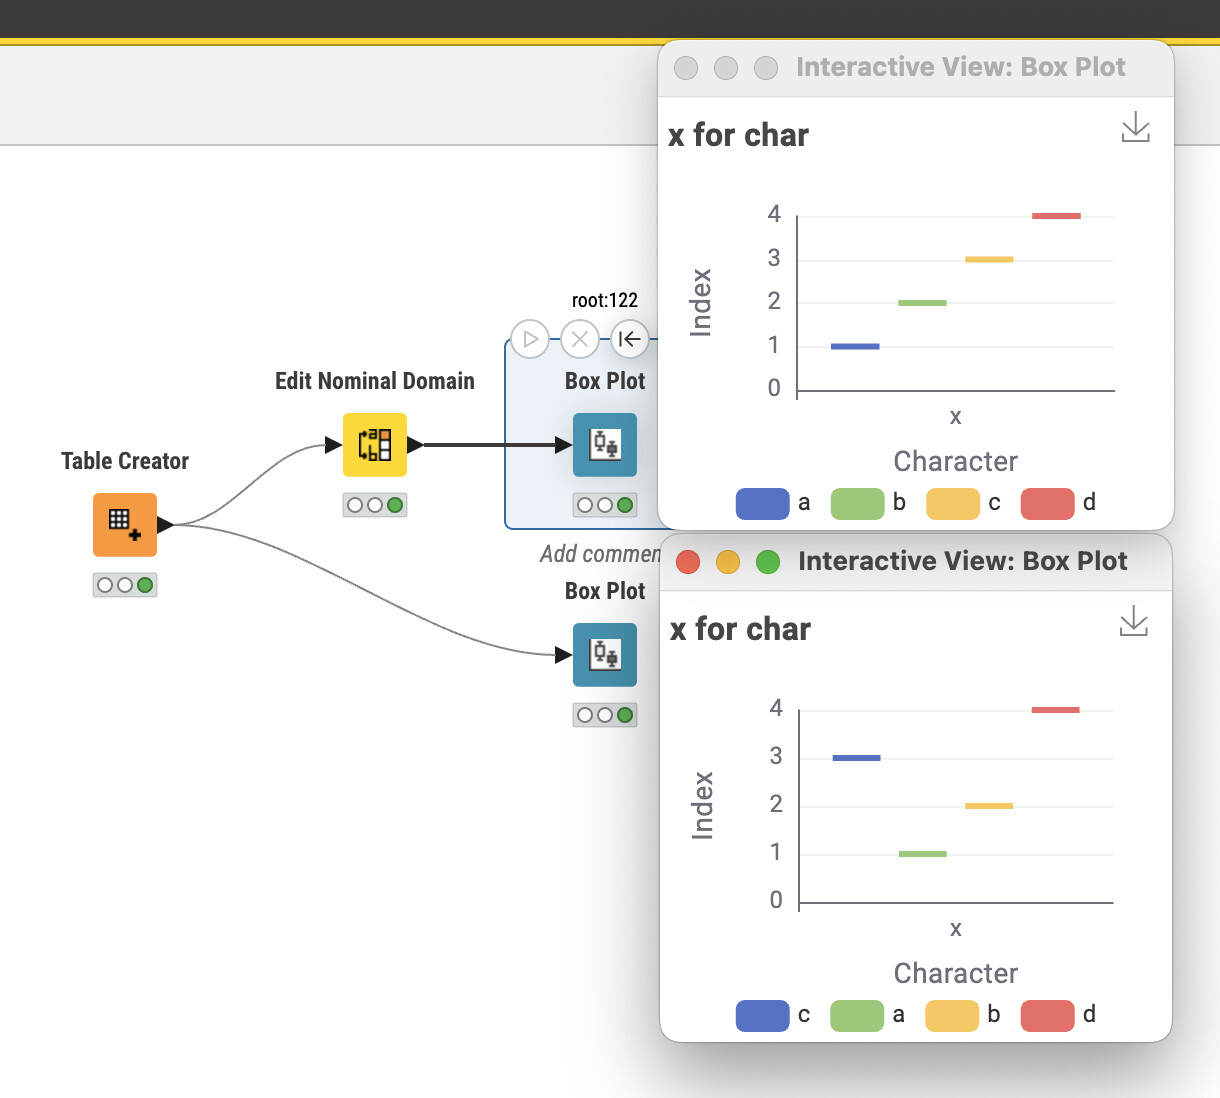
I just stumbled over this issue myself (having tried the Sorter on the category column without success). The team working on the view nodes told me that the order comes from the domain order and is now aware of the usability issue.
So, editing the domain order reorders the boxes:
1 Like