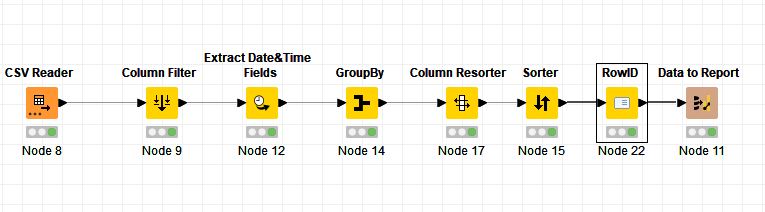
When I arrive to the “Data to report”, everything is in the right order, that’s when the problem starts.
Note that I extracted the month number and the month name without any issue.
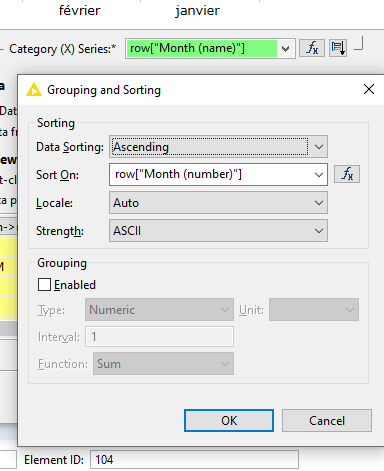
In the bar chart settings, I have:
I display the month name, and sort by the month number
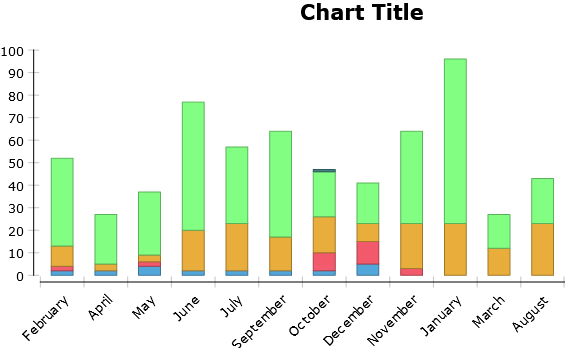
But then I get this:
Note that if I display and sort by the month number, everything is fine
I tried everything I could, and it makes me crazy; so if anyone could help, I’d be grateful.
What’s worse is that I’m sure the solution is very simple.
Unfortunately it did not work.
I already tried a variant of what was proposed in his first solution. Did his exact first solution but still has that strange sort that you can see in the bar graph in my post.
As for his second solution, it seems we are not running the same version and I can’t manage to make it work.
The issue is that I was trying to use the “Optional Y series grouping” in the chart, but I see you are instead creating multiple “series” in Y.
I did the same and it worked.