Spark k-means node execution problem

Hi,

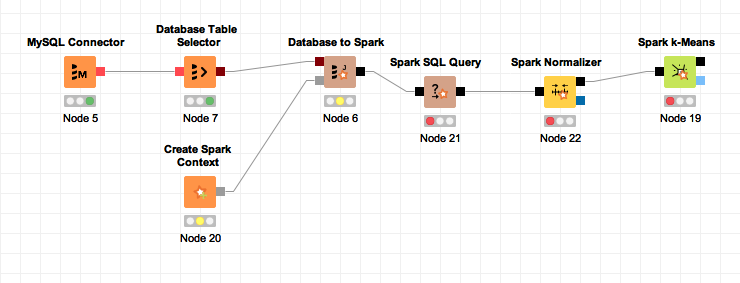
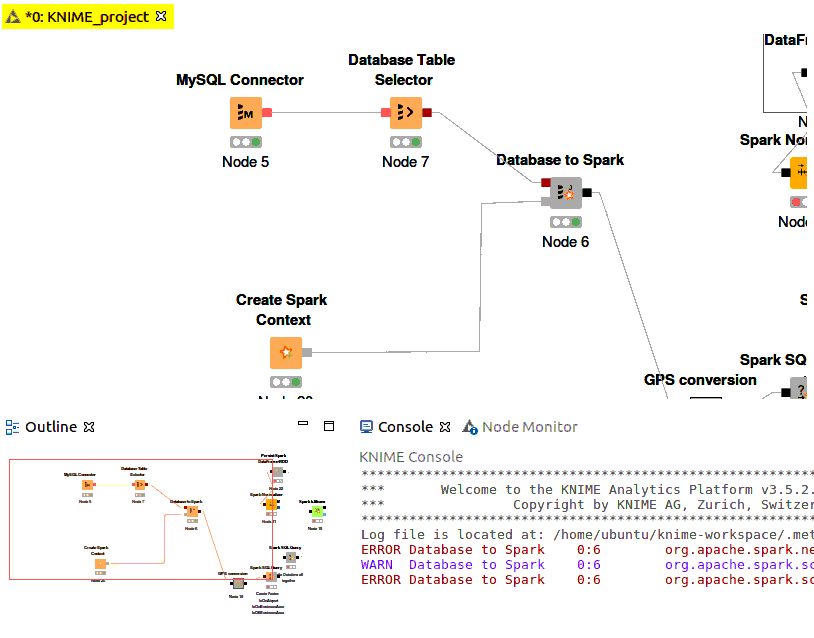
I’m not able to successfully execute the Spark k-means node, and also other kind of nodes like Spark normalizer. After several hours I decided to interrupt the execution of the knime node and analyze a little bit the situation. So, considering my scenario:

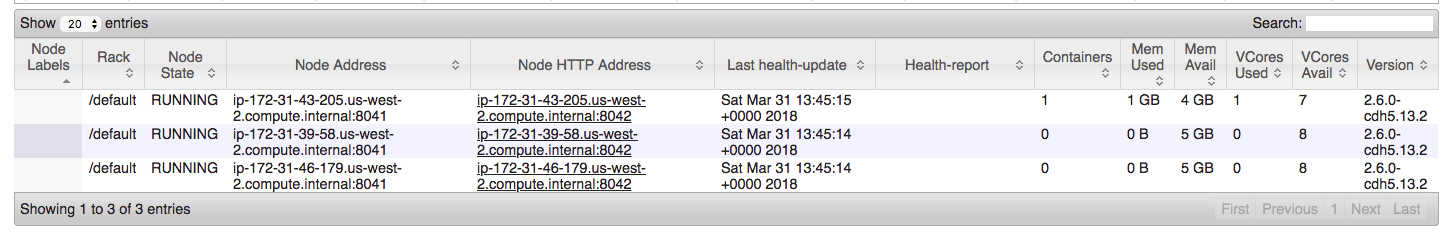
a CDH cluster made of 4 nodes, in which each node has the same specs of a t2.large amazon aws EC2 instance (2 vCPU, 8GB ram). Starting from this point which would be the approximately right execution time considering to pass as spark-job-server the execution of Spark k-means node with a volume of 50mln data (as in my case)?

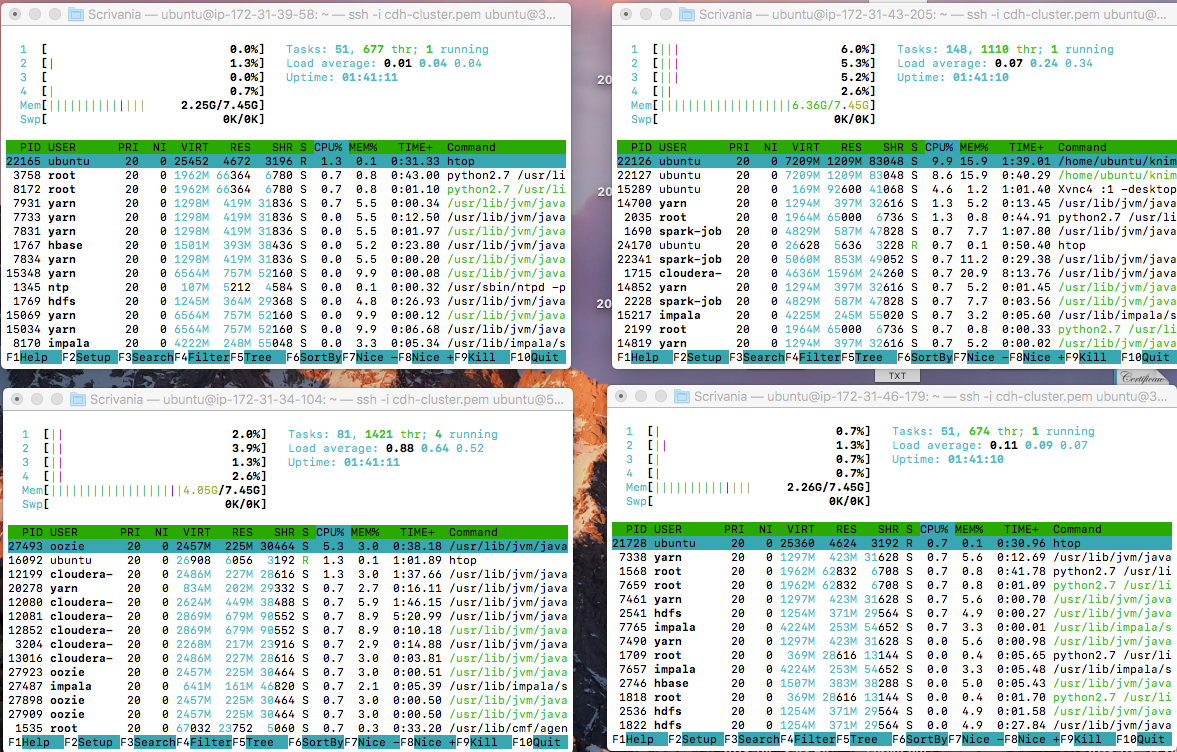
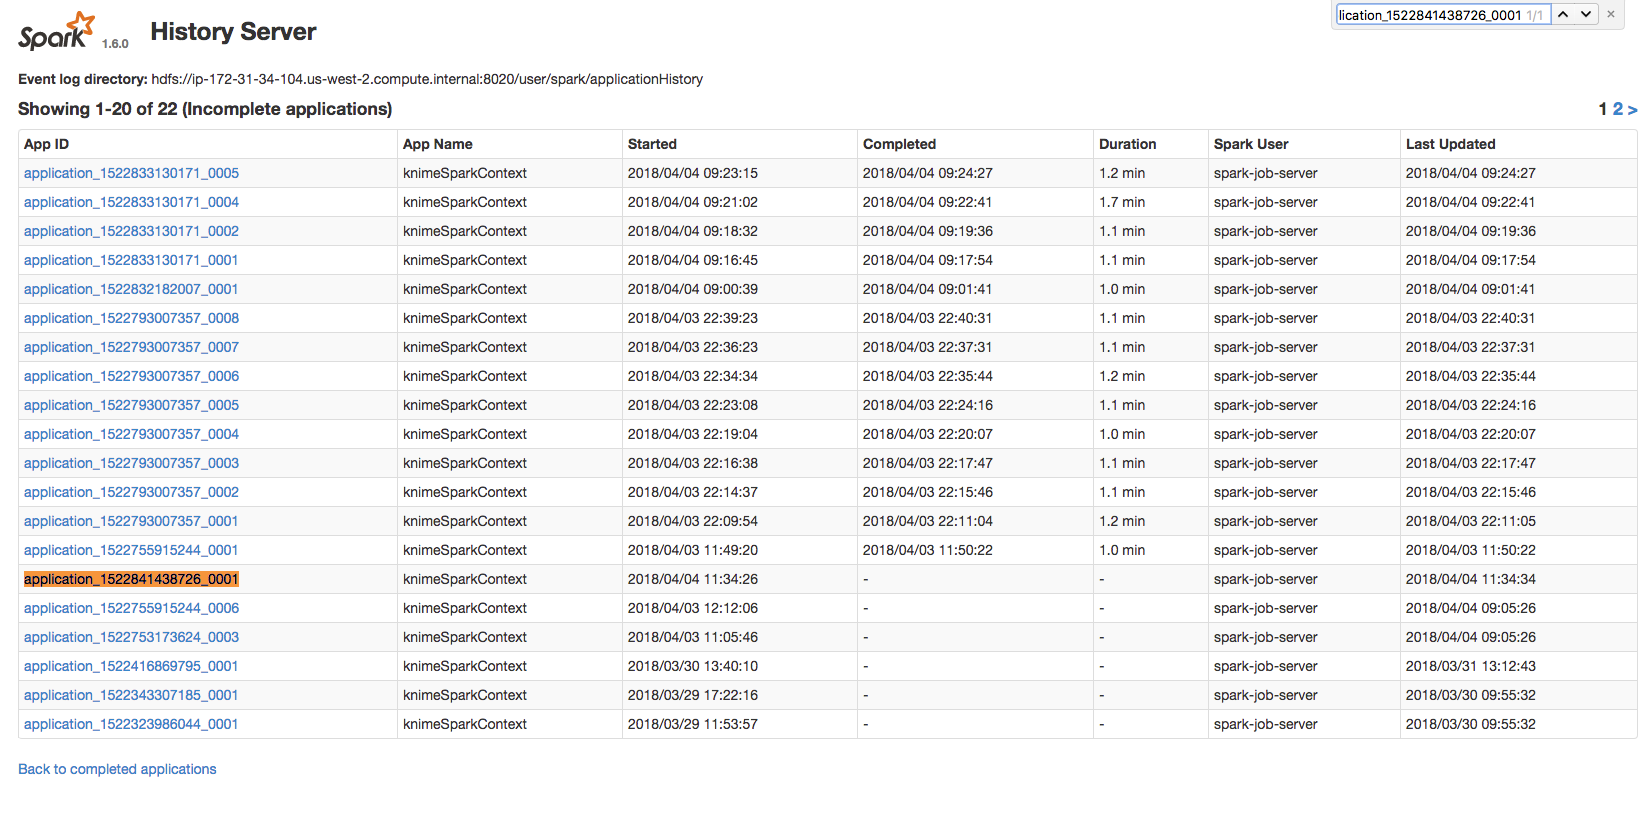
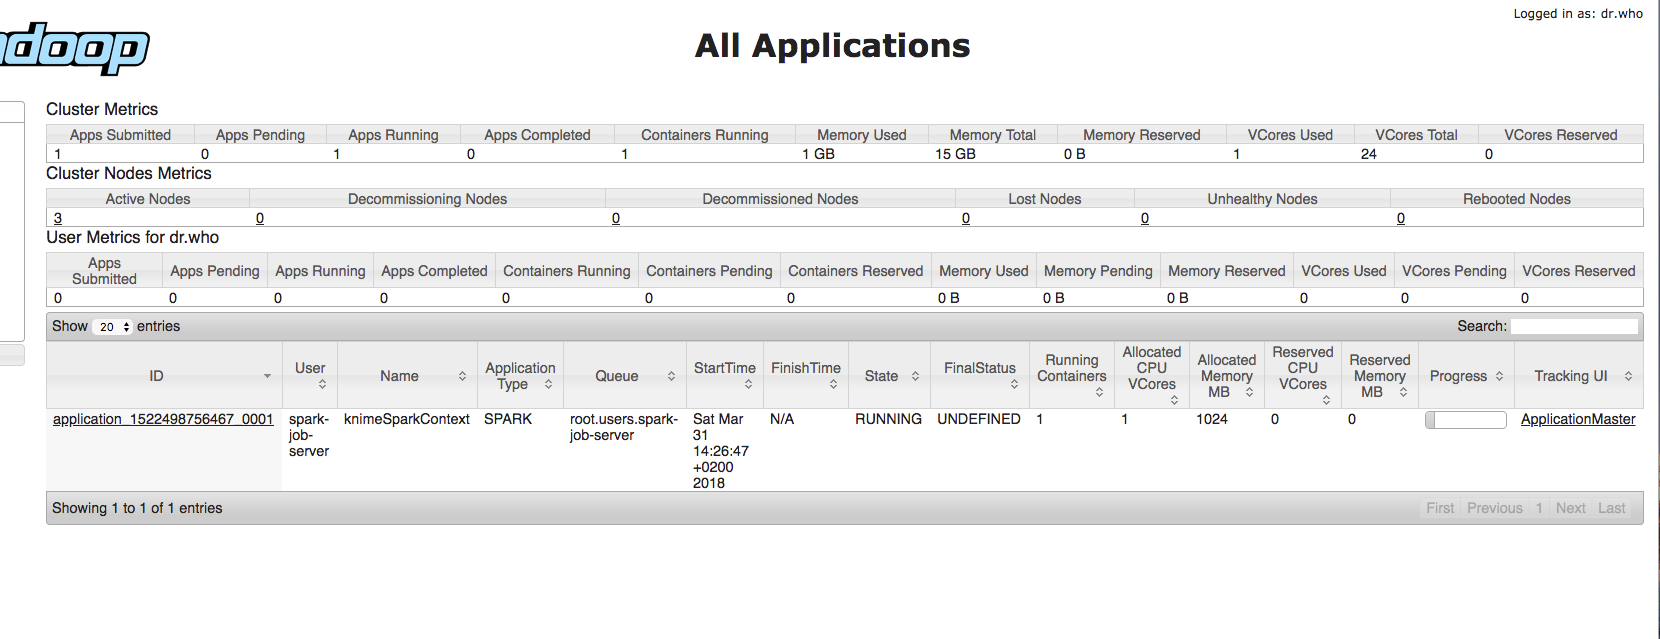
Cause actually using 4 instances for my CDH cluster I was expecting to consume much more memory/cpu resources and considerably reduce the entire execution time. But when I submit the the Spark K-Means Node operation using spark-job-server and YARN the consume of resources is pretty absent (as you can see from HTOP monitoring each machine within the Cluster when I submit this task with YARN):

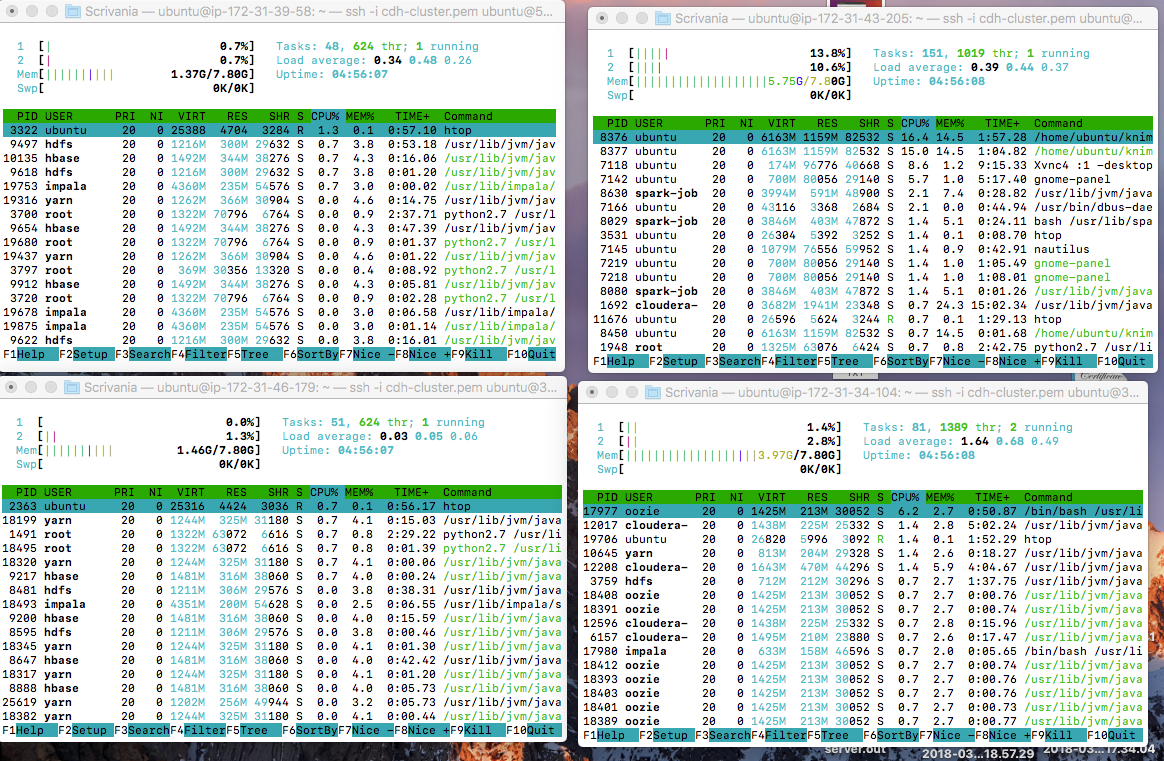
As you can see from the images above, the resources are pretty unused. And it also seems that the task is running over just 1 instance. Here’s my YARN tuning configuration:

  • yarn.nodemanager.resource.cpu-vcores: 8
  • yarn.nodemanager.resource.memory-mb: 5120mb
  • yarn.scheduler.minimum-allocation-vcores: 1
  • yarn-scheduler.maximum-allocation-vcores: 1
  • yarn.scheduler.increment-allocation-vcores: 1
  • yarn.scheduler.minimum-allocation-mb: 1024mb
  • yarn.scheduler.maximum-allocation-mb: 8192mb
  • yarn.scheduler.increment-allocation-mb: 512mb

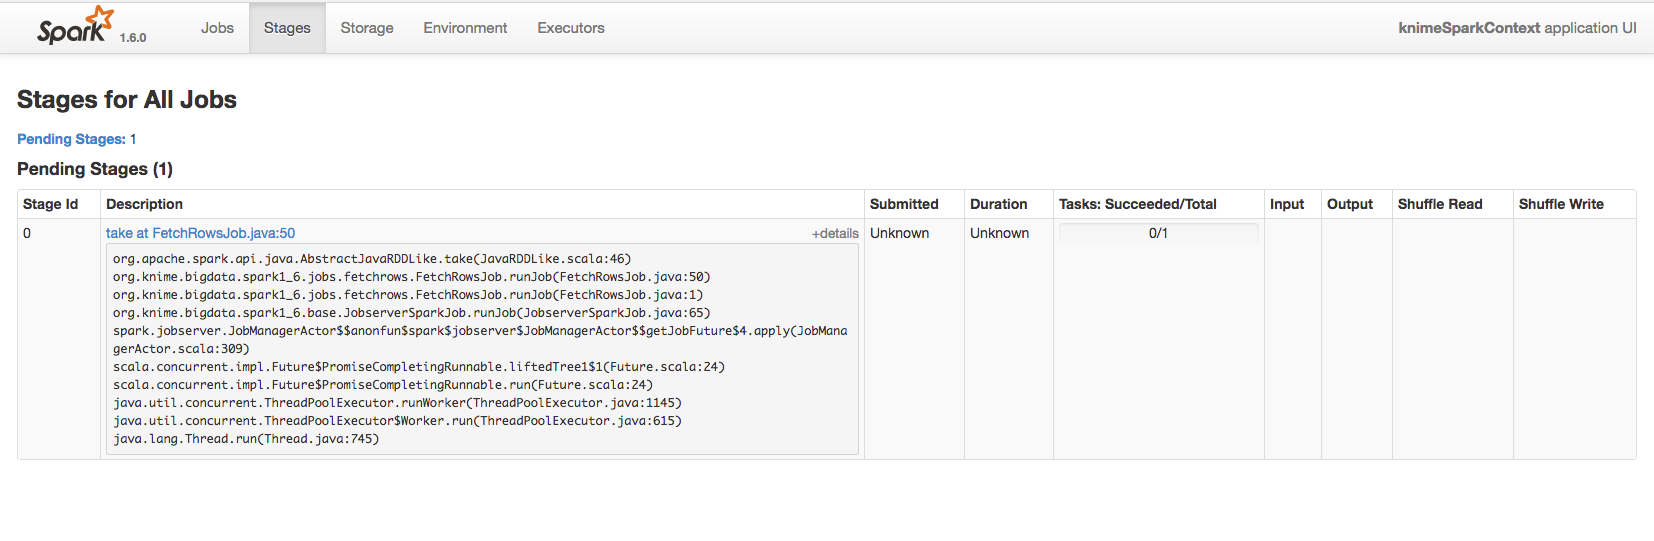
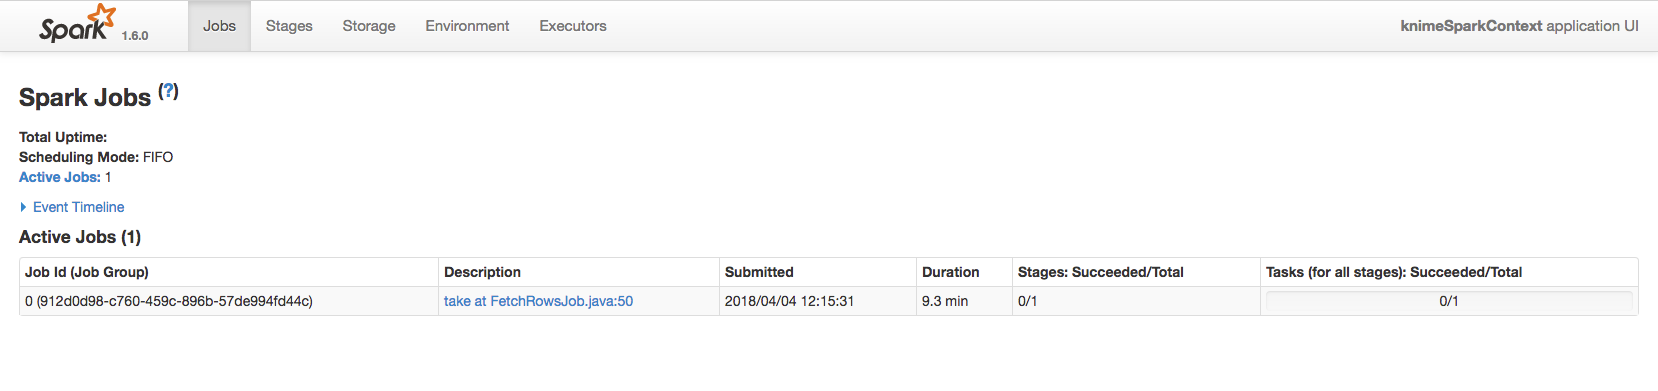
During this period the Spark K-means node still doesn’t complete the task also after much several hours of execution. The same behaviour happens also if I put before the Spark K-means node the Spark normalizer node.

Probably I’m missing something, but I’m pretty sure that someone can clarify me about it. Also because the execution time of a normal K-means takes around 3/4 hours and with Spark nodes I’m expecting to have some tangible improvements as execution time.

Are there maybe any configurations that need to be applied in order to maximize the the use of the resources?

Thanks in advance,
~G

Hi @gujodm

as you correctly noted, Spark is using the “default” resource settings, which need to be tuned for more serious use.

The “Create Spark Context” node has a custom settings text field, into which you can put any Spark configuration settings, which are described here:
https://spark.apache.org/docs/2.2.1/configuration.html#application-properties

The most important settings are:
spark.executor.instances (the number of Spark executors to start; defaults to 1)
spark.executor.memory (the amount of JVM memory per Spark executor; defaults to 1G)
spark.executor.cores (the amount of CPU cores to use per Spark executor; defaults to 1)

For your case this means something like:
spark.executor.instances: 4
spark.executor.cores: 1
spark.executor.memory: 6G

This will give you 4 Spark executors, each of which uses one CPU core and 6G of RAM.

There are however other aspects to consider:

  • How large is your dataset? If Spark cannot completely fit it into executor memory, then parts of it will be read repeatedly (at least once per k-means iteration) from disk which slows things down quite a lot.
  • In which format is your data stored in HDFS? Use ORC or Parquet instead of csv or other text-based formats.

Also, my feeling is that your cluster has (1) too few resources available and (2) resources not optimally allocated. First, I would recommend c5.xlarge instances or better. t2.xlarge is so small, that you are wasting a almost 50% of your resources on the fixed per-node overhead that Hadoop brings (HDFS datanodes, YARN nodemanagers should have at least 1 core and 2-3G of RAM). Making nodes “bigger” lowers the percentage of that fixed overhead. Also “t2” is not very well suited for compute-heavy operations such as machine learning.

Best,
Björn

Hi @bjoern.lohrmann,
Thanks for the reply,

We are talking about around 50mln of data.

Where I can find the format of the data stored in HDFS? Cause Actually I’m doing something like that:

  • connecting to MySQL database and retrieve data
  • load data to Spark rdd
  • perform ETL operation via Spark sql
  • apply clustering operation via k-means

You mean in my current CDH cluster configuration? Should I configure it differently?

But one of my main doubts is about the performance comparison between normal knime nodes and spark nodes. Cause probably I have quite low resources for perform this kind of operations under my actual cluster. But the strange thing is that I would probably have a better execution timing with simple knime table format and just one machine (we are still about much several hours).

Do you think that is it not possible to tune the actual resources that I have in order to execute this kind of operation in reasonable time?

~G

Hi @gujodm

Where I can find the format of the data stored in HDFS? Cause Actually I’m doing something like that:
connecting to MySQL database and retrieve data
load data to Spark rdd
perform ETL operation via Spark sql
apply clustering operation via k-means

I see. This means data is never stored in HDFS at all, but queried on-the-fly from MySQL.

The DataFrame/RDD that comes out of the Database to Spark node has by default only one partition. Spark parallelizes using partitions. If you only have one partition in your Spark data, you only get a maximum parallelism of one (-> no parallelism).
Because of that, in the “Database to Spark” node you can select a partitioning column and a desired number of partitions. With 50mn rows I would go for 200 or more partitions. It is usually better to have more and hence smaller partitions.

Also, you still have to tell Spark to actually make use of available cluster resources with the settings in my last post.

You mean in my current CDH cluster configuration? Should I configure it differently?

But one of my main doubts is about the performance comparison between normal knime nodes and spark nodes. Cause probably I have quite low resources for perform this kind of operations under my actual cluster. But the strange thing is that I would probably have a better execution timing with simple knime table format and just one machine (we are still about much several hours).

No, I am talking about the EC2 instance sizes. As I wrote above, the Hadoop services themselves have a fixed overhead of at least one core and 2-3G RAM on each node. These resources are not available for Spark anymore. You are wasting a almost 50% of your cluster resources on this overhead because of your EC2 instance sizing. t2.large is too small to be useful with Hadoop.

If you don’t want to spend more money than right now, make fewer but more powerful instances, e.g. 2 instances of c5.xlarge/m5.xlarge or even just single m5.2xlarge. This allows you to squeeze out more resources for Spark.

Comparing the standard KNIME k-Means Learner on a single node, with the Spark k-Means Learner is a bit tricky. The standard KNIME k-Means Learner has very little fixed overhead, and is very fast on small data. The Spark k-Means has high fixed overhead and is slower on small data. But the point about Spark is that the more resources you give to it, the faster it gets - which is not true about the standard k-Means. Also, as a general rule of thumb, it is not wise to use many small machines over a single bigger one. Distributed computing always comes a at a performance cost. One only does that when it is not economical or possible to use a single bigger machine anymore.

Best,
Björn

Hi @bjoern.lohrmann,
thanks as always for the help.

So, I have changed my 4 current instances to 4 c5.xlarge type (4 vCPU and 8gb RAM on each instance) like a sort of experiment, but things still don’t change. The vcore resources are still pretty unused on all the machines and when I try to run Spark Normalizer or Spark k-means nodes, the behaviour is still the same as in the t2.large instances. Just running nodes and not completed after much several time.

I have also set the partition to 200 in Database to Spark node.

Honestly I don’t understand why also with more resources as cluster I’m still not able to perform normalize/clustering operation on 50mln rows. What should be in this case the optimal configuration of Spark parameters? I mean for spark.executor.instances, spark.executor.cores, spark.executor.memory.

Any ideas for fix this situation? @bjoern.lohrmann is there anything that I can provide to you in order to help me better to understand how to handle the problem? I don’t know, additional informations, or some access for take a look etc…

~G

Hi @gujodm

for c5.xlarge (4 cores, 8g RAM ) you should use:

spark.executor.instances: 4
spark.executor.cores: 3
spark.executor.memory: 6g
spark.dynamicAllocation.enabled: false

(our previous settings may have had no effect because dynamic worker allocation was enabled, which is an unfortunate default on CDH).

Hi @bjoern.lohrmann,

with these new parameters I get this error during the execution:

ERROR Database to Spark 0:6 org.apache.spark.network.client.TransportClient: Failed to send RPC 9164358395503239600 to ip-172-31-39-58.us-west-2.compute.internal/172.31.39.58:48902: java.nio.channels.ClosedChannelException
WARN Database to Spark 0:6 org.apache.spark.scheduler.cluster.YarnSchedulerBackend$YarnSchedulerEndpoint: Attempted to get executor loss reason for executor id 3 at RPC address ip-172-31-46-179.us-west-2.compute.internal:57296, but got no response. Marking as slave lost.
ERROR Database to Spark 0:6 org.apache.spark.scheduler.cluster.YarnScheduler: Lost executor 3 on ip-172-31-46-179.us-west-2.compute.internal: Slave lost
ERROR Database to Spark 0:6 org.apache.spark.network.client.TransportClient: Failed to send RPC 6375141664905263473 to ip-172-31-39-58.us-west-2.compute.internal/172.31.39.58:48902: java.nio.channels.ClosedChannelException
WARN Database to Spark 0:6 org.apache.spark.scheduler.cluster.YarnSchedulerBackend$YarnSchedulerEndpoint: Attempted to get executor loss reason for executor id 2 at RPC address ip-172-31-39-58.us-west-2.compute.internal:48924, but got no response. Marking as slave lost.
ERROR Database to Spark 0:6 org.apache.spark.scheduler.cluster.YarnScheduler: Lost executor 2 on ip-172-31-39-58.us-west-2.compute.internal: Slave lost

The node is ‘green’, but it’s evident that something goes wrong.
And in fact if I try to fetch the rdd on Database to Spark node it can’t. It just says:

Spark context does not exist (anymore). Please reset all preceding nodes and rexecute them.

I have also attached the spark-job-server log.
spark-job-server.log (498.7 KB)

Maybe It could be caused by YARN misconfiguration? I have tried all the possible configurations, if I set to default values I get no error in Knime console but when I try to fetch rdd data I get the same message to reset the previous node etc…or it just fetch without any kind of output results.

~G

Hi @gujodm

to say why your Spark Executors are crashing I would need the executor logs.

You can get them from YARN. First, determine the YARN application ID of your failed Spark Context. In the YARN RM WebUI it is the leftmost column labeled ID. Then go to a shell on a cluster node and type:

yarn logs -applicationId PUT_ID_HERE > spark.log

Take a look at the spark.log file, or attach it here.

I have to say we don’t usually give support for correctly setting up CDH and tuning Spark for that. That is for Cloudera to do. Cloudera provides documentation that is worth reading:

https://www.cloudera.com/documentation/enterprise/latest/topics/spark.html

In particular:
https://www.cloudera.com/documentation/enterprise/latest/topics/admin_spark_tuning1.html#spark_tuning__spark_tuning_resource_allocation

That said, you are heavily oversubscribing the memory your nodes which can lead to random crashes. Here are some safer YARN settings that are relevant for your setup:

yarn.nodemanager.resource.cpu-vcores: 3
yarn.nodemanager.resource.memory-mb: 7G
yarn.scheduler.minimum-allocation-mb: 512m
yarn.scheduler.increment-allocation-mb: 512m
yarn.scheduler.maximum-allocation-mb: 7G

Also I would like to correct the Spark settings I have posted previously. I forgot that Spark adds an overhead of 7% to spark.executor.memory (this is described in the lin above). We need to subtract the overhead otherwise resource allocation may not work:

spark.executor.instances: 4
spark.executor.cores: 3
spark.executor.memory: 5600m
spark.dynamicAllocation.enabled: false

This should make Spark request containers with 6G memory.

Some further suggestions:

  • I recommend adding the “Persist Spark DataFrame/RDD” node inbetween Spark Normalizer and Spark k-Means. In its config dialog, set the storage level to “Memory and disk”. k-Means iterates multiple times over your dataset, hence the RDD should be cached, especially considering that it is coming from a MySQL database.

  • If you want to look at your intermediate data I suggest looking at the output of the “Persist Spark DataFrame/RDD” node, so you only have to fetch data once from MySQL.

  • Björn

Hi @bjoern.lohrmann,

I have set everything as you suggested me, now the error in knime console disappears (probably because with these settings it’s more stable), the nodes executed become ‘green’, but I’m still not able to fetch the output also by using the Persist Spark DataFrame/RDD node. I can not understand if the spark rdd has correctly loaded or not cause I’m not able to see a few rows of the output.

And when I need to run spark normalizer and spark k-means the situation is still the same. It runs but it never comes to a conclusion. And I’m also not quite sure if I’m really processing something, for example the rdd loaded in Database to Spark node or not.

The resource usage of the machines is still absent, especially for the cpu usage. So in a certain sense passing from t2.x to c5.x didn’t solve in part the main problem. Cause actually also with t2.x I wasn’t able to use the most of the resources available in the cluster.

~G

Take a look at the WebUI of your Spark Context. It is reachable from the YARN RM WebUI (the Application Master link). I suspect that fetching 50 million rows from MySQL just takes very long.

But I’m fetching just the first 10 rows, and also this doesn’t explain why the resources available are so much unused.

The WebUI of spark context shows this if I click on the specific :

And this if I click on the specific applicationId on YARN:

Actually the knime node are ‘green’ but obviously something goes wrong because I got again some errors in knime console.

If I type on console:

yarn logs -applicationId application_1522841438726_0001 > spark.log

And then I try to take look to the log file generated, is empty.

~G

first screenshot, at the very right in the column “Tracking UI” there is a link call “ApplicationMaster”

The screenshots you have shown are the YARN ResourceManager (RM) WebUI. Not Spark.

If I click on it, then it redirects me to an unreachable page:

http://ip-172-31-34-104.us-west-2.compute.internal:8088/proxy/application_1522841438726_0001/

~G

That’s because the cluster is NAT’ed from the outside world and you are accessing it via its public IP.

In the URL, replace

ip-172-31-34-104.us-west-2.compute.internal

with the public IP of your master node (the one where the YARN RM runs).

Alright! I have searched for the application_1522841438726_0001 (it was under incomplete applications).


Go look in the stages tab for what it is doing when fetching the rows.

The stage is totally empty. So, this means that is not executing the fetching operation.

UPDATE: After relaunch everything and trying to fetching again, I got this on stage:

And this is the job submitted when I fetch 10 rows (it is already passed 10 minutes):

As you can see, there isn’t any kind of progress of the fetching operation.

So both in Hadoop and in Spark tracking UI we see the same kind of operation with the same id in “running” state. But there is no progress, and the estimated time is undefined. And as consequence also within knime the execution of that operation becomes (more or less) infinite. It won’t never give a result.

###################

ANOTHER UPDATE @bjoern.lohrmann

If I limit the data from MySQL to 100k or 1 mln rows, then the fetching operation of the rdd data went fine. It also performs all the operations including Spark nomalizer node and Spark k-means node in around 7/8 minutes as execution time in case of 100k rows. Something more for 1mln rows… around 15/20 minutes.


This means that with a threshold of at least a couple of millions of rows the spark operations in YARN stop to work or become really slow for some reason. For example if I process more than 5 mln rows everything becomes extremely slow (and in this case the resources remain pretty unused, especially the cpu) and the progress passes from minutes for execution to several hours of execution. (it seems like stuck for real) Too much in comparison to my expectation of speed improvement, it seems the same execution time of normal nodes with a huge volume of data. I supposed that this problem is caused by memory limit or I don’t know exactly.

So, at this point the question is:

  • Is there a way for understand if this slow/stop behaviour occurred when we process more data is caused by a bad cluster configuration? Cause in general the default cloudera configuration should works fine. And also because I still don’t understand why if take a look to the resources of each machine the usage in certain situations remains really low.
  • Is not possible to fetch or perform ETL or machine learning operation with a volume of 50 mln of data with a c5.xlarge cluster?
  • Is there a way to speed-up the operations with more data? Maybe parallelize?
  • Maybe I need more RAM? Maybe should I change to m5.xlarge for have 16gb as memory for each instance?

~G

This topic was automatically closed 90 days after the last reply. New replies are no longer allowed.