I have been looking and trying for a while now but I cannot transform the data in the way I am aiming for.
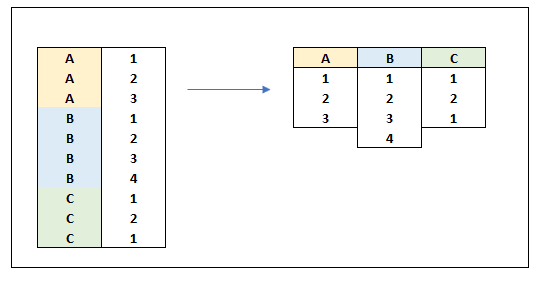
Below is a visualisation of it.
I’d like to point out it would report duplicates (ie. C has two times 1). I’d be happy with “fillers” if columns cannot be of different size, as long as they can be identified and filtered downstream.
Any input, node suggestion or keyword to name this kind of operation would be appreciated.
Thanks a lot Ael, it is exactly the operation I was after.
I plugged the node into my workflow and with a bit of work I got it right.
By any chance, do you know if there is a way to skip the grouping and maintain raw values?
In my case I am interested in looking at the spread directly in addition to SD or other metrics.
If not, I surely can craft a unique tag per record and use that to avoid grouping.
It might be my configuration of the Pivoting node and I need more experience with it.
My understanding of it so far is that eventually it will process values similarly to the "Group By node.
In my case keeping the raw values rather than descriptive stats about them (mean/median + SD/MAD) would be helpful.
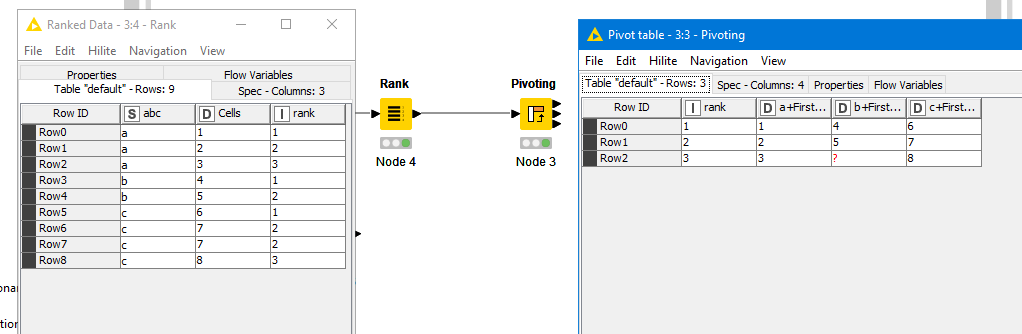
ie. For A the pivoted table would report “Grouped value” of A instead of 1 - 2 - 3.
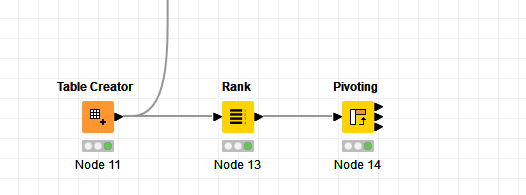
Daniel just below (thanks!) introduced a Rank node which I believe will provide that extra variable to keep all values separated.
There will be a single value for each rank in every column, therefore grouping by Column and Ranking would preserve raw values.
Apologies if my explanation is not crystal clear, I find the overall transformation I am going for a bit peculiar and can’t put precise words on it.
Though the Pivot node is the key, with some workarounds it got me where I needed - thank you!
Thanks Daniel! I did not know this Rank node, it sure is very handy.
Would you mind sharing the configuration you use for the pivoting node?
I am trying to replicate the result but I am struggling to visualise the impact of: groups - pivot - aggregation.
No problem at all @C-Rey and thanks a lot for clarifying what you wanted to add as information. Indeed, the configuration -Pivoting- node is not obvious. The -Groupby- node is much more intuitive and every time I have the choice among using the -Pivoting- or the -Grouping- nodes, definitely I use the latter.
Please get back in touch if you need further information. Glad to further help.
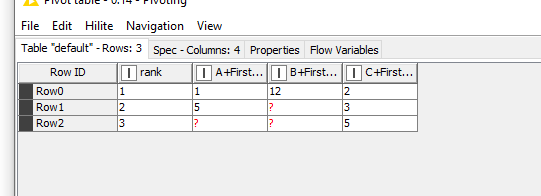
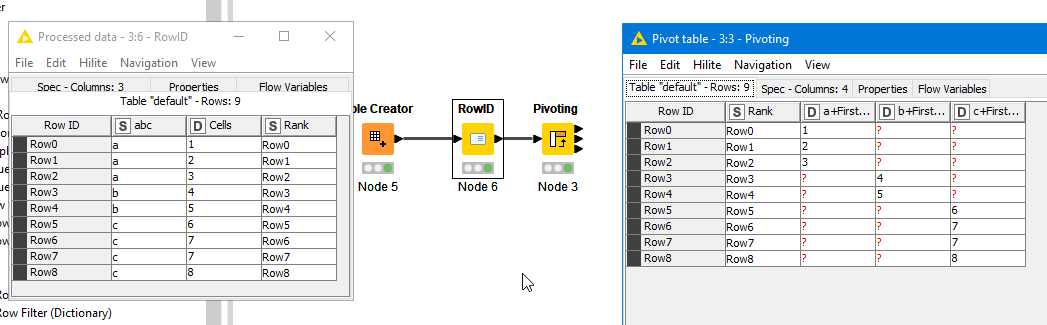
Hi I currently have KNIME not open but I grouped by the rank (created with the rank node) used the A-B-C Column as pivot fields ( = new columns) and use First as the aggregation type. The ranking was done for each group (A-B-C Column. The group can be specified within the rank node)
hope that helps. Let me know
best regards and take care
On larger dataset it will create a massive amount of missing values. It is not the most elegant solution but it puts the data in the exact format I need for the next step. If time allows it I’ll see if I can deal with those but it is not an issue: PRISM is the destination for this data and it can be set to skip empty cells.
Yes correct,
I first used the Counter Node which achieves the same result and then switched to Rank for this use case.
Glad that you find the right adjustment for your use case
br