As being the beginner I’ve stuck in huge data set segregation following is the question I have
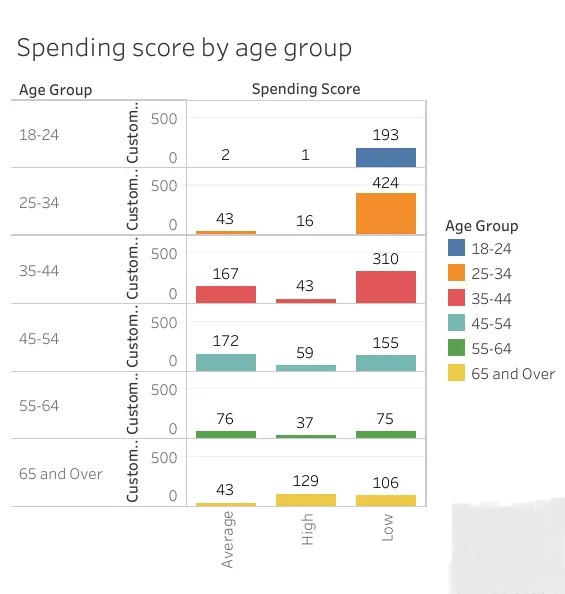
In the attached CSV file I have to know the spending score of each age group wise using the NEW ID created and visualizing it. I’ve also attached image for reference.
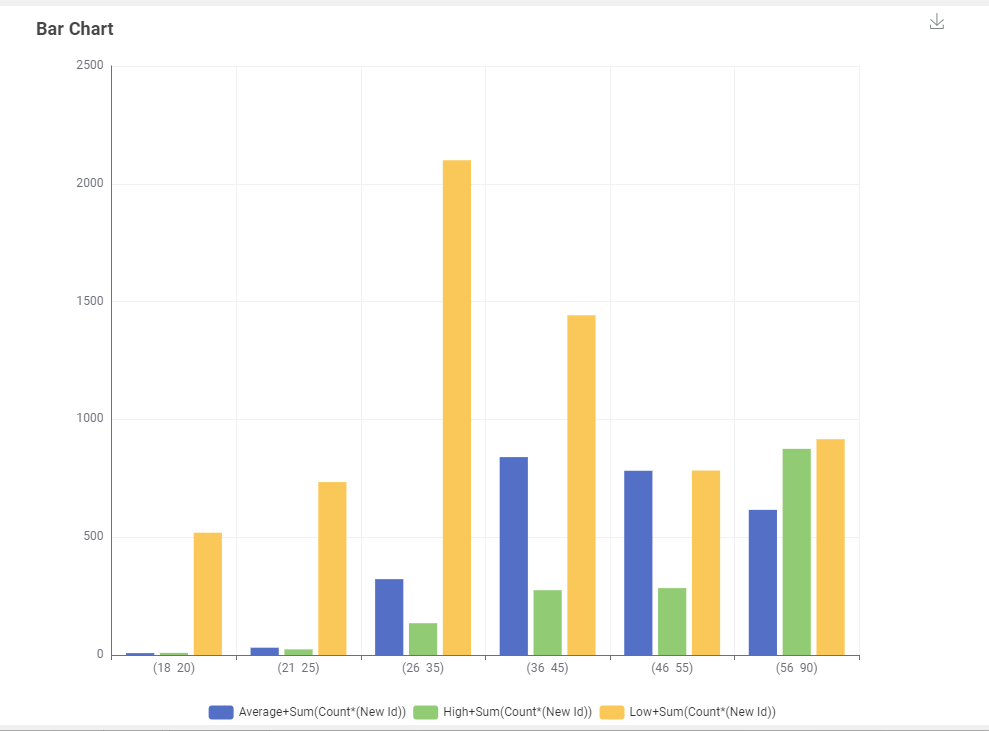
Thank you for your prompt response @rfeigel@Daniel_Weikert I tried to do it by-myself as well in short way and it worked. As the age group distribution I made it is in big name format which was mistake as @rfeigel tried to make it smaller which was also good initiative.