Hi,
can something like this:
http://mbostock.github.io/protovis/ex/sunburst.html
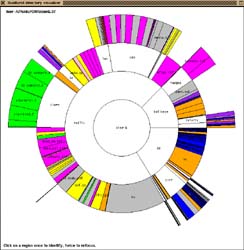
be easily achieved in KNIME?
Thank you,
Jens
Hi,
can something like this:
http://mbostock.github.io/protovis/ex/sunburst.html
be easily achieved in KNIME?
Thank you,
Jens
It depends on your definition of "easy" :)
The most direct route would be to use a generic javascript based view node. Not my area of expertise, but it is possible to do this using that exact library (or better yet, the equivalent in d3.js, linked below) to build the visualization:
http://bl.ocks.org/mbostock/4063423
Alternatively, there is a promising thread on stack overflow using polar coordinate in R with ggplot2:
http://stackoverflow.com/questions/12926779/how-to-make-a-sunburst-plot-in-r-or-python
Thank you Aaron,
I think I will go with the Generic JavaScript View which looks simple enough.
I didn't see the d3.js implementation .. good catch.
Best,
Jens
Hey Jallmer & Aaron,
Have either of you gotten any d3js implementation straight, I'm very interested in it accomplishing it but I still have trouble using the generic JavaScript based node.
Cheers!