I am not a statistician, but if I calculate the standard deviation step by step, I see where the difference arises. standard_deviation.knwf (26.8 KB)
The last step is the sum of the squared deviation between the value given in column1 minus the mean of column1, divided by the number of observations (n), or the number of observations minus 1 (n-1).
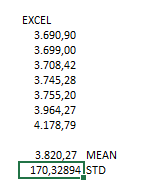
dividing by n => st. deviation = 170.329
dividing by n-1 => st. deviation = 183,967
What situation is correct. I can’t tell. Read more in this article from www.khanacademy.org.
There are two types of Standard Deviation 1. Population Standard Deviation
The population standard deviation, the standard definition of σ, is used when an entire population can be measured, and is the square root of the variance of a given data set.
Where
xi is an individual value μ is the mean/expected value N is the total number of values
2. Sample Standard Deviation
In many cases, it is not possible to sample every member within a population, requiring that the above equation be modified so that the standard deviation can be measured through a random sample of the population being studied.
Where
xi is one sample value x̄ is the sample mean N is the sample size
I used inbuilt functions in excel to calculate using both ways
Sample Standard Deviation gave me answer= 183.9762791
Population Standard Deviation gave me answer=170.328937
KNIME by default uses Sample Standard Deviation in both Statistics node and Math Formula Node