Hi,
I’m very new in KNIME, and I’m struggled in one of the steps.
I’m trying to build a prediction model for medical data. My study aims to classify if a patient is difficult or easy to be intubated during the surgery. These patients are classified as “Easy” or “Difficult”. This feature might be related to patient’s voice. Different parameters of the voice have been measured in the two types of patients.
Once the data is ready, some statistical tests are convenient to identify the significant data. I would like to use the Kolmogorov-Smirnov Test and compare the same parameter for “Easy” and “Difficult” patients. I have already split into two different columns the same feature. For example, the fundamental frequency of the voice in “easy” patients is placed in one column and the fundamental frequency in “difficult” patients is placed in another one.
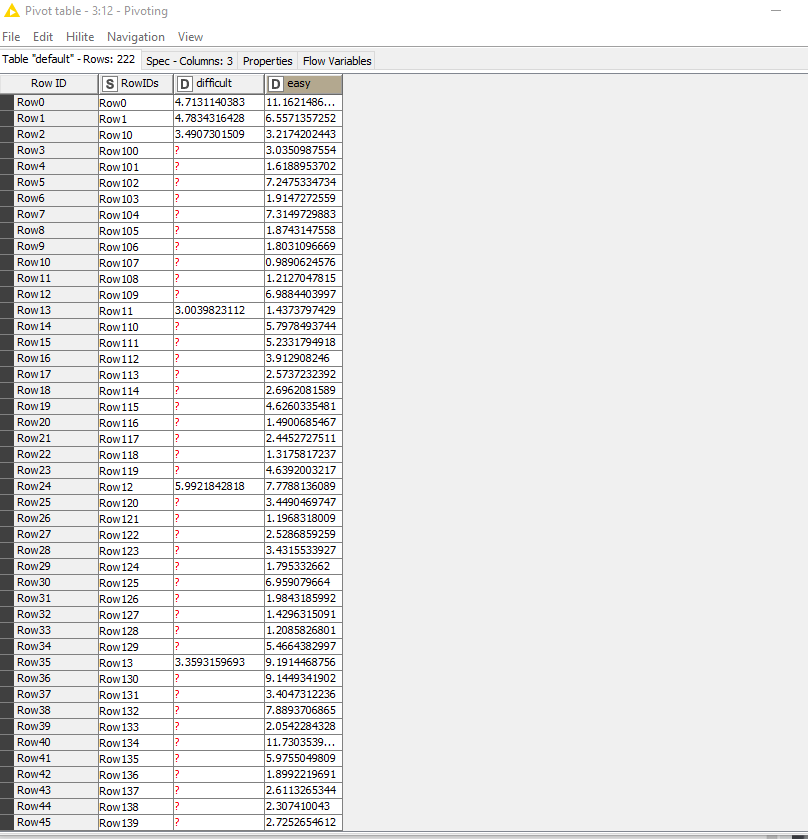
Image of input data in the statistical test:
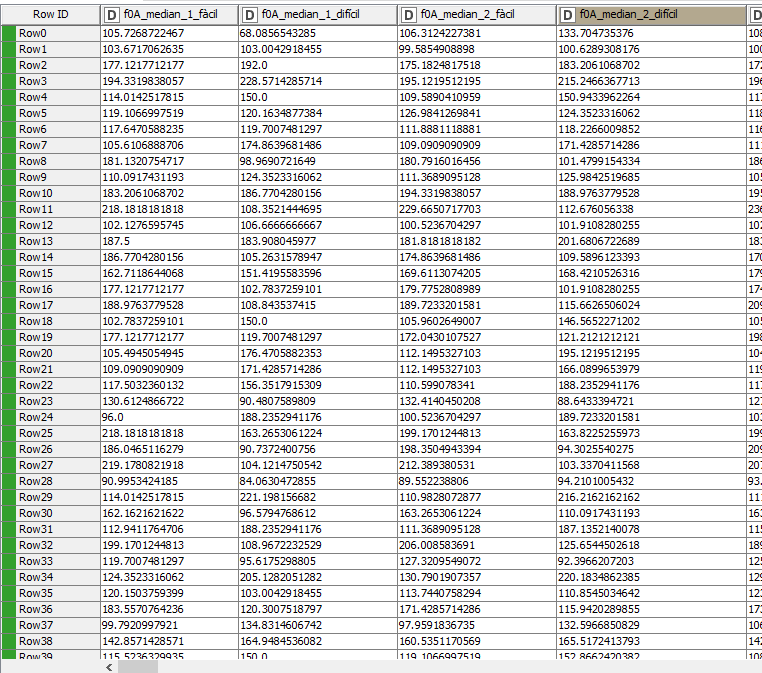
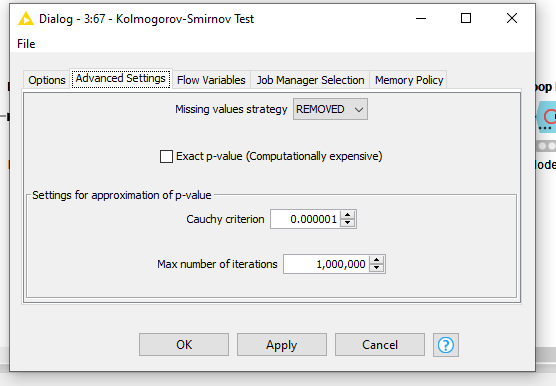
Image of dialog for Kolmogorov-Smirnov Test:
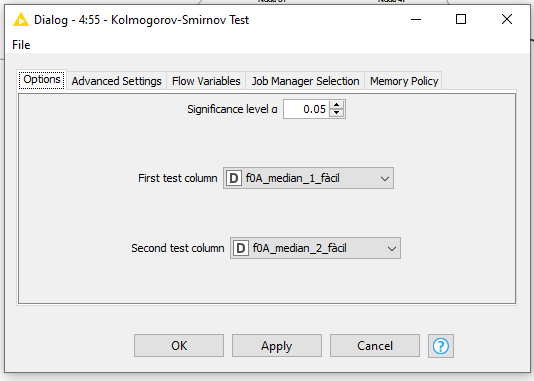
I would like to use the Kolmogorov-Smirnov Test and introduce as testing columns the first and second column and evaluate the results. After that, I would like to introduce as testing columns the third and fourth columns and evaluate the results. And this, consequently for every pair of data. If you pay attention to the picture, pairs of data are named the same, except for the ending (maybe this can help ).
I have an idea of what I should do. I would like to create a loop that introduces every pair of data and evaluates the results. But how can I arrange the pair of data I need? How I introduce them in the Kolmogorov-Smirnov test?
Thank you very much in advance,
Helena