Hello everyone,
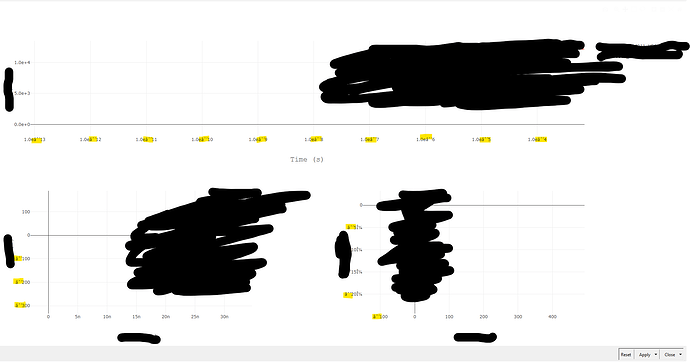
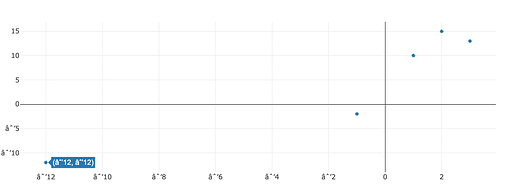
I am using a javascript-view with the Ploty.js - Version 2.26.0 dependency for creating some plots. I noticed that axis values who are negative, display “â^'” instead of an “-”. I was not able to find anything in the Ploty.js forums about that bug. It seems to be related to the charset used.
Helo @Kame_Dev,
Welcome to the Community!
I got a similar setup with making a sample scatter plot and put negative numbers on it. I also go the same formatting issue you got with the a^.
I was able to reproduce it; A ticket has been made detailing the issue.
Ticket AP-23225
Thanks for sharing your findings!
TL
3 Likes
This topic was automatically closed 90 days after the last reply. New replies are no longer allowed.

